Races in Stillwater, Minnesota (MN) Detailed Stats
Data:
Races - White alone (%)
Races - White alone (% change since 2000)
Races - Black alone (%)
Races - Black alone (% change since 2000)
Races - American Indian alone (%)
Races - American Indian alone (% change since 2000)
Races - Asian alone (%)
Races - Asian alone (% change since 2000)
Races - Hispanic (%)
Races - Hispanic (% change since 2000)
Races - Native Hawaiian and Other Pacific Islander alone (%)
Races - Native Hawaiian and Other Pacific Islander alone (% change since 2000)
Races - Two or more races(%)
Races - Two or more races(% change since 2000)
Races - Other race alone (%)
Races - Other race alone (% change since 2000)
Racial diversity
Place of birth - Born in state of residence (%)
Place of birth - Born in state of residence (%) - White
Place of birth - Born in state of residence (%) - Black or African American
Place of birth - Born in state of residence (%) - Asian
Place of birth - Born in state of residence (%) - Hispanic or Latino
Place of birth - Born in state of residence (%) - American Indian and Alaska Native
Place of birth - Born in state of residence (%) - Multirace
Place of birth - Born in state of residence (%) - Other Race
Place of birth - Born in other state (%)
Place of birth - Born in other state (%) - White
Place of birth - Born in other state (%) - Black or African American
Place of birth - Born in other state (%) - Asian
Place of birth - Born in other state (%) - Hispanic or Latino
Place of birth - Born in other state (%) - American Indian and Alaska Native
Place of birth - Born in other state (%) - Multirace
Place of birth - Born in other state (%) - Other Race
Place of birth - Native, outside of US (%)
Place of birth - Native, outside of US (%) - White
Place of birth - Native, outside of US (%) - Black or African American
Place of birth - Native, outside of US (%) - Asian
Place of birth - Native, outside of US (%) - Hispanic or Latino
Place of birth - Native, outside of US (%) - American Indian and Alaska Native
Place of birth - Native, outside of US (%) - Multirace
Place of birth - Native, outside of US (%) - Other Race
Place of birth - Foreign born (%)
Place of birth - Foreign born (%) - White
Place of birth - Foreign born (%) - Black or African American
Place of birth - Foreign born (%) - Asian
Place of birth - Foreign born (%) - Hispanic or Latino
Place of birth - Foreign born (%) - American Indian and Alaska Native
Place of birth - Foreign born (%) - Multirace
Place of birth - Foreign born (%) - Other Race
Residents speaking English at home (%)
Residents speaking English at home - Born in the United States (%)
Residents speaking English at home - Native, born elsewhere (%)
Residents speaking English at home - Foreign born (%)
Residents speaking Spanish at home (%)
Residents speaking Spanish at home - Born in the United States (%)
Residents speaking Spanish at home - Native, born elsewhere (%)
Residents speaking Spanish at home - Foreign born (%)
Residents speaking other language at home (%)
Residents speaking other language at home - Born in the United States (%)
Residents speaking other language at home - Native, born elsewhere (%)
Residents speaking other language at home - Foreign born (%)
Marital status - Never married (%)
Marital status - Now married (%)
Marital status - Separated (%)
Marital status - Widowed (%)
Marital status - Divorced (%)
Ancestries Reported - Arab (%)
Ancestries Reported - Czech (%)
Ancestries Reported - Danish (%)
Ancestries Reported - Dutch (%)
Ancestries Reported - English (%)
Ancestries Reported - French (%)
Ancestries Reported - French Canadian (%)
Ancestries Reported - German (%)
Ancestries Reported - Greek (%)
Ancestries Reported - Hungarian (%)
Ancestries Reported - Irish (%)
Ancestries Reported - Italian (%)
Ancestries Reported - Lithuanian (%)
Ancestries Reported - Norwegian (%)
Ancestries Reported - Polish (%)
Ancestries Reported - Portuguese (%)
Ancestries Reported - Russian (%)
Ancestries Reported - Scotch-Irish (%)
Ancestries Reported - Scottish (%)
Ancestries Reported - Slovak (%)
Ancestries Reported - Subsaharan African (%)
Ancestries Reported - Swedish (%)
Ancestries Reported - Swiss (%)
Ancestries Reported - Ukrainian (%)
Ancestries Reported - United States (%)
Ancestries Reported - Welsh (%)
Ancestries Reported - West Indian (%)
Ancestries Reported - Other (%)
Geographical mobility - Same house 1 year ago (%)
Geographical mobility - Same house 1 year ago (%) - White
Geographical mobility - Same house 1 year ago (%) - Black or African American
Geographical mobility - Same house 1 year ago (%) - Asian
Geographical mobility - Same house 1 year ago (%) - Hispanic or Latino
Geographical mobility - Same house 1 year ago (%) - American Indian and Alaska Native
Geographical mobility - Same house 1 year ago (%) - Multirace
Geographical mobility - Same house 1 year ago (%) - Other Race
Geographical mobility - Moved within same county (%)
Geographical mobility - Moved within same county (%) - White
Geographical mobility - Moved within same county (%) - Black or African American
Geographical mobility - Moved within same county (%) - Asian
Geographical mobility - Moved within same county (%) - Hispanic or Latino
Geographical mobility - Moved within same county (%) - American Indian and Alaska Native
Geographical mobility - Moved within same county (%) - Multirace
Geographical mobility - Moved within same county (%) - Other Race
Geographical mobility - Moved from different county within same state (%)
Geographical mobility - Moved from different county within same state (%) - White
Geographical mobility - Moved from different county within same state (%) - Black or African American
Geographical mobility - Moved from different county within same state (%) - Asian
Geographical mobility - Moved from different county within same state (%) - Hispanic or Latino
Geographical mobility - Moved from different county within same state (%) - American Indian and Alaska Native
Geographical mobility - Moved from different county within same state (%) - Multirace
Geographical mobility - Moved from different county within same state (%) - Other Race
Geographical mobility - Moved from different state (%)
Geographical mobility - Moved from different state (%) - White
Geographical mobility - Moved from different state (%) - Black or African American
Geographical mobility - Moved from different state (%) - Asian
Geographical mobility - Moved from different state (%) - Hispanic or Latino
Geographical mobility - Moved from different state (%) - American Indian and Alaska Native
Geographical mobility - Moved from different state (%) - Multirace
Geographical mobility - Moved from different state (%) - Other Race
Geographical mobility - Moved from abroad (%)
Geographical mobility - Moved from abroad (%) - White
Geographical mobility - Moved from abroad (%) - Black or African American
Geographical mobility - Moved from abroad (%) - Asian
Geographical mobility - Moved from abroad (%) - Hispanic or Latino
Geographical mobility - Moved from abroad (%) - American Indian and Alaska Native
Geographical mobility - Moved from abroad (%) - Multirace
Geographical mobility - Moved from abroad (%) - Other Race
Place of birth for the foreign-born population - Ireland (%)
Place of birth for the foreign-born population - Denmark (%)
Place of birth for the foreign-born population - Norway (%)
Place of birth for the foreign-born population - Sweden (%)
Place of birth for the foreign-born population - United Kingdom (%)
Place of birth for the foreign-born population - England (%)
Place of birth for the foreign-born population - Scotland (%)
Place of birth for the foreign-born population - Other Northern Europe (%)
Place of birth for the foreign-born population - Austria (%)
Place of birth for the foreign-born population - Belgium (%)
Place of birth for the foreign-born population - France (%)
Place of birth for the foreign-born population - Germany (%)
Place of birth for the foreign-born population - Netherlands (%)
Place of birth for the foreign-born population - Switzerland (%)
Place of birth for the foreign-born population - Other Western Europe (%)
Place of birth for the foreign-born population - Greece (%)
Place of birth for the foreign-born population - Italy (%)
Place of birth for the foreign-born population - Portugal (%)
Place of birth for the foreign-born population - Spain (%)
Place of birth for the foreign-born population - Other Southern Europe (%)
Place of birth for the foreign-born population - Albania (%)
Place of birth for the foreign-born population - Belarus (%)
Place of birth for the foreign-born population - Bosnia and Herzegovina (%)
Place of birth for the foreign-born population - Bulgaria (%)
Place of birth for the foreign-born population - Croatia (%)
Place of birth for the foreign-born population - Czechoslovakia (%)
Place of birth for the foreign-born population - Hungary (%)
Place of birth for the foreign-born population - Latvia (%)
Place of birth for the foreign-born population - Lithuania (%)
Place of birth for the foreign-born population - North Macedonia (Macedonia) (%)
Place of birth for the foreign-born population - Moldova (%)
Place of birth for the foreign-born population - Poland (%)
Place of birth for the foreign-born population - Romania (%)
Place of birth for the foreign-born population - Russia (%)
Place of birth for the foreign-born population - Serbia (%)
Place of birth for the foreign-born population - Ukraine (%)
Place of birth for the foreign-born population - Other Eastern Europe (%)
Place of birth for the foreign-born population - China (%)
Place of birth for the foreign-born population - Hong Kong (%)
Place of birth for the foreign-born population - Taiwan (%)
Place of birth for the foreign-born population - Japan (%)
Place of birth for the foreign-born population - Korea (%)
Place of birth for the foreign-born population - Other Eastern Asia (%)
Place of birth for the foreign-born population - Afghanistan (%)
Place of birth for the foreign-born population - Bangladesh (%)
Place of birth for the foreign-born population - India (%)
Place of birth for the foreign-born population - Iran (%)
Place of birth for the foreign-born population - Kazakhstan (%)
Place of birth for the foreign-born population - Nepal (%)
Place of birth for the foreign-born population - Pakistan (%)
Place of birth for the foreign-born population - Sri Lanka (%)
Place of birth for the foreign-born population - Uzbekistan (%)
Place of birth for the foreign-born population - Other South Central Asia (%)
Place of birth for the foreign-born population - Burma (%)
Place of birth for the foreign-born population - Cambodia (%)
Place of birth for the foreign-born population - Indonesia (%)
Place of birth for the foreign-born population - Laos (%)
Place of birth for the foreign-born population - Malaysia (%)
Place of birth for the foreign-born population - Philippines (%)
Place of birth for the foreign-born population - Singapore (%)
Place of birth for the foreign-born population - Thailand (%)
Place of birth for the foreign-born population - Vietnam (%)
Place of birth for the foreign-born population - Other South Eastern Asia (%)
Place of birth for the foreign-born population - Armenia (%)
Place of birth for the foreign-born population - Iraq (%)
Place of birth for the foreign-born population - Israel (%)
Place of birth for the foreign-born population - Jordan (%)
Place of birth for the foreign-born population - Kuwait (%)
Place of birth for the foreign-born population - Lebanon (%)
Place of birth for the foreign-born population - Saudi Arabia (%)
Place of birth for the foreign-born population - Syria (%)
Place of birth for the foreign-born population - Turkey (%)
Place of birth for the foreign-born population - Yemen (%)
Place of birth for the foreign-born population - Other Western Asia (%)
Place of birth for the foreign-born population - Eritrea (%)
Place of birth for the foreign-born population - Ethiopia (%)
Place of birth for the foreign-born population - Kenya (%)
Place of birth for the foreign-born population - Somalia (%)
Place of birth for the foreign-born population - Uganda (%)
Place of birth for the foreign-born population - Zimbabwe (%)
Place of birth for the foreign-born population - Other Eastern Africa (%)
Place of birth for the foreign-born population - Cameroon (%)
Place of birth for the foreign-born population - Congo (%)
Place of birth for the foreign-born population - Democratic Republic of Congo (Zaire) (%)
Place of birth for the foreign-born population - Other Middle Africa (%)
Place of birth for the foreign-born population - Egypt (%)
Place of birth for the foreign-born population - Morocco (%)
Place of birth for the foreign-born population - Sudan (%)
Place of birth for the foreign-born population - Other Northern Africa (%)
Place of birth for the foreign-born population - South Africa (%)
Place of birth for the foreign-born population - Other Southern Africa (%)
Place of birth for the foreign-born population - Cabo Verde (%)
Place of birth for the foreign-born population - Ghana (%)
Place of birth for the foreign-born population - Liberia (%)
Place of birth for the foreign-born population - Nigeria (%)
Place of birth for the foreign-born population - Senegal (%)
Place of birth for the foreign-born population - Sierra Leone (%)
Place of birth for the foreign-born population - Other Western Africa (%)
Place of birth for the foreign-born population - Australia (%)
Place of birth for the foreign-born population - New Zealand (%)
Place of birth for the foreign-born population - Fiji (%)
Place of birth for the foreign-born population - Micronesia (%)
Place of birth for the foreign-born population - Bahamas (%)
Place of birth for the foreign-born population - Barbados (%)
Place of birth for the foreign-born population - Cuba (%)
Place of birth for the foreign-born population - Dominica (%)
Place of birth for the foreign-born population - Dominican Republic (%)
Place of birth for the foreign-born population - Grenada (%)
Place of birth for the foreign-born population - Haiti (%)
Place of birth for the foreign-born population - Jamaica (%)
Place of birth for the foreign-born population - St. Vincent and the Grenadines (%)
Place of birth for the foreign-born population - Trinidad and Tobago (%)
Place of birth for the foreign-born population - West Indies (%)
Place of birth for the foreign-born population - Other Caribbean (%)
Place of birth for the foreign-born population - Belize (%)
Place of birth for the foreign-born population - Costa Rica (%)
Place of birth for the foreign-born population - El Salvador (%)
Place of birth for the foreign-born population - Guatemala (%)
Place of birth for the foreign-born population - Honduras (%)
Place of birth for the foreign-born population - Mexico (%)
Place of birth for the foreign-born population - Nicaragua (%)
Place of birth for the foreign-born population - Panama (%)
Place of birth for the foreign-born population - Other Central America (%)
Place of birth for the foreign-born population - Argentina (%)
Place of birth for the foreign-born population - Bolivia (%)
Place of birth for the foreign-born population - Brazil (%)
Place of birth for the foreign-born population - Chile (%)
Place of birth for the foreign-born population - Colombia (%)
Place of birth for the foreign-born population - Ecuador (%)
Place of birth for the foreign-born population - Guyana (%)
Place of birth for the foreign-born population - Peru (%)
Place of birth for the foreign-born population - Uruguay (%)
Place of birth for the foreign-born population - Venezuela (%)
Place of birth for the foreign-born population - Other South America (%)
Place of birth for the foreign-born population - Canada (%)
Place of birth for the foreign-born population - Other Northern America (%)
Place of birth for the foreign-born population - Other (%)
Latest news about races in Stillwater, MN collected exclusively by city-data.com from local newspapers, TV, and radio stations
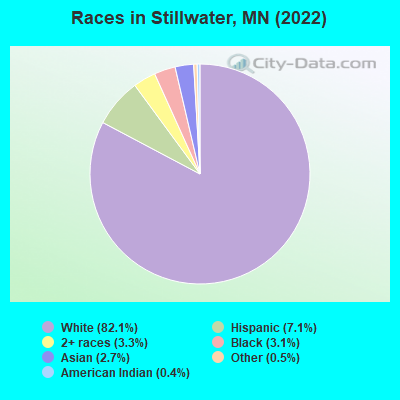
According to 2022 data, the most numerous races in Stillwater, MN are White alone (16,294 residents), Black alone (612 residents), and Hispanic (1,410 residents). 90.8% of Stillwater residents speak English at home. 5.1% of Stillwater, MN residents are foreign-born (2.3% born in Asia, 1.8% born in Latin America, 0.5% born in Europe), which is 57.8% less than the foreign-born rate of 8.0% across the entire state of Minnesota.
Race distribution in Stillwater
2000 2022
4,337,143 88.2% White alone 168,813 3.4% Black alone 143,382 2.9% Hispanic 141,083 2.9% Asian alone 70,304 1.4% Two or more races 52,009 1.1% American Indian alone 5,031 0.1% Other race alone 1,714 0.03% Native Hawaiian and Other
4,356,347 76.2% White alone 395,179 6.9% Black alone 333,830 5.8% Hispanic 294,800 5.2% Asian alone 259,649 4.5% Two or more races 42,125 0.7% American Indian alone 32,976 0.6% Other race alone 2,278 0.04% Native Hawaiian and Other
Income and house value in Stillwater Median household income in 2022 $103,975 White non-Hispanic householders$137,168 Asian householders$66,064 Two or more races householders$93,900 Hispanic or Latino race householdersMedian 2022 house value $411,087 White Non-Hispanic householders$321,640 Black or African American householders $454,887 Asian householders$391,034 Two or more races householders$545,654 Hispanic or Latino householders
Median age by race in Stillwater
44.1 Median age for White residents42.5 46.3 25.4 Median age for Black or African American residents32.7 11.4 52.2 Median age for American Indian / Alaska Native residents48.3 -539,487,178.9 54.9 Median age for Asian residents58.4 54.3 -744,336,568.8 Median age for Native Hawaiian / Pacific Islander residents-856,799,036.4 -534,959,349.1 22.6 Median age for Other race residents22.9 45.5 21.8 Median age for Two or more races residents20.7 22.0 44.5 Median age for White alone residents42.6 47.8 23.4 Median age for Hispanic or Latino residents26.8 11.7
Owner/renter occupied households by race in Stillwater
House owners and renters - White residents 5,678 80.3% Owner occupied1,391 19.7% Renter occupiedHouse owners and renters - Black or African American residents 66 37.0% Owner occupied113 63.0% Renter occupiedHouse owners and renters - Asian residents 267 98.0% Owner occupied5 2.0% Renter occupiedHouse owners and renters - Other race residents 17 12.5% Owner occupied118 87.5% Renter occupiedHouse owners and renters - Two or more races residents 98 31.3% Owner occupied214 68.7% Renter occupiedHouse owners and renters - White alone residents 5,574 79.9% Owner occupied1,406 20.1% Renter occupiedHouse owners and renters - Hispanic or Latino residents 80 27.7% Owner occupied209 72.3% Renter occupied
Language usage in Stillwater
English speakers - Total 90.8% of residents of Stillwater speak English at home.
3.4% of residents speak Spanish at home 396 61.5% Speak English very well248 38.5% Speak English less than very well3.9% of residents speak other language at home 338 45.4% Speak English very well407 54.6% Speak English less than very well
English speakers - Born in the United States 96.9% of residents of Stillwater speak English at home.
1.0% of residents speak Spanish at home 57 100.0% Speak English very well0.3% of residents speak other language at home 18 100.0% Speak English very well
English speakers - Native, born elsewhere 45.0% of residents of Stillwater speak English at home.
39.8% of residents speak other language at home 57 83.8% Speak English very well11 16.2% Speak English less than very well
English speakers - Foreign-born 25.9% of residents of Stillwater speak English at home.
27.2% of residents speak Spanish at home 211 64.3% Speak English very well117 35.7% Speak English less than very well42.4% of residents speak other language at home 239 46.8% Speak English very well272 53.2% Speak English less than very well
White (Caucasian) - Speak only English Native:
98.4% (15,410)Foreign-born:
49.2% (154)
White (Caucasian) - Speak another language Native:
1.7% (260)Foreign-born:
46.3% (145)
Black or African American - Speak only English Native:
73.4% (192)Foreign-born:
22.7% (15)
Black or African American - Speak another language Native:
27.7% (73)Foreign-born:
53.7% (36)
Asian - Speak only English Native:
29.3% (33)Foreign-born:
17.0% (70)
Asian - Speak another language Native:
71.7% (81)Foreign-born:
83.3% (344)
Other race - Speak only English Native:
37.8% (153)Foreign-born:
7.7% (12)
Other race - Speak another language Native:
67.1% (271)Foreign-born:
92.4% (139)
Two or more races - Speak only English Native:
96.1% (1,169)Foreign-born:
32.6% (21)
Two or more races - Speak another language Native:
4.7% (58)Foreign-born:
58.4% (37)
White alone - Speak only English Native:
98.0% (15,046)Foreign-born:
39.9% (164)
White alone - Speak another language Native:
2.1% (315)Foreign-born:
53.3% (219)
Hispanic or Latino - Speak only English Native:
81.4% (936)Foreign-born:
17.6% (32)
Hispanic or Latino - Speak another language Native:
18.2% (209)Foreign-born:
82.0% (147)
Foreign-born residents in Stillwater 1,006 residents are foreign born (2.3% Asia , 1.8% Latin America , 0.5% Europe ).
This city:
5.1%Minnesota:
8.5%
Marital status for residents in Stillwater Marital status - White (Caucasian) population 15 years and over
Males 35.3% Never married51.9% Now married0.3% Separated4.0% Widowed8.7% DivorcedFemales 19.3% Never married57.3% Now married0.7% Separated10.5% Widowed12.2% DivorcedWomen who gave birth in the past 12 months Now married:
96.1% (190)Unmarried:
3.9% (8)
Women who did not give birth in the past 12 months Now married:
56.7% (1,531)Unmarried:
43.3% (1,171)
Marital status - Black or African American population 15 years and over
Males 72.2% Never married20.4% Now married0.0% Separated0.0% Widowed7.3% DivorcedFemales 76.4% Never married23.6% Now married0.0% Separated0.0% Widowed0.0% DivorcedWomen who did not give birth in the past 12 months Now married:
24.1% (13)Unmarried:
75.9% (42)
Marital status - American Indian / Alaska Native population 15 years and over
Males 73.3% Never married0.0% Now married0.0% Separated0.0% Widowed26.7% DivorcedFemales 0.0% Never married100.0% Now married0.0% Separated0.0% Widowed0.0% DivorcedWomen who did not give birth in the past 12 months Now married:
100.0% (7)Unmarried:
0.0% (0)
Marital status - Asian population 15 years and over
Males 20.5% Never married54.2% Now married0.0% Separated0.0% Widowed25.3% DivorcedFemales 10.3% Never married53.4% Now married0.0% Separated3.9% Widowed32.4% DivorcedWomen who did not give birth in the past 12 months Now married:
83.8% (65)Unmarried:
16.2% (12)
Marital status - Other race population 15 years and over
Males 64.3% Never married35.7% Now married0.0% Separated0.0% Widowed0.0% DivorcedFemales 16.2% Never married62.0% Now married0.0% Separated0.0% Widowed21.8% DivorcedWomen who did not give birth in the past 12 months Now married:
79.3% (115)Unmarried:
20.7% (30)
Marital status - Two or more races population 15 years and over
Males 73.6% Never married20.1% Now married0.0% Separated0.0% Widowed6.4% DivorcedFemales 58.8% Never married39.5% Now married0.0% Separated0.0% Widowed1.7% DivorcedWomen who did not give birth in the past 12 months Now married:
42.1% (190)Unmarried:
57.9% (262)
Marital status - White alone, not Hispanic / Latino population 15 years and over
Males 35.6% Never married51.2% Now married0.3% Separated4.1% Widowed8.9% DivorcedFemales 19.4% Never married57.2% Now married0.7% Separated10.5% Widowed12.3% DivorcedWomen who gave birth in the past 12 months Now married:
96.1% (193)Unmarried:
3.9% (8)
Women who did not give birth in the past 12 months Now married:
56.3% (1,531)Unmarried:
43.7% (1,187)
Marital status - Hispanic or Latino population 15 years and over
Males 50.5% Never married45.6% Now married0.0% Separated0.0% Widowed3.9% DivorcedFemales 27.4% Never married61.1% Now married0.0% Separated0.0% Widowed11.5% DivorcedWomen who did not give birth in the past 12 months Now married:
73.3% (176)Unmarried:
26.7% (64)
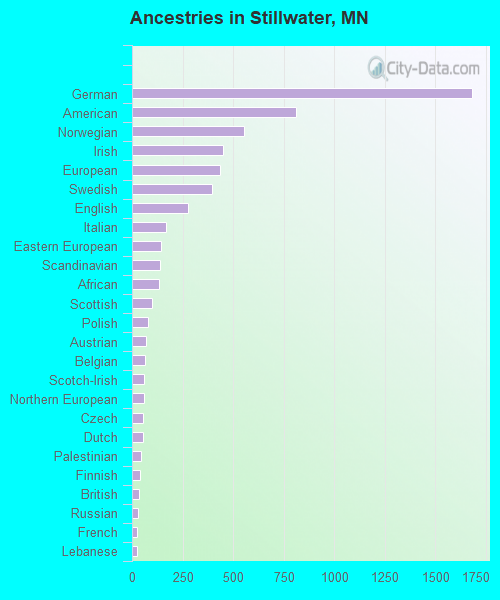
Ancestries in Stillwater
1,683 23.2% German812 11.2% American552 7.6% Norwegian452 6.2% Irish437 6.0% European398 5.5% Swedish275 3.8% English170 2.3% Italian142 2.0% Eastern European138 1.9% Scandinavian132 1.8% African99 1.4% Scottish81 1.1% Polish71 1.0% Austrian62 0.9% Belgian61 0.8% Scotch-Irish59 0.8% Northern European56 0.8% Czech53 0.7% Dutch47 0.6% Palestinian40 0.6% Finnish35 0.5% British28 0.4% Russian26 0.4% French23 0.3% Lebanese20 0.3% Danish19 0.3% French Canadian18 0.2% Serbian16 0.2% Haitian15 0.2% Canadian14 0.2% Sudanese10 0.1% Egyptian9 0.1% Greek8 0.1% Hungarian7 0.10% Ukrainian4 0.06% Latvian
Geographical mobility in Stillwater Same house 1 year ago 14,409 87.7% White (Caucasian)441 81.0% Black or African American38 96.4% American Indian / Alaska Native527 97.3% Asian531 100.0% Other race1,265 92.5% Two or more races14,137 87.4% White alone, not Hispanic / Latino1,162 88.7% Hispanic or LatinoMoved within same county 1,148 7.0% White / Caucasian21 3.9% Black or African American12 2.3% Asian22 1.6% Two or more races1,164 7.2% White alone, not Hispanic / Latino4 0.3% Hispanic or LatinoMoved within same state 654 4.0% White / Caucasian41 7.5% Black or African American1 0.2% Asian73 5.4% Two or more races646 4.0% White alone, not Hispanic / Latino127 9.7% Hispanic or LatinoMoved from different state 160 1.0% White / Caucasian46 8.4% Black or African American2 4.6% American Indian / Alaska Native15 2.8% Asian164 1.0% White alone, not Hispanic / LatinoMoved from abroad 61 0.4% White54 0.3% White alone, not Hispanic / Latino14 1.1% Hispanic or Latino
Children Nativity (place of birth) in Stillwater
Children under 6 years - Living with two parents Both parents native 766 100.0% NativeOne native, one foreign-born parent 1 100.0% NativeChildren under 6 years - Living with one parent Native parent 178 100.0% NativeChildren 6 to 17 years - Living with two parents Both parents native 2,064 98.4% Native33 1.6% Foreign-bornBoth parents foreign-born 125 95.9% Native5 4.1% Foreign-bornOne native, one foreign-born parent 39 100.0% NativeChildren 6 to 17 years - Living with one parent Native parent 516 100.0% NativeForeign-born parent 315 57.5% Native233 42.5% Foreign-born