Races in Stafford, Connecticut (CT) Detailed Stats
Ancestries, Foreign-born residents, place of birth

Recent posts about races in Stafford, Connecticut on our local forum with over 2,400,000 registered users:
 | 2024 Connecticut Town Tournament VI (Celebrating the 10-Year Anniversary & Dazzleman's Memorial) (1055 replies) |
| Buying a house - crumbling foundation issue (10 replies) |
| Economic Climate in CT (18750 replies) |
| Crumbling Foundations (98 replies) |
| What advantages does CT have over other northern states? (49 replies) |
| Current Real estate markets (3987 replies) |
Latest news about races in Stafford, CT collected exclusively by city-data.com from local newspapers, TV, and radio stations
3.3% of Stafford, CT residents are foreign-born (1.1% born in Europe, 0.8% born in North America, 0.7% born in Latin America, 0.6% born in Asia), which is 360.9% less than the foreign-born rate of 15.0% across the entire state of Connecticut.
Race distribution in Stafford

- 10,84895.9%White alone
- 1871.7%Hispanic
- 1020.9%Asian alone
- 800.7%Two or more races
- 600.5%Black alone
- 230.2%American Indian alone
- 70.06%Other race alone

2000
2022
-
- 2,638,84577.5%White alone
- 320,3239.4%Hispanic
- 295,5718.7%Black alone
- 81,5642.4%Asian alone
- 52,8961.6%Two or more races
- 8,1410.2%Other race alone
- 7,2670.2%American Indian alone
- 9580.03%Native Hawaiian and Other
Pacific Islander alone

-
- 2,246,91362.0%White alone
- 658,97818.2%Hispanic
- 353,9739.8%Black alone
- 172,9294.8%Asian alone
- 159,6314.4%Two or more races
- 29,7610.8%Other race alone
- 3,4280.09%American Indian alone
- 5920.02%Native Hawaiian and Other
Pacific Islander alone

Income and house value in Stafford
- Median household income in 2022
- $88,429White non-Hispanic householders
- $61,307Black householders
- $66,308American Indian and Alaska Native householders
- $127,588Asian householders
- $80,777Some other race householders
- $136,412Two or more races householders
- $100,517Hispanic or Latino race householders
- Median 2022 house value
- $277,803White Non-Hispanic householders
- $243,212American Indian or Alaska Native householders
- $182,031Asian householders
- $260,508Two or more races householders
- $353,253Hispanic or Latino householders
Household income for White non-Hispanic householders

Household income for Black householders

Household income for American Indian and Alaska Native householders

Household income for Asian householders

Household income for Two or more races householders

Household income for Hispanic or Latino race householders

Foreign-born residents in Stafford
368 residents are foreign born (1.1% Europe, 0.8% North America, 0.7% Latin America, 0.6% Asia).
| This city: | 3.3% |
| Connecticut: | 10.9% |
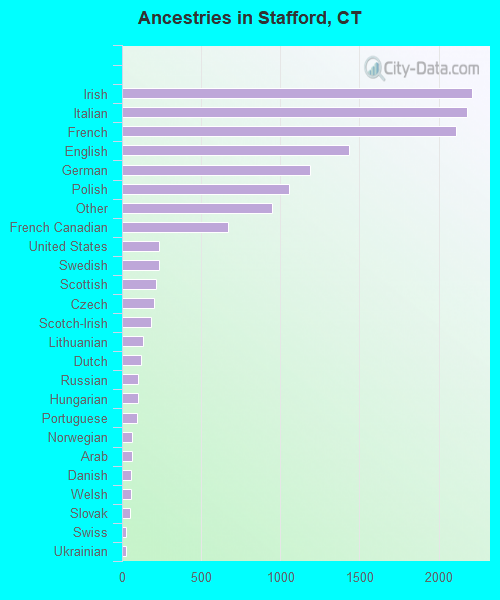
Ancestries in Stafford

- 2,20816.1%Irish
- 2,17715.8%Italian
- 2,11115.3%French
- 1,43610.4%English
- 1,1878.6%German
- 1,0537.7%Polish
- 9506.9%Other
- 6724.9%French Canadian
- 2321.7%United States
- 2311.7%Swedish
- 2131.5%Scottish
- 2011.5%Czech
- 1821.3%Scotch-Irish
- 1351.0%Lithuanian
- 1230.9%Dutch
- 1040.8%Russian
- 1020.7%Hungarian
- 950.7%Portuguese
- 640.5%Norwegian
- 630.5%Arab
- 580.4%Danish
- 560.4%Welsh
- 530.4%Slovak
- 270.2%Swiss
- 240.2%Ukrainian
Zip codes: 06076.