Races in St. Peters, Missouri (MO) Detailed Stats
Data:
Races - White alone (%)
Races - White alone (% change since 2000)
Races - Black alone (%)
Races - Black alone (% change since 2000)
Races - American Indian alone (%)
Races - American Indian alone (% change since 2000)
Races - Asian alone (%)
Races - Asian alone (% change since 2000)
Races - Hispanic (%)
Races - Hispanic (% change since 2000)
Races - Native Hawaiian and Other Pacific Islander alone (%)
Races - Native Hawaiian and Other Pacific Islander alone (% change since 2000)
Races - Two or more races(%)
Races - Two or more races(% change since 2000)
Races - Other race alone (%)
Races - Other race alone (% change since 2000)
Racial diversity
Place of birth - Born in state of residence (%)
Place of birth - Born in state of residence (%) - White
Place of birth - Born in state of residence (%) - Black or African American
Place of birth - Born in state of residence (%) - Asian
Place of birth - Born in state of residence (%) - Hispanic or Latino
Place of birth - Born in state of residence (%) - American Indian and Alaska Native
Place of birth - Born in state of residence (%) - Multirace
Place of birth - Born in state of residence (%) - Other Race
Place of birth - Born in other state (%)
Place of birth - Born in other state (%) - White
Place of birth - Born in other state (%) - Black or African American
Place of birth - Born in other state (%) - Asian
Place of birth - Born in other state (%) - Hispanic or Latino
Place of birth - Born in other state (%) - American Indian and Alaska Native
Place of birth - Born in other state (%) - Multirace
Place of birth - Born in other state (%) - Other Race
Place of birth - Native, outside of US (%)
Place of birth - Native, outside of US (%) - White
Place of birth - Native, outside of US (%) - Black or African American
Place of birth - Native, outside of US (%) - Asian
Place of birth - Native, outside of US (%) - Hispanic or Latino
Place of birth - Native, outside of US (%) - American Indian and Alaska Native
Place of birth - Native, outside of US (%) - Multirace
Place of birth - Native, outside of US (%) - Other Race
Place of birth - Foreign born (%)
Place of birth - Foreign born (%) - White
Place of birth - Foreign born (%) - Black or African American
Place of birth - Foreign born (%) - Asian
Place of birth - Foreign born (%) - Hispanic or Latino
Place of birth - Foreign born (%) - American Indian and Alaska Native
Place of birth - Foreign born (%) - Multirace
Place of birth - Foreign born (%) - Other Race
Residents speaking English at home (%)
Residents speaking English at home - Born in the United States (%)
Residents speaking English at home - Native, born elsewhere (%)
Residents speaking English at home - Foreign born (%)
Residents speaking Spanish at home (%)
Residents speaking Spanish at home - Born in the United States (%)
Residents speaking Spanish at home - Native, born elsewhere (%)
Residents speaking Spanish at home - Foreign born (%)
Residents speaking other language at home (%)
Residents speaking other language at home - Born in the United States (%)
Residents speaking other language at home - Native, born elsewhere (%)
Residents speaking other language at home - Foreign born (%)
Marital status - Never married (%)
Marital status - Now married (%)
Marital status - Separated (%)
Marital status - Widowed (%)
Marital status - Divorced (%)
Ancestries Reported - Arab (%)
Ancestries Reported - Czech (%)
Ancestries Reported - Danish (%)
Ancestries Reported - Dutch (%)
Ancestries Reported - English (%)
Ancestries Reported - French (%)
Ancestries Reported - French Canadian (%)
Ancestries Reported - German (%)
Ancestries Reported - Greek (%)
Ancestries Reported - Hungarian (%)
Ancestries Reported - Irish (%)
Ancestries Reported - Italian (%)
Ancestries Reported - Lithuanian (%)
Ancestries Reported - Norwegian (%)
Ancestries Reported - Polish (%)
Ancestries Reported - Portuguese (%)
Ancestries Reported - Russian (%)
Ancestries Reported - Scotch-Irish (%)
Ancestries Reported - Scottish (%)
Ancestries Reported - Slovak (%)
Ancestries Reported - Subsaharan African (%)
Ancestries Reported - Swedish (%)
Ancestries Reported - Swiss (%)
Ancestries Reported - Ukrainian (%)
Ancestries Reported - United States (%)
Ancestries Reported - Welsh (%)
Ancestries Reported - West Indian (%)
Ancestries Reported - Other (%)
Geographical mobility - Same house 1 year ago (%)
Geographical mobility - Same house 1 year ago (%) - White
Geographical mobility - Same house 1 year ago (%) - Black or African American
Geographical mobility - Same house 1 year ago (%) - Asian
Geographical mobility - Same house 1 year ago (%) - Hispanic or Latino
Geographical mobility - Same house 1 year ago (%) - American Indian and Alaska Native
Geographical mobility - Same house 1 year ago (%) - Multirace
Geographical mobility - Same house 1 year ago (%) - Other Race
Geographical mobility - Moved within same county (%)
Geographical mobility - Moved within same county (%) - White
Geographical mobility - Moved within same county (%) - Black or African American
Geographical mobility - Moved within same county (%) - Asian
Geographical mobility - Moved within same county (%) - Hispanic or Latino
Geographical mobility - Moved within same county (%) - American Indian and Alaska Native
Geographical mobility - Moved within same county (%) - Multirace
Geographical mobility - Moved within same county (%) - Other Race
Geographical mobility - Moved from different county within same state (%)
Geographical mobility - Moved from different county within same state (%) - White
Geographical mobility - Moved from different county within same state (%) - Black or African American
Geographical mobility - Moved from different county within same state (%) - Asian
Geographical mobility - Moved from different county within same state (%) - Hispanic or Latino
Geographical mobility - Moved from different county within same state (%) - American Indian and Alaska Native
Geographical mobility - Moved from different county within same state (%) - Multirace
Geographical mobility - Moved from different county within same state (%) - Other Race
Geographical mobility - Moved from different state (%)
Geographical mobility - Moved from different state (%) - White
Geographical mobility - Moved from different state (%) - Black or African American
Geographical mobility - Moved from different state (%) - Asian
Geographical mobility - Moved from different state (%) - Hispanic or Latino
Geographical mobility - Moved from different state (%) - American Indian and Alaska Native
Geographical mobility - Moved from different state (%) - Multirace
Geographical mobility - Moved from different state (%) - Other Race
Geographical mobility - Moved from abroad (%)
Geographical mobility - Moved from abroad (%) - White
Geographical mobility - Moved from abroad (%) - Black or African American
Geographical mobility - Moved from abroad (%) - Asian
Geographical mobility - Moved from abroad (%) - Hispanic or Latino
Geographical mobility - Moved from abroad (%) - American Indian and Alaska Native
Geographical mobility - Moved from abroad (%) - Multirace
Geographical mobility - Moved from abroad (%) - Other Race
Place of birth for the foreign-born population - Ireland (%)
Place of birth for the foreign-born population - Denmark (%)
Place of birth for the foreign-born population - Norway (%)
Place of birth for the foreign-born population - Sweden (%)
Place of birth for the foreign-born population - United Kingdom (%)
Place of birth for the foreign-born population - England (%)
Place of birth for the foreign-born population - Scotland (%)
Place of birth for the foreign-born population - Other Northern Europe (%)
Place of birth for the foreign-born population - Austria (%)
Place of birth for the foreign-born population - Belgium (%)
Place of birth for the foreign-born population - France (%)
Place of birth for the foreign-born population - Germany (%)
Place of birth for the foreign-born population - Netherlands (%)
Place of birth for the foreign-born population - Switzerland (%)
Place of birth for the foreign-born population - Other Western Europe (%)
Place of birth for the foreign-born population - Greece (%)
Place of birth for the foreign-born population - Italy (%)
Place of birth for the foreign-born population - Portugal (%)
Place of birth for the foreign-born population - Spain (%)
Place of birth for the foreign-born population - Other Southern Europe (%)
Place of birth for the foreign-born population - Albania (%)
Place of birth for the foreign-born population - Belarus (%)
Place of birth for the foreign-born population - Bosnia and Herzegovina (%)
Place of birth for the foreign-born population - Bulgaria (%)
Place of birth for the foreign-born population - Croatia (%)
Place of birth for the foreign-born population - Czechoslovakia (%)
Place of birth for the foreign-born population - Hungary (%)
Place of birth for the foreign-born population - Latvia (%)
Place of birth for the foreign-born population - Lithuania (%)
Place of birth for the foreign-born population - North Macedonia (Macedonia) (%)
Place of birth for the foreign-born population - Moldova (%)
Place of birth for the foreign-born population - Poland (%)
Place of birth for the foreign-born population - Romania (%)
Place of birth for the foreign-born population - Russia (%)
Place of birth for the foreign-born population - Serbia (%)
Place of birth for the foreign-born population - Ukraine (%)
Place of birth for the foreign-born population - Other Eastern Europe (%)
Place of birth for the foreign-born population - China (%)
Place of birth for the foreign-born population - Hong Kong (%)
Place of birth for the foreign-born population - Taiwan (%)
Place of birth for the foreign-born population - Japan (%)
Place of birth for the foreign-born population - Korea (%)
Place of birth for the foreign-born population - Other Eastern Asia (%)
Place of birth for the foreign-born population - Afghanistan (%)
Place of birth for the foreign-born population - Bangladesh (%)
Place of birth for the foreign-born population - India (%)
Place of birth for the foreign-born population - Iran (%)
Place of birth for the foreign-born population - Kazakhstan (%)
Place of birth for the foreign-born population - Nepal (%)
Place of birth for the foreign-born population - Pakistan (%)
Place of birth for the foreign-born population - Sri Lanka (%)
Place of birth for the foreign-born population - Uzbekistan (%)
Place of birth for the foreign-born population - Other South Central Asia (%)
Place of birth for the foreign-born population - Burma (%)
Place of birth for the foreign-born population - Cambodia (%)
Place of birth for the foreign-born population - Indonesia (%)
Place of birth for the foreign-born population - Laos (%)
Place of birth for the foreign-born population - Malaysia (%)
Place of birth for the foreign-born population - Philippines (%)
Place of birth for the foreign-born population - Singapore (%)
Place of birth for the foreign-born population - Thailand (%)
Place of birth for the foreign-born population - Vietnam (%)
Place of birth for the foreign-born population - Other South Eastern Asia (%)
Place of birth for the foreign-born population - Armenia (%)
Place of birth for the foreign-born population - Iraq (%)
Place of birth for the foreign-born population - Israel (%)
Place of birth for the foreign-born population - Jordan (%)
Place of birth for the foreign-born population - Kuwait (%)
Place of birth for the foreign-born population - Lebanon (%)
Place of birth for the foreign-born population - Saudi Arabia (%)
Place of birth for the foreign-born population - Syria (%)
Place of birth for the foreign-born population - Turkey (%)
Place of birth for the foreign-born population - Yemen (%)
Place of birth for the foreign-born population - Other Western Asia (%)
Place of birth for the foreign-born population - Eritrea (%)
Place of birth for the foreign-born population - Ethiopia (%)
Place of birth for the foreign-born population - Kenya (%)
Place of birth for the foreign-born population - Somalia (%)
Place of birth for the foreign-born population - Uganda (%)
Place of birth for the foreign-born population - Zimbabwe (%)
Place of birth for the foreign-born population - Other Eastern Africa (%)
Place of birth for the foreign-born population - Cameroon (%)
Place of birth for the foreign-born population - Congo (%)
Place of birth for the foreign-born population - Democratic Republic of Congo (Zaire) (%)
Place of birth for the foreign-born population - Other Middle Africa (%)
Place of birth for the foreign-born population - Egypt (%)
Place of birth for the foreign-born population - Morocco (%)
Place of birth for the foreign-born population - Sudan (%)
Place of birth for the foreign-born population - Other Northern Africa (%)
Place of birth for the foreign-born population - South Africa (%)
Place of birth for the foreign-born population - Other Southern Africa (%)
Place of birth for the foreign-born population - Cabo Verde (%)
Place of birth for the foreign-born population - Ghana (%)
Place of birth for the foreign-born population - Liberia (%)
Place of birth for the foreign-born population - Nigeria (%)
Place of birth for the foreign-born population - Senegal (%)
Place of birth for the foreign-born population - Sierra Leone (%)
Place of birth for the foreign-born population - Other Western Africa (%)
Place of birth for the foreign-born population - Australia (%)
Place of birth for the foreign-born population - New Zealand (%)
Place of birth for the foreign-born population - Fiji (%)
Place of birth for the foreign-born population - Micronesia (%)
Place of birth for the foreign-born population - Bahamas (%)
Place of birth for the foreign-born population - Barbados (%)
Place of birth for the foreign-born population - Cuba (%)
Place of birth for the foreign-born population - Dominica (%)
Place of birth for the foreign-born population - Dominican Republic (%)
Place of birth for the foreign-born population - Grenada (%)
Place of birth for the foreign-born population - Haiti (%)
Place of birth for the foreign-born population - Jamaica (%)
Place of birth for the foreign-born population - St. Vincent and the Grenadines (%)
Place of birth for the foreign-born population - Trinidad and Tobago (%)
Place of birth for the foreign-born population - West Indies (%)
Place of birth for the foreign-born population - Other Caribbean (%)
Place of birth for the foreign-born population - Belize (%)
Place of birth for the foreign-born population - Costa Rica (%)
Place of birth for the foreign-born population - El Salvador (%)
Place of birth for the foreign-born population - Guatemala (%)
Place of birth for the foreign-born population - Honduras (%)
Place of birth for the foreign-born population - Mexico (%)
Place of birth for the foreign-born population - Nicaragua (%)
Place of birth for the foreign-born population - Panama (%)
Place of birth for the foreign-born population - Other Central America (%)
Place of birth for the foreign-born population - Argentina (%)
Place of birth for the foreign-born population - Bolivia (%)
Place of birth for the foreign-born population - Brazil (%)
Place of birth for the foreign-born population - Chile (%)
Place of birth for the foreign-born population - Colombia (%)
Place of birth for the foreign-born population - Ecuador (%)
Place of birth for the foreign-born population - Guyana (%)
Place of birth for the foreign-born population - Peru (%)
Place of birth for the foreign-born population - Uruguay (%)
Place of birth for the foreign-born population - Venezuela (%)
Place of birth for the foreign-born population - Other South America (%)
Place of birth for the foreign-born population - Canada (%)
Place of birth for the foreign-born population - Other Northern America (%)
Place of birth for the foreign-born population - Other (%)
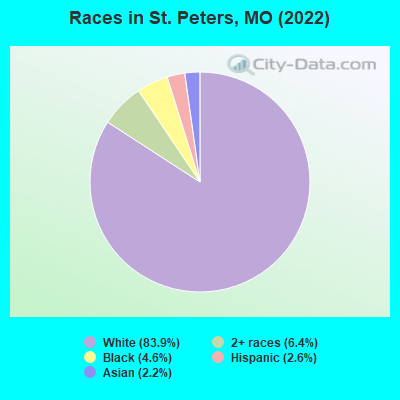
According to 2022 data, the most numerous races in St. Peters, MO are White alone (49,330 residents), Black alone (2,706 residents), and Two or more races (3,752 residents). 96.2% of St. Peters residents speak English at home. 3.0% of St. Peters, MO residents are foreign-born (1.3% born in Asia, 0.8% born in Latin America, 0.6% born in Europe), which is 34.5% less than the foreign-born rate of 4.0% across the entire state of Missouri.
Race distribution in St. Peters
2000 2022
4,686,474 83.8% White alone 625,667 11.2% Black alone 118,592 2.1% Hispanic 71,905 1.3% Two or more races 61,041 1.1% Asian alone 23,302 0.4% American Indian alone 5,291 0.09% Other race alone 2,939 0.05% Native Hawaiian and Other
4,733,411 76.6% White alone 656,739 10.6% Black alone 316,300 5.1% Two or more races 291,763 4.7% Hispanic 132,436 2.1% Asian alone 27,467 0.4% Other race alone 12,313 0.2% American Indian alone 7,528 0.1% Native Hawaiian and Other
Income and house value in St. Peters Median household income in 2022 $88,799 White non-Hispanic householders$111,799 Black householders$151,671 American Indian and Alaska Native householders$88,411 Asian householders$46,523 Some other race householders$54,817 Two or more races householders$57,164 Hispanic or Latino race householdersMedian 2022 house value $261,031 White Non-Hispanic householders$270,103 Black or African American householders$354,467 American Indian or Alaska Native householders $259,217 Asian householders$262,845 Some other race householders$245,383 Two or more races householders$255,815 Hispanic or Latino householders
Median age by race in St. Peters
42.7 Median age for White residents41.1 44.1 35.1 Median age for Black or African American residents39.8 33.6 52.3 Median age for American Indian / Alaska Native residents47.7 44.2 39.6 Median age for Asian residents38.0 39.4 -693,430,656.2 Median age for Native Hawaiian / Pacific Islander residents-683,513,838.1 -752,136,751.4 29.8 Median age for Other race residents31.8 16.2 20.3 Median age for Two or more races residents21.7 19.8 42.6 Median age for White alone residents41.0 44.1 34.1 Median age for Hispanic or Latino residents39.3 30.7
Owner/renter occupied households by race in St. Peters
House owners and renters - White residents 17,417 79.1% Owner occupied4,597 20.9% Renter occupiedHouse owners and renters - Black or African American residents 707 64.9% Owner occupied382 35.1% Renter occupiedHouse owners and renters - American Indian / Alaska Native residents 21 68.2% Owner occupied10 31.8% Renter occupiedHouse owners and renters - Asian residents 283 72.6% Owner occupied107 27.4% Renter occupiedHouse owners and renters - Other race residents 53 90.7% Owner occupied5 9.3% Renter occupiedHouse owners and renters - Two or more races residents 714 76.4% Owner occupied220 23.6% Renter occupiedHouse owners and renters - White alone residents 17,147 79.0% Owner occupied4,562 21.0% Renter occupiedHouse owners and renters - Hispanic or Latino residents 550 91.2% Owner occupied53 8.8% Renter occupied
Language usage in St. Peters
English speakers - Total 96.2% of residents of St. Peters speak English at home.
1.1% of residents speak Spanish at home 441 70.9% Speak English very well181 29.1% Speak English less than very well2.7% of residents speak other language at home 1,003 67.2% Speak English very well489 32.8% Speak English less than very well
English speakers - Born in the United States 96.6% of residents of St. Peters speak English at home.
1.5% of residents speak Spanish at home 160 75.5% Speak English very well52 24.5% Speak English less than very well1.8% of residents speak other language at home 225 90.7% Speak English very well23 9.3% Speak English less than very well
English speakers - Native, born elsewhere 94.8% of residents of St. Peters speak English at home.
English speakers - Foreign-born 25.2% of residents of St. Peters speak English at home.
12.6% of residents speak Spanish at home 139 67.5% Speak English very well67 32.5% Speak English less than very well63.4% of residents speak other language at home 608 58.6% Speak English very well429 41.4% Speak English less than very well
White (Caucasian) - Speak only English Native:
99.4% (46,263)Foreign-born:
37.6% (185)
White (Caucasian) - Speak another language Native:
0.7% (316)Foreign-born:
61.4% (302)
Black or African American - Speak only English Native:
96.2% (2,364)Foreign-born:
3.0% (4)
Black or African American - Speak another language Native:
4.4% (107)Foreign-born:
96.5% (133)
American Indian / Alaska Native - Speak only English Native:
91.2% (42)Foreign-born:
7.8% (1)
Asian - Speak only English Native:
63.3% (303)Foreign-born:
13.5% (106)
Asian - Speak another language Native:
32.6% (156)Foreign-born:
85.7% (670)
Other race - Speak only English Native:
54.4% (63)Foreign-born:
100.0% (79)
Other race - Speak another language Native:
36.6% (43)Foreign-born:
29.0% (23)
White alone - Speak only English Native:
99.4% (45,930)Foreign-born:
34.7% (120)
White alone - Speak another language Native:
0.6% (292)Foreign-born:
66.7% (232)
Hispanic or Latino - Speak only English Native:
70.7% (748)Foreign-born:
54.7% (186)
Hispanic or Latino - Speak another language Native:
29.3% (310)Foreign-born:
60.9% (206)
Foreign-born residents in St. Peters 1,747 residents are foreign born (1.3% Asia , 0.8% Latin America , 0.6% Europe ).
This city:
3.0%Missouri:
4.2%
Marital status for residents in St. Peters Marital status - White (Caucasian) population 15 years and over
Males 27.5% Never married60.6% Now married1.2% Separated2.2% Widowed8.5% DivorcedFemales 24.1% Never married52.1% Now married1.1% Separated8.6% Widowed14.1% DivorcedWomen who gave birth in the past 12 months Now married:
83.0% (639)Unmarried:
17.0% (131)
Women who did not give birth in the past 12 months Now married:
49.8% (5,126)Unmarried:
50.2% (5,169)
Marital status - Black or African American population 15 years and over
Males 44.7% Never married46.5% Now married1.8% Separated1.0% Widowed6.0% DivorcedFemales 47.0% Never married25.1% Now married0.0% Separated10.5% Widowed17.5% DivorcedWomen who gave birth in the past 12 months Now married:
27.7% (28)Unmarried:
72.3% (74)
Women who did not give birth in the past 12 months Now married:
8.5% (56)Unmarried:
91.5% (601)
Marital status - American Indian / Alaska Native population 15 years and over
Males 5.6% Never married94.4% Now married0.0% Separated0.0% Widowed0.0% DivorcedFemales 23.5% Never married11.8% Now married0.0% Separated35.3% Widowed29.4% DivorcedWomen who did not give birth in the past 12 months Now married:
0.0% (0)Unmarried:
100.0% (9)
Marital status - Asian population 15 years and over
Males 34.0% Never married56.5% Now married0.0% Separated2.4% Widowed7.1% DivorcedFemales 15.7% Never married65.9% Now married0.0% Separated2.2% Widowed16.1% DivorcedWomen who gave birth in the past 12 months Now married:
100.0% (12)Unmarried:
0.0% (0)
Women who did not give birth in the past 12 months Now married:
62.5% (194)Unmarried:
37.5% (116)
Marital status - Other race population 15 years and over
Males 53.0% Never married42.4% Now married0.0% Separated0.0% Widowed4.5% DivorcedFemales 40.4% Never married25.0% Now married34.6% Separated0.0% Widowed0.0% DivorcedWomen who did not give birth in the past 12 months Now married:
51.2% (27)Unmarried:
48.8% (26)
Marital status - Two or more races population 15 years and over
Males 44.0% Never married37.9% Now married0.0% Separated9.8% Widowed8.4% DivorcedFemales 54.6% Never married36.6% Now married2.9% Separated2.4% Widowed3.4% DivorcedWomen who did not give birth in the past 12 months Now married:
33.9% (334)Unmarried:
66.1% (652)
Marital status - White alone, not Hispanic / Latino population 15 years and over
Males 27.3% Never married60.8% Now married1.2% Separated2.3% Widowed8.4% DivorcedFemales 24.0% Never married52.3% Now married1.1% Separated8.7% Widowed13.8% DivorcedWomen who gave birth in the past 12 months Now married:
82.8% (629)Unmarried:
17.2% (131)
Women who did not give birth in the past 12 months Now married:
50.1% (5,068)Unmarried:
49.9% (5,052)
Marital status - Hispanic or Latino population 15 years and over
Males 38.6% Never married52.7% Now married0.0% Separated0.0% Widowed8.7% DivorcedFemales 25.5% Never married47.0% Now married8.5% Separated0.0% Widowed19.0% DivorcedWomen who gave birth in the past 12 months Now married:
100.0% (12)Unmarried:
0.0% (0)
Women who did not give birth in the past 12 months Now married:
55.4% (198)Unmarried:
44.6% (159)
Ancestries in St. Peters
7,118 29.3% German3,076 12.6% American2,371 9.7% Irish1,934 8.0% English1,458 6.0% Italian754 3.1% European279 1.1% Polish256 1.1% Ethiopian224 0.9% Scottish195 0.8% Scandinavian164 0.7% Swedish131 0.5% French101 0.4% Romanian98 0.4% Norwegian93 0.4% Scotch-Irish73 0.3% Dutch69 0.3% Welsh63 0.3% French Canadian59 0.2% Lebanese58 0.2% British37 0.2% Swiss31 0.1% Belgian26 0.1% Greek26 0.1% Ukrainian26 0.1% Hungarian24 0.10% Russian23 0.09% Austrian18 0.07% Northern European17 0.07% Slovene15 0.06% Australian15 0.06% Nigerian14 0.06% Canadian12 0.05% Slovak10 0.04% Eastern European10 0.04% Czechoslovakian9 0.04% Danish9 0.04% Cajun4 0.02% Bulgarian
Geographical mobility in St. Peters Same house 1 year ago 44,636 90.8% White (Caucasian)2,451 90.8% Black or African American63 86.6% American Indian / Alaska Native1,211 90.5% Asian44 100.0% Native Hawaiian / Pacific Islander221 85.3% Other race3,835 90.1% Two or more races44,203 90.8% White alone, not Hispanic / Latino1,240 83.4% Hispanic or LatinoMoved within same county 1,856 3.8% White / Caucasian53 2.0% Black or African American11 15.1% American Indian / Alaska Native46 3.4% Asian16 6.1% Other race259 6.1% Two or more races1,849 3.8% White alone, not Hispanic / Latino123 8.3% Hispanic or LatinoMoved within same state 1,898 3.9% White / Caucasian156 5.8% Black or African American70 5.2% Asian21 7.9% Other race108 2.5% Two or more races1,855 3.8% White alone, not Hispanic / Latino164 11.0% Hispanic or LatinoMoved from different state 664 1.4% White / Caucasian56 2.1% Black or African American9 0.7% Asian88 2.1% Two or more races680 1.4% White alone, not Hispanic / LatinoMoved from abroad 63 0.1% White35 1.3% Black or African American36 0.1% White alone, not Hispanic / Latino22 1.5% Hispanic or Latino
Children Nativity (place of birth) in St. Peters
Children under 6 years - Living with two parents Both parents native 3,536 100.0% NativeBoth parents foreign-born 46 100.0% NativeOne native, one foreign-born parent 201 100.0% NativeChildren under 6 years - Living with one parent Native parent 527 100.0% NativeChildren 6 to 17 years - Living with two parents Both parents native 5,941 99.3% Native43 0.7% Foreign-bornBoth parents foreign-born 101 100.0% NativeOne native, one foreign-born parent 132 100.0% NativeChildren 6 to 17 years - Living with one parent Native parent 1,593 100.0% NativeForeign-born parent 118 58.2% Native85 41.8% Foreign-born
Grandparents responsible for own grandchildren in St. Peters
Grandparents (30 to 59 years) White / Caucasian 65 38.8% Responsible for grandchildren103 61.2% Not responsible for grandchildrenBlack or African American 73 100.0% Not responsible for grandchildrenAsian 11 100.0% Not responsible for grandchildrenTwo or more races 26 100.0% Not responsible for grandchildrenWhite alone, not Hispanic / Latino 65 36.4% Responsible for grandchildren114 63.6% Not responsible for grandchildrenGrandparents (60 years and over) White / Caucasian 139 32.1% Responsible for grandchildren293 67.9% Not responsible for grandchildrenBlack or African American 97 100.0% Not responsible for grandchildrenWhite alone, not Hispanic / Latino 126 29.8% Responsible for grandchildren298 70.2% Not responsible for grandchildren