Races in St. Charles, Missouri (MO) Detailed Stats
Data:
Races - White alone (%)
Races - White alone (% change since 2000)
Races - Black alone (%)
Races - Black alone (% change since 2000)
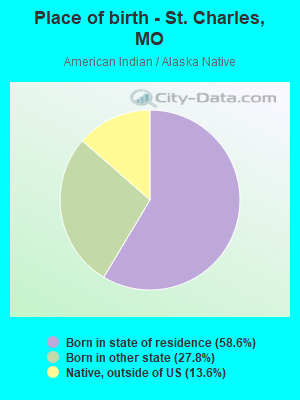
Races - American Indian alone (%)
Races - American Indian alone (% change since 2000)
Races - Asian alone (%)
Races - Asian alone (% change since 2000)
Races - Hispanic (%)
Races - Hispanic (% change since 2000)
Races - Native Hawaiian and Other Pacific Islander alone (%)
Races - Native Hawaiian and Other Pacific Islander alone (% change since 2000)
Races - Two or more races(%)
Races - Two or more races(% change since 2000)
Races - Other race alone (%)
Races - Other race alone (% change since 2000)
Racial diversity
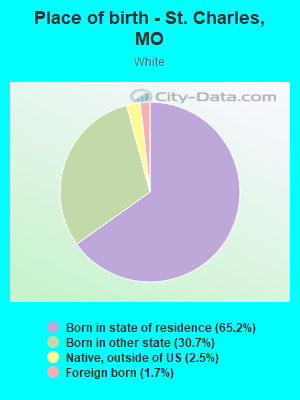
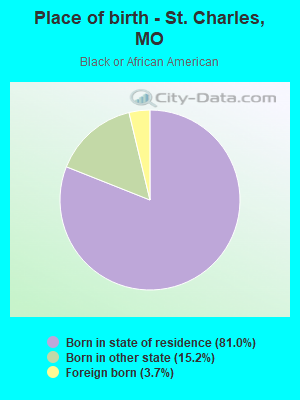
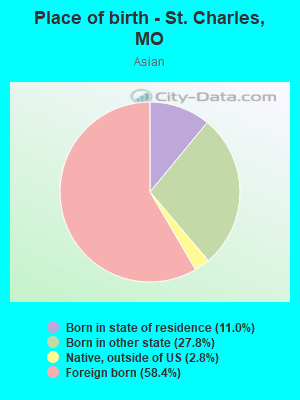
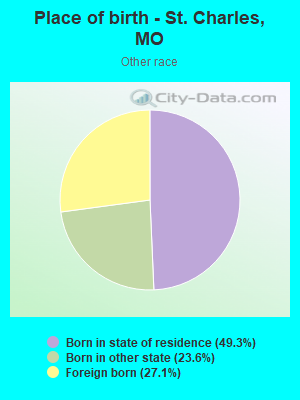
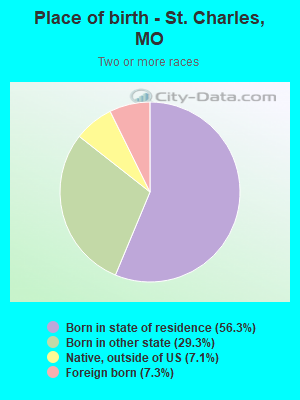
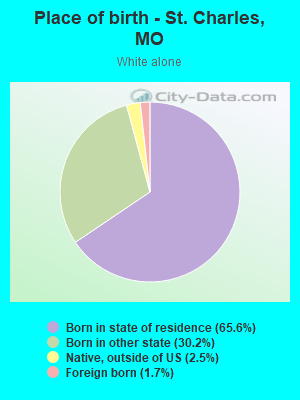
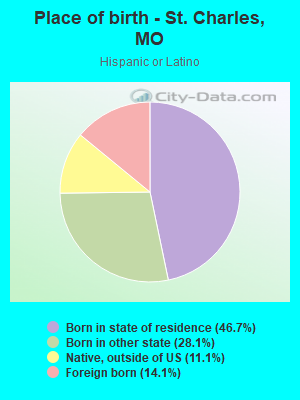
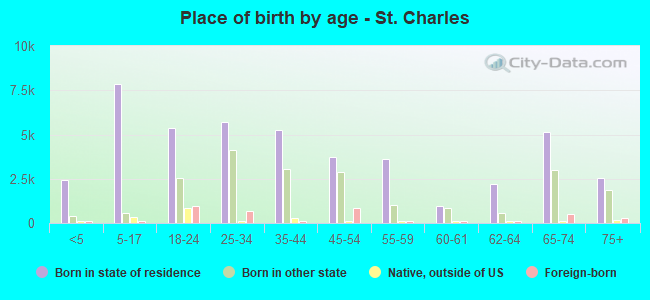
Place of birth - Born in state of residence (%)
Place of birth - Born in state of residence (%) - White
Place of birth - Born in state of residence (%) - Black or African American
Place of birth - Born in state of residence (%) - Asian
Place of birth - Born in state of residence (%) - Hispanic or Latino
Place of birth - Born in state of residence (%) - American Indian and Alaska Native
Place of birth - Born in state of residence (%) - Multirace
Place of birth - Born in state of residence (%) - Other Race
Place of birth - Born in other state (%)
Place of birth - Born in other state (%) - White
Place of birth - Born in other state (%) - Black or African American
Place of birth - Born in other state (%) - Asian
Place of birth - Born in other state (%) - Hispanic or Latino
Place of birth - Born in other state (%) - American Indian and Alaska Native
Place of birth - Born in other state (%) - Multirace
Place of birth - Born in other state (%) - Other Race
Place of birth - Native, outside of US (%)
Place of birth - Native, outside of US (%) - White
Place of birth - Native, outside of US (%) - Black or African American
Place of birth - Native, outside of US (%) - Asian
Place of birth - Native, outside of US (%) - Hispanic or Latino
Place of birth - Native, outside of US (%) - American Indian and Alaska Native
Place of birth - Native, outside of US (%) - Multirace
Place of birth - Native, outside of US (%) - Other Race
Place of birth - Foreign born (%)
Place of birth - Foreign born (%) - White
Place of birth - Foreign born (%) - Black or African American
Place of birth - Foreign born (%) - Asian
Place of birth - Foreign born (%) - Hispanic or Latino
Place of birth - Foreign born (%) - American Indian and Alaska Native
Place of birth - Foreign born (%) - Multirace
Place of birth - Foreign born (%) - Other Race
Residents speaking English at home (%)
Residents speaking English at home - Born in the United States (%)
Residents speaking English at home - Native, born elsewhere (%)
Residents speaking English at home - Foreign born (%)
Residents speaking Spanish at home (%)
Residents speaking Spanish at home - Born in the United States (%)
Residents speaking Spanish at home - Native, born elsewhere (%)
Residents speaking Spanish at home - Foreign born (%)
Residents speaking other language at home (%)
Residents speaking other language at home - Born in the United States (%)
Residents speaking other language at home - Native, born elsewhere (%)
Residents speaking other language at home - Foreign born (%)
Marital status - Never married (%)
Marital status - Now married (%)
Marital status - Separated (%)
Marital status - Widowed (%)
Marital status - Divorced (%)
Ancestries Reported - Arab (%)
Ancestries Reported - Czech (%)
Ancestries Reported - Danish (%)
Ancestries Reported - Dutch (%)
Ancestries Reported - English (%)
Ancestries Reported - French (%)
Ancestries Reported - French Canadian (%)
Ancestries Reported - German (%)
Ancestries Reported - Greek (%)
Ancestries Reported - Hungarian (%)
Ancestries Reported - Irish (%)
Ancestries Reported - Italian (%)
Ancestries Reported - Lithuanian (%)
Ancestries Reported - Norwegian (%)
Ancestries Reported - Polish (%)
Ancestries Reported - Portuguese (%)
Ancestries Reported - Russian (%)
Ancestries Reported - Scotch-Irish (%)
Ancestries Reported - Scottish (%)
Ancestries Reported - Slovak (%)
Ancestries Reported - Subsaharan African (%)
Ancestries Reported - Swedish (%)
Ancestries Reported - Swiss (%)
Ancestries Reported - Ukrainian (%)
Ancestries Reported - United States (%)
Ancestries Reported - Welsh (%)
Ancestries Reported - West Indian (%)
Ancestries Reported - Other (%)
Geographical mobility - Same house 1 year ago (%)
Geographical mobility - Same house 1 year ago (%) - White
Geographical mobility - Same house 1 year ago (%) - Black or African American
Geographical mobility - Same house 1 year ago (%) - Asian
Geographical mobility - Same house 1 year ago (%) - Hispanic or Latino
Geographical mobility - Same house 1 year ago (%) - American Indian and Alaska Native
Geographical mobility - Same house 1 year ago (%) - Multirace
Geographical mobility - Same house 1 year ago (%) - Other Race
Geographical mobility - Moved within same county (%)
Geographical mobility - Moved within same county (%) - White
Geographical mobility - Moved within same county (%) - Black or African American
Geographical mobility - Moved within same county (%) - Asian
Geographical mobility - Moved within same county (%) - Hispanic or Latino
Geographical mobility - Moved within same county (%) - American Indian and Alaska Native
Geographical mobility - Moved within same county (%) - Multirace
Geographical mobility - Moved within same county (%) - Other Race
Geographical mobility - Moved from different county within same state (%)
Geographical mobility - Moved from different county within same state (%) - White
Geographical mobility - Moved from different county within same state (%) - Black or African American
Geographical mobility - Moved from different county within same state (%) - Asian
Geographical mobility - Moved from different county within same state (%) - Hispanic or Latino
Geographical mobility - Moved from different county within same state (%) - American Indian and Alaska Native
Geographical mobility - Moved from different county within same state (%) - Multirace
Geographical mobility - Moved from different county within same state (%) - Other Race
Geographical mobility - Moved from different state (%)
Geographical mobility - Moved from different state (%) - White
Geographical mobility - Moved from different state (%) - Black or African American
Geographical mobility - Moved from different state (%) - Asian
Geographical mobility - Moved from different state (%) - Hispanic or Latino
Geographical mobility - Moved from different state (%) - American Indian and Alaska Native
Geographical mobility - Moved from different state (%) - Multirace
Geographical mobility - Moved from different state (%) - Other Race
Geographical mobility - Moved from abroad (%)
Geographical mobility - Moved from abroad (%) - White
Geographical mobility - Moved from abroad (%) - Black or African American
Geographical mobility - Moved from abroad (%) - Asian
Geographical mobility - Moved from abroad (%) - Hispanic or Latino
Geographical mobility - Moved from abroad (%) - American Indian and Alaska Native
Geographical mobility - Moved from abroad (%) - Multirace
Geographical mobility - Moved from abroad (%) - Other Race
Place of birth for the foreign-born population - Ireland (%)
Place of birth for the foreign-born population - Denmark (%)
Place of birth for the foreign-born population - Norway (%)
Place of birth for the foreign-born population - Sweden (%)
Place of birth for the foreign-born population - United Kingdom (%)
Place of birth for the foreign-born population - England (%)
Place of birth for the foreign-born population - Scotland (%)
Place of birth for the foreign-born population - Other Northern Europe (%)
Place of birth for the foreign-born population - Austria (%)
Place of birth for the foreign-born population - Belgium (%)
Place of birth for the foreign-born population - France (%)
Place of birth for the foreign-born population - Germany (%)
Place of birth for the foreign-born population - Netherlands (%)
Place of birth for the foreign-born population - Switzerland (%)
Place of birth for the foreign-born population - Other Western Europe (%)
Place of birth for the foreign-born population - Greece (%)
Place of birth for the foreign-born population - Italy (%)
Place of birth for the foreign-born population - Portugal (%)
Place of birth for the foreign-born population - Spain (%)
Place of birth for the foreign-born population - Other Southern Europe (%)
Place of birth for the foreign-born population - Albania (%)
Place of birth for the foreign-born population - Belarus (%)
Place of birth for the foreign-born population - Bosnia and Herzegovina (%)
Place of birth for the foreign-born population - Bulgaria (%)
Place of birth for the foreign-born population - Croatia (%)
Place of birth for the foreign-born population - Czechoslovakia (%)
Place of birth for the foreign-born population - Hungary (%)
Place of birth for the foreign-born population - Latvia (%)
Place of birth for the foreign-born population - Lithuania (%)
Place of birth for the foreign-born population - North Macedonia (Macedonia) (%)
Place of birth for the foreign-born population - Moldova (%)
Place of birth for the foreign-born population - Poland (%)
Place of birth for the foreign-born population - Romania (%)
Place of birth for the foreign-born population - Russia (%)
Place of birth for the foreign-born population - Serbia (%)
Place of birth for the foreign-born population - Ukraine (%)
Place of birth for the foreign-born population - Other Eastern Europe (%)
Place of birth for the foreign-born population - China (%)
Place of birth for the foreign-born population - Hong Kong (%)
Place of birth for the foreign-born population - Taiwan (%)
Place of birth for the foreign-born population - Japan (%)
Place of birth for the foreign-born population - Korea (%)
Place of birth for the foreign-born population - Other Eastern Asia (%)
Place of birth for the foreign-born population - Afghanistan (%)
Place of birth for the foreign-born population - Bangladesh (%)
Place of birth for the foreign-born population - India (%)
Place of birth for the foreign-born population - Iran (%)
Place of birth for the foreign-born population - Kazakhstan (%)
Place of birth for the foreign-born population - Nepal (%)
Place of birth for the foreign-born population - Pakistan (%)
Place of birth for the foreign-born population - Sri Lanka (%)
Place of birth for the foreign-born population - Uzbekistan (%)
Place of birth for the foreign-born population - Other South Central Asia (%)
Place of birth for the foreign-born population - Burma (%)
Place of birth for the foreign-born population - Cambodia (%)
Place of birth for the foreign-born population - Indonesia (%)
Place of birth for the foreign-born population - Laos (%)
Place of birth for the foreign-born population - Malaysia (%)
Place of birth for the foreign-born population - Philippines (%)
Place of birth for the foreign-born population - Singapore (%)
Place of birth for the foreign-born population - Thailand (%)
Place of birth for the foreign-born population - Vietnam (%)
Place of birth for the foreign-born population - Other South Eastern Asia (%)
Place of birth for the foreign-born population - Armenia (%)
Place of birth for the foreign-born population - Iraq (%)
Place of birth for the foreign-born population - Israel (%)
Place of birth for the foreign-born population - Jordan (%)
Place of birth for the foreign-born population - Kuwait (%)
Place of birth for the foreign-born population - Lebanon (%)
Place of birth for the foreign-born population - Saudi Arabia (%)
Place of birth for the foreign-born population - Syria (%)
Place of birth for the foreign-born population - Turkey (%)
Place of birth for the foreign-born population - Yemen (%)
Place of birth for the foreign-born population - Other Western Asia (%)
Place of birth for the foreign-born population - Eritrea (%)
Place of birth for the foreign-born population - Ethiopia (%)
Place of birth for the foreign-born population - Kenya (%)
Place of birth for the foreign-born population - Somalia (%)
Place of birth for the foreign-born population - Uganda (%)
Place of birth for the foreign-born population - Zimbabwe (%)
Place of birth for the foreign-born population - Other Eastern Africa (%)
Place of birth for the foreign-born population - Cameroon (%)
Place of birth for the foreign-born population - Congo (%)
Place of birth for the foreign-born population - Democratic Republic of Congo (Zaire) (%)
Place of birth for the foreign-born population - Other Middle Africa (%)
Place of birth for the foreign-born population - Egypt (%)
Place of birth for the foreign-born population - Morocco (%)
Place of birth for the foreign-born population - Sudan (%)
Place of birth for the foreign-born population - Other Northern Africa (%)
Place of birth for the foreign-born population - South Africa (%)
Place of birth for the foreign-born population - Other Southern Africa (%)
Place of birth for the foreign-born population - Cabo Verde (%)
Place of birth for the foreign-born population - Ghana (%)
Place of birth for the foreign-born population - Liberia (%)
Place of birth for the foreign-born population - Nigeria (%)
Place of birth for the foreign-born population - Senegal (%)
Place of birth for the foreign-born population - Sierra Leone (%)
Place of birth for the foreign-born population - Other Western Africa (%)
Place of birth for the foreign-born population - Australia (%)
Place of birth for the foreign-born population - New Zealand (%)
Place of birth for the foreign-born population - Fiji (%)
Place of birth for the foreign-born population - Micronesia (%)
Place of birth for the foreign-born population - Bahamas (%)
Place of birth for the foreign-born population - Barbados (%)
Place of birth for the foreign-born population - Cuba (%)
Place of birth for the foreign-born population - Dominica (%)
Place of birth for the foreign-born population - Dominican Republic (%)
Place of birth for the foreign-born population - Grenada (%)
Place of birth for the foreign-born population - Haiti (%)
Place of birth for the foreign-born population - Jamaica (%)
Place of birth for the foreign-born population - St. Vincent and the Grenadines (%)
Place of birth for the foreign-born population - Trinidad and Tobago (%)
Place of birth for the foreign-born population - West Indies (%)
Place of birth for the foreign-born population - Other Caribbean (%)
Place of birth for the foreign-born population - Belize (%)
Place of birth for the foreign-born population - Costa Rica (%)
Place of birth for the foreign-born population - El Salvador (%)
Place of birth for the foreign-born population - Guatemala (%)
Place of birth for the foreign-born population - Honduras (%)
Place of birth for the foreign-born population - Mexico (%)
Place of birth for the foreign-born population - Nicaragua (%)
Place of birth for the foreign-born population - Panama (%)
Place of birth for the foreign-born population - Other Central America (%)
Place of birth for the foreign-born population - Argentina (%)
Place of birth for the foreign-born population - Bolivia (%)
Place of birth for the foreign-born population - Brazil (%)
Place of birth for the foreign-born population - Chile (%)
Place of birth for the foreign-born population - Colombia (%)
Place of birth for the foreign-born population - Ecuador (%)
Place of birth for the foreign-born population - Guyana (%)
Place of birth for the foreign-born population - Peru (%)
Place of birth for the foreign-born population - Uruguay (%)
Place of birth for the foreign-born population - Venezuela (%)
Place of birth for the foreign-born population - Other South America (%)
Place of birth for the foreign-born population - Canada (%)
Place of birth for the foreign-born population - Other Northern America (%)
Place of birth for the foreign-born population - Other (%)
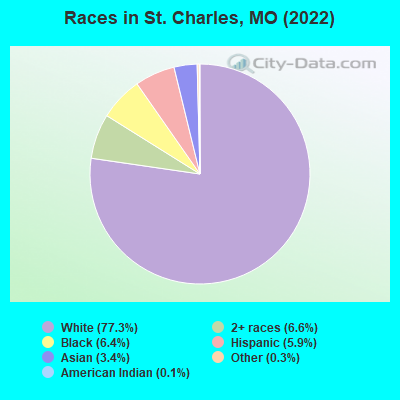
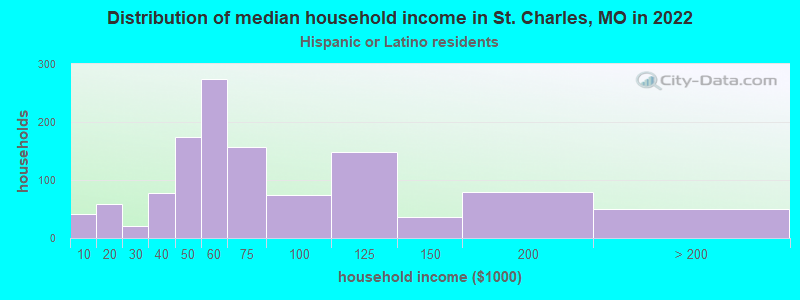
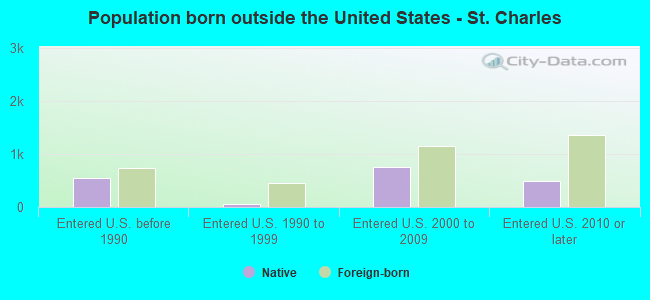
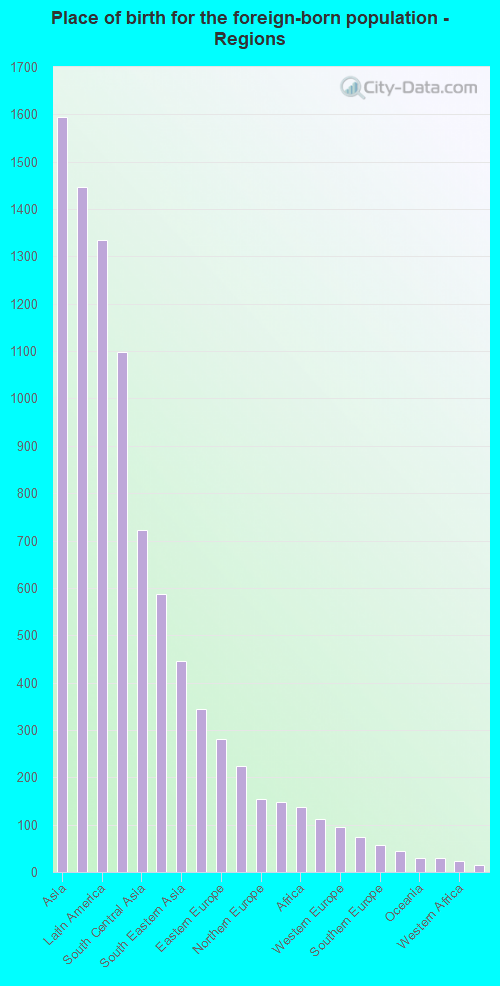
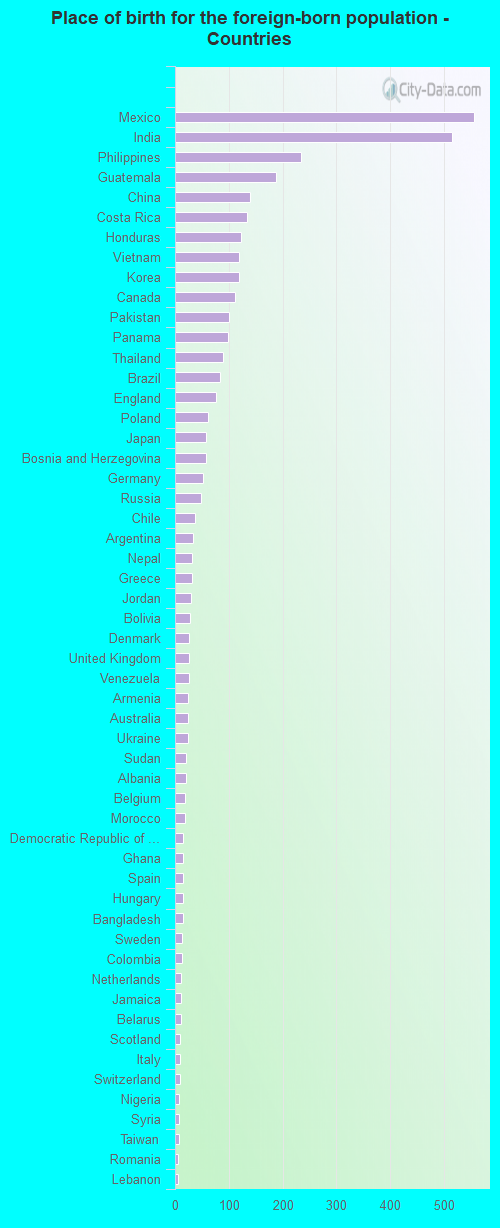
According to 2022 data, the most numerous races in St. Charles, MO are White alone (55,650 residents), Black alone (4,614 residents), and Two or more races (4,780 residents). 93.0% of St. Charles residents speak English at home. 5.3% of St. Charles, MO residents are foreign-born (2.3% born in Asia, 1.9% born in Latin America, 0.9% born in Europe), which is 24.2% greater than the foreign-born rate of 4.0% across the entire state of Missouri.
Race distribution in St. Charles
2000 2022
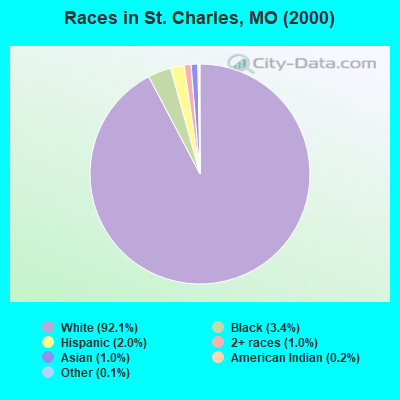
4,686,474 83.8% White alone 625,667 11.2% Black alone 118,592 2.1% Hispanic 71,905 1.3% Two or more races 61,041 1.1% Asian alone 23,302 0.4% American Indian alone 5,291 0.09% Other race alone 2,939 0.05% Native Hawaiian and Other
4,733,411 76.6% White alone 656,739 10.6% Black alone 316,300 5.1% Two or more races 291,763 4.7% Hispanic 132,436 2.1% Asian alone 27,467 0.4% Other race alone 12,313 0.2% American Indian alone 7,528 0.1% Native Hawaiian and Other
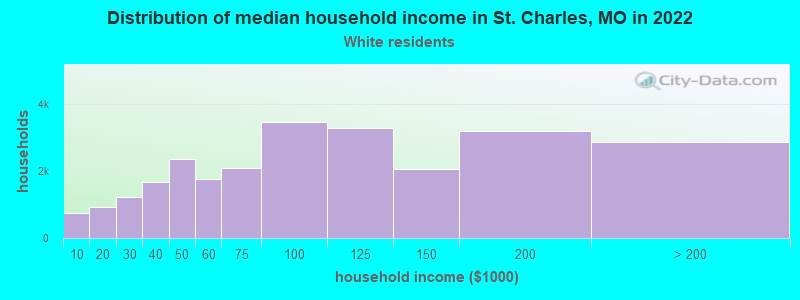
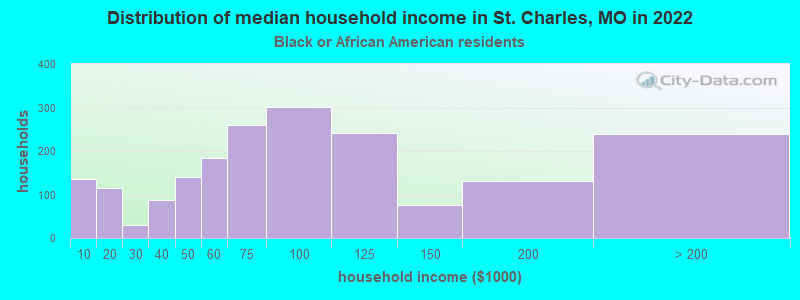
Income and house value in St. Charles Median household income in 2022 $87,351 White non-Hispanic householders$85,396 Black householders$92,193 Asian householders$66,697 Two or more races householders$55,082 Hispanic or Latino race householdersMedian 2022 house value $308,940 White Non-Hispanic householders$289,345 Black or African American householders$267,205 American Indian or Alaska Native householders $340,496 Asian householders$251,936 Two or more races householders$258,807 Hispanic or Latino householders
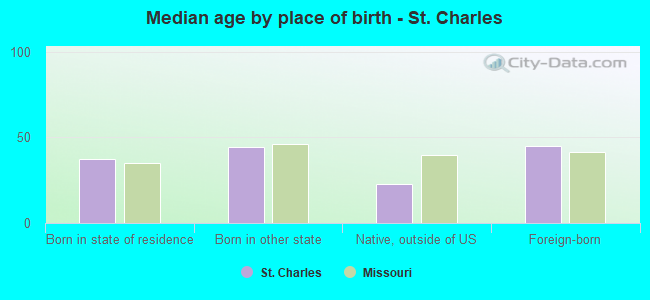
Median age by race in St. Charles
44.2 Median age for White residents44.1 44.3 27.7 Median age for Black or African American residents24.9 27.9 26.1 Median age for American Indian / Alaska Native residents21.9 29.4 43.2 Median age for Asian residents49.1 31.0 -666,666,666.0 Median age for Native Hawaiian / Pacific Islander residents-666,666,666.0 -666,666,666.0 27.9 Median age for Other race residents31.5 13.8 24.5 Median age for Two or more races residents19.9 24.9 44.2 Median age for White alone residents44.0 44.4 22.4 Median age for Hispanic or Latino residents22.2 24.1
Owner/renter occupied households by race in St. Charles
House owners and renters - White residents 17,682 68.6% Owner occupied8,106 31.4% Renter occupiedHouse owners and renters - Black or African American residents 708 45.1% Owner occupied862 54.9% Renter occupiedHouse owners and renters - American Indian / Alaska Native residents 27 51.8% Owner occupied25 48.2% Renter occupiedHouse owners and renters - Asian residents 1,045 85.3% Owner occupied180 14.7% Renter occupiedHouse owners and renters - Other race residents 278 73.4% Owner occupied101 26.6% Renter occupiedHouse owners and renters - Two or more races residents 1,359 59.8% Owner occupied914 40.2% Renter occupiedHouse owners and renters - White alone residents 17,581 68.4% Owner occupied8,106 31.6% Renter occupiedHouse owners and renters - Hispanic or Latino residents 933 79.0% Owner occupied249 21.0% Renter occupied
Language usage in St. Charles
English speakers - Total 93.0% of residents of St. Charles speak English at home.
3.5% of residents speak Spanish at home 1,866 78.8% Speak English very well501 21.2% Speak English less than very well3.4% of residents speak other language at home 1,741 75.0% Speak English very well579 25.0% Speak English less than very well
English speakers - Born in the United States 95.8% of residents of St. Charles speak English at home.
3.2% of residents speak Spanish at home 633 94.6% Speak English very well36 5.4% Speak English less than very well1.4% of residents speak other language at home 265 89.8% Speak English very well30 10.2% Speak English less than very well
English speakers - Native, born elsewhere 74.3% of residents of St. Charles speak English at home.
8.1% of residents speak Spanish at home 40 51.3% Speak English very well38 48.7% Speak English less than very well18.9% of residents speak other language at home 129 70.9% Speak English very well53 29.1% Speak English less than very well
English speakers - Foreign-born 26.0% of residents of St. Charles speak English at home.
22.1% of residents speak Spanish at home 507 64.6% Speak English very well278 35.4% Speak English less than very well48.2% of residents speak other language at home 1,229 71.9% Speak English very well480 28.1% Speak English less than very well
White (Caucasian) - Speak only English Native:
98.8% (51,551)Foreign-born:
14.4% (133)
White (Caucasian) - Speak another language Native:
1.2% (609)Foreign-born:
85.6% (793)
Black or African American - Speak only English Native:
98.4% (4,395)Foreign-born:
17.0% (22)
Black or African American - Speak another language Native:
1.2% (53)Foreign-born:
82.8% (105)
Asian - Speak only English Native:
88.5% (868)Foreign-born:
31.4% (504)
Asian - Speak another language Native:
11.5% (113)Foreign-born:
68.6% (1,101)
Other race - Speak only English Native:
40.3% (328)Foreign-born:
10.3% (48)
Other race - Speak another language Native:
43.6% (354)Foreign-born:
63.8% (297)
Two or more races - Speak only English Native:
86.5% (4,316)Foreign-born:
24.6% (135)
Two or more races - Speak another language Native:
14.7% (733)Foreign-born:
76.0% (418)
White alone - Speak only English Native:
98.9% (51,206)Foreign-born:
14.4% (133)
White alone - Speak another language Native:
1.1% (553)Foreign-born:
85.6% (793)
Hispanic or Latino - Speak only English Native:
58.5% (1,658)Foreign-born:
20.8% (208)
Hispanic or Latino - Speak another language Native:
41.5% (1,176)Foreign-born:
73.9% (740)
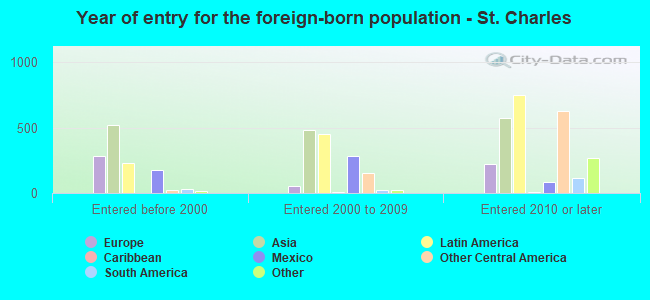
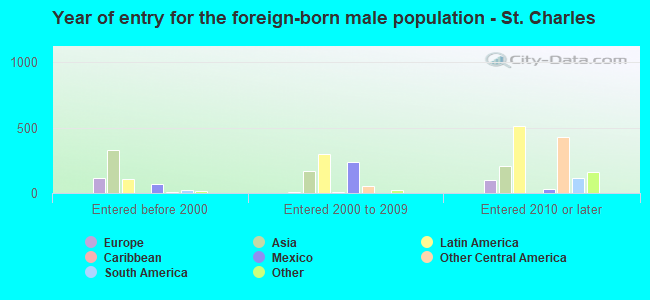
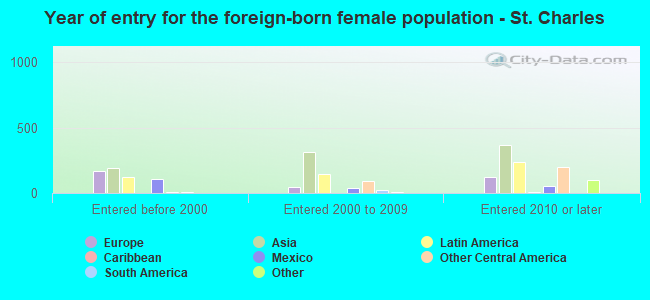
Foreign-born residents in St. Charles 3,798 residents are foreign born (2.3% Asia , 1.9% Latin America , 0.9% Europe ).
This city:
5.3%Missouri:
4.2%
Marital status for residents in St. Charles Marital status - White (Caucasian) population 15 years and over
Males 33.6% Never married50.7% Now married1.0% Separated4.1% Widowed10.5% DivorcedFemales 31.9% Never married47.5% Now married0.4% Separated7.9% Widowed12.2% DivorcedWomen who gave birth in the past 12 months Now married:
100.0% (139)Unmarried:
0.0% (0)
Women who did not give birth in the past 12 months Now married:
38.8% (5,091)Unmarried:
61.2% (8,016)
Marital status - Black or African American population 15 years and over
Males 47.6% Never married42.2% Now married2.4% Separated0.2% Widowed7.6% DivorcedFemales 41.6% Never married32.5% Now married2.2% Separated3.8% Widowed19.9% DivorcedWomen who gave birth in the past 12 months Now married:
75.5% (75)Unmarried:
24.5% (24)
Women who did not give birth in the past 12 months Now married:
28.2% (367)Unmarried:
71.8% (935)
Marital status - American Indian / Alaska Native population 15 years and over
Males 52.8% Never married47.2% Now married0.0% Separated0.0% Widowed0.0% DivorcedFemales 51.5% Never married38.2% Now married0.0% Separated0.0% Widowed10.3% DivorcedWomen who gave birth in the past 12 months Now married:
30.0% (3)Unmarried:
70.0% (7)
Women who did not give birth in the past 12 months Now married:
36.4% (20)Unmarried:
63.6% (34)
Marital status - Asian population 15 years and over
Males 33.7% Never married61.7% Now married0.0% Separated0.0% Widowed4.5% DivorcedFemales 26.8% Never married59.5% Now married1.1% Separated8.2% Widowed4.4% DivorcedWomen who gave birth in the past 12 months Now married:
100.0% (35)Unmarried:
0.0% (0)
Women who did not give birth in the past 12 months Now married:
57.4% (401)Unmarried:
42.6% (298)
Marital status - Other race population 15 years and over
Males 30.7% Never married57.0% Now married5.1% Separated0.0% Widowed7.2% DivorcedFemales 42.8% Never married47.7% Now married0.0% Separated0.0% Widowed9.6% DivorcedWomen who gave birth in the past 12 months Now married:
44.4% (44)Unmarried:
55.6% (55)
Women who did not give birth in the past 12 months Now married:
45.4% (180)Unmarried:
54.6% (217)
Marital status - Two or more races population 15 years and over
Males 47.2% Never married33.3% Now married3.9% Separated0.0% Widowed15.5% DivorcedFemales 47.9% Never married39.0% Now married0.0% Separated2.5% Widowed10.7% DivorcedWomen who gave birth in the past 12 months Now married:
100.0% (32)Unmarried:
0.0% (0)
Women who did not give birth in the past 12 months Now married:
20.6% (281)Unmarried:
79.4% (1,084)
Marital status - White alone, not Hispanic / Latino population 15 years and over
Males 33.3% Never married50.8% Now married1.0% Separated4.1% Widowed10.7% DivorcedFemales 31.7% Never married47.6% Now married0.4% Separated8.0% Widowed12.3% DivorcedWomen who gave birth in the past 12 months Now married:
100.0% (139)Unmarried:
0.0% (0)
Women who did not give birth in the past 12 months Now married:
39.1% (5,091)Unmarried:
60.9% (7,915)
Marital status - Hispanic or Latino population 15 years and over
Males 55.1% Never married36.9% Now married1.1% Separated0.0% Widowed6.9% DivorcedFemales 48.5% Never married32.5% Now married0.0% Separated3.9% Widowed15.1% DivorcedWomen who gave birth in the past 12 months Now married:
38.8% (53)Unmarried:
61.2% (83)
Women who did not give birth in the past 12 months Now married:
35.3% (437)Unmarried:
64.7% (802)
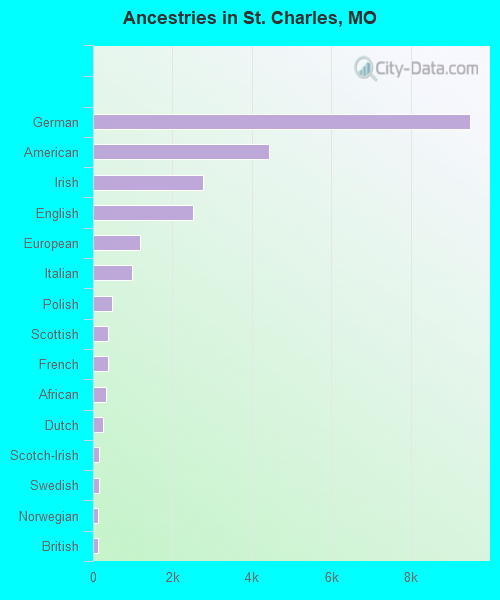
Ancestries in St. Charles
9,495 26.9% German4,432 12.5% American2,781 7.9% Irish2,514 7.1% English1,189 3.4% European975 2.8% Italian474 1.3% Polish377 1.1% Scottish370 1.0% French335 0.9% African260 0.7% Dutch159 0.5% Scotch-Irish156 0.4% Swedish136 0.4% Norwegian120 0.3% British84 0.2% Northern European82 0.2% Belgian80 0.2% Greek77 0.2% Armenian67 0.2% Egyptian65 0.2% Czech62 0.2% Canadian59 0.2% Eastern European58 0.2% Austrian58 0.2% Brazilian58 0.2% Yugoslavian57 0.2% Scandinavian44 0.1% Russian42 0.1% Croatian41 0.1% Swiss40 0.1% Cajun36 0.1% Palestinian33 0.09% Lebanese33 0.09% French Canadian25 0.07% Welsh22 0.06% Czechoslovakian22 0.06% Romanian22 0.06% Sudanese21 0.06% Albanian19 0.05% Portuguese17 0.05% Danish16 0.05% Finnish15 0.04% Hungarian14 0.04% Macedonian14 0.04% Trinidadian and Tobagonian12 0.03% Jordanian12 0.03% Jamaican11 0.03% Slovene8 0.02% Iranian7 0.02% Nigerian4 0.01% Latvian3 0.01% New Zealander3 0.01% Slovak
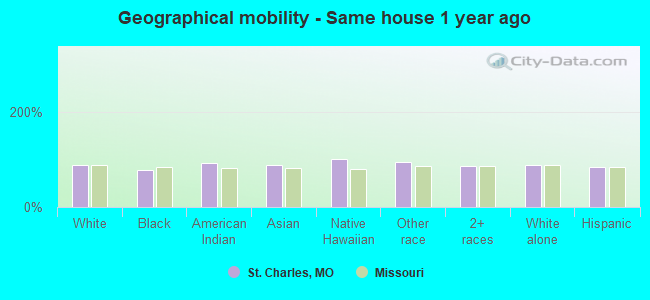
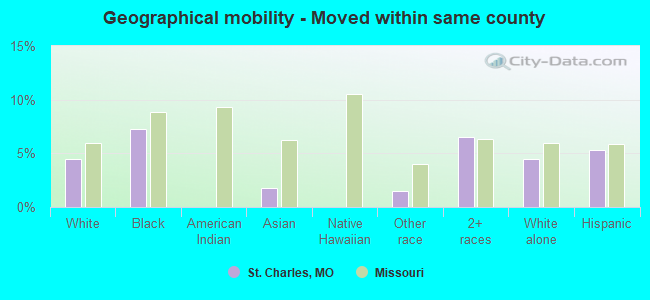
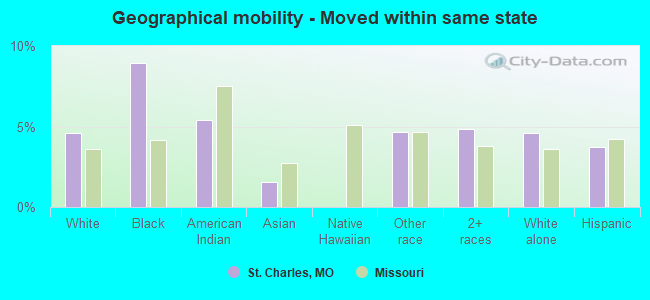
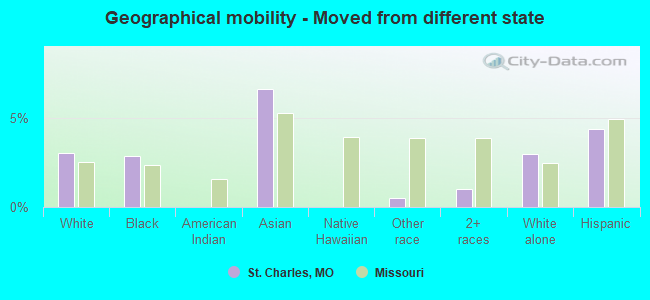
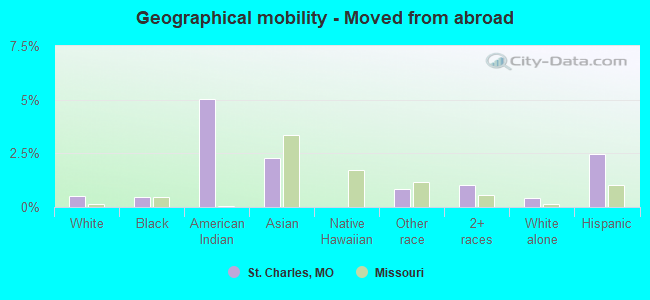
Geographical mobility in St. Charles Same house 1 year ago 47,269 87.4% White (Caucasian)3,670 77.6% Black or African American136 93.4% American Indian / Alaska Native2,334 88.3% Asian4 100.0% Native Hawaiian / Pacific Islander1,543 93.7% Other race5,282 86.1% Two or more races46,969 87.5% White alone, not Hispanic / Latino3,455 83.9% Hispanic or LatinoMoved within same county 2,419 4.5% White / Caucasian345 7.3% Black or African American47 1.8% Asian25 1.5% Other race398 6.5% Two or more races2,419 4.5% White alone, not Hispanic / Latino218 5.3% Hispanic or LatinoMoved within same state 2,482 4.6% White / Caucasian424 9.0% Black or African American8 5.4% American Indian / Alaska Native41 1.6% Asian77 4.7% Other race295 4.8% Two or more races2,482 4.6% White alone, not Hispanic / Latino154 3.7% Hispanic or LatinoMoved from different state 1,643 3.0% White / Caucasian135 2.9% Black or African American174 6.6% Asian8 0.5% Other race63 1.0% Two or more races1,590 3.0% White alone, not Hispanic / Latino179 4.4% Hispanic or LatinoMoved from abroad 276 0.5% White22 0.5% Black or African American7 5.1% American Indian / Alaska Native61 2.3% Asian14 0.8% Other race63 1.0% Two or more races228 0.4% White alone, not Hispanic / Latino102 2.5% Hispanic or Latino
Children Nativity (place of birth) in St. Charles
Children under 6 years - Living with two parents Both parents native 3,115 100.0% NativeBoth parents foreign-born 51 100.0% NativeOne native, one foreign-born parent 323 100.0% NativeChildren under 6 years - Living with one parent Native parent 815 100.0% NativeForeign-born parent 33 100.0% NativeChildren 6 to 17 years - Living with two parents Both parents native 5,012 98.6% Native69 1.4% Foreign-bornBoth parents foreign-born 264 83.8% Native51 16.2% Foreign-bornOne native, one foreign-born parent 116 100.0% NativeChildren 6 to 17 years - Living with one parent Native parent 2,078 100.0% NativeForeign-born parent 97 51.6% Native91 48.4% Foreign-born
Grandparents responsible for own grandchildren in St. Charles
Grandparents (30 to 59 years) White / Caucasian 39 22.5% Responsible for grandchildren134 77.5% Not responsible for grandchildrenBlack or African American 17 32.5% Responsible for grandchildren36 67.5% Not responsible for grandchildrenAsian 7 100.0% Not responsible for grandchildrenTwo or more races 1 11.8% Responsible for grandchildren7 88.2% Not responsible for grandchildrenWhite alone, not Hispanic / Latino 39 20.7% Responsible for grandchildren148 79.3% Not responsible for grandchildrenGrandparents (60 years and over) White / Caucasian 35 7.7% Responsible for grandchildren415 92.3% Not responsible for grandchildrenBlack or African American 7 100.0% Not responsible for grandchildrenAsian 11 58.6% Responsible for grandchildren8 41.4% Not responsible for grandchildrenTwo or more races 16 100.0% Not responsible for grandchildrenWhite alone, not Hispanic / Latino 18 4.2% Responsible for grandchildren405 95.8% Not responsible for grandchildren