Races in Springfield, Oregon (OR) Detailed Stats
Data:
Races - White alone (%)
Races - White alone (% change since 2000)
Races - Black alone (%)
Races - Black alone (% change since 2000)
Races - American Indian alone (%)
Races - American Indian alone (% change since 2000)
Races - Asian alone (%)
Races - Asian alone (% change since 2000)
Races - Hispanic (%)
Races - Hispanic (% change since 2000)
Races - Native Hawaiian and Other Pacific Islander alone (%)
Races - Native Hawaiian and Other Pacific Islander alone (% change since 2000)
Races - Two or more races(%)
Races - Two or more races(% change since 2000)
Races - Other race alone (%)
Races - Other race alone (% change since 2000)
Racial diversity
Place of birth - Born in state of residence (%)
Place of birth - Born in state of residence (%) - White
Place of birth - Born in state of residence (%) - Black or African American
Place of birth - Born in state of residence (%) - Asian
Place of birth - Born in state of residence (%) - Hispanic or Latino
Place of birth - Born in state of residence (%) - American Indian and Alaska Native
Place of birth - Born in state of residence (%) - Multirace
Place of birth - Born in state of residence (%) - Other Race
Place of birth - Born in other state (%)
Place of birth - Born in other state (%) - White
Place of birth - Born in other state (%) - Black or African American
Place of birth - Born in other state (%) - Asian
Place of birth - Born in other state (%) - Hispanic or Latino
Place of birth - Born in other state (%) - American Indian and Alaska Native
Place of birth - Born in other state (%) - Multirace
Place of birth - Born in other state (%) - Other Race
Place of birth - Native, outside of US (%)
Place of birth - Native, outside of US (%) - White
Place of birth - Native, outside of US (%) - Black or African American
Place of birth - Native, outside of US (%) - Asian
Place of birth - Native, outside of US (%) - Hispanic or Latino
Place of birth - Native, outside of US (%) - American Indian and Alaska Native
Place of birth - Native, outside of US (%) - Multirace
Place of birth - Native, outside of US (%) - Other Race
Place of birth - Foreign born (%)
Place of birth - Foreign born (%) - White
Place of birth - Foreign born (%) - Black or African American
Place of birth - Foreign born (%) - Asian
Place of birth - Foreign born (%) - Hispanic or Latino
Place of birth - Foreign born (%) - American Indian and Alaska Native
Place of birth - Foreign born (%) - Multirace
Place of birth - Foreign born (%) - Other Race
Residents speaking English at home (%)
Residents speaking English at home - Born in the United States (%)
Residents speaking English at home - Native, born elsewhere (%)
Residents speaking English at home - Foreign born (%)
Residents speaking Spanish at home (%)
Residents speaking Spanish at home - Born in the United States (%)
Residents speaking Spanish at home - Native, born elsewhere (%)
Residents speaking Spanish at home - Foreign born (%)
Residents speaking other language at home (%)
Residents speaking other language at home - Born in the United States (%)
Residents speaking other language at home - Native, born elsewhere (%)
Residents speaking other language at home - Foreign born (%)
Marital status - Never married (%)
Marital status - Now married (%)
Marital status - Separated (%)
Marital status - Widowed (%)
Marital status - Divorced (%)
Ancestries Reported - Arab (%)
Ancestries Reported - Czech (%)
Ancestries Reported - Danish (%)
Ancestries Reported - Dutch (%)
Ancestries Reported - English (%)
Ancestries Reported - French (%)
Ancestries Reported - French Canadian (%)
Ancestries Reported - German (%)
Ancestries Reported - Greek (%)
Ancestries Reported - Hungarian (%)
Ancestries Reported - Irish (%)
Ancestries Reported - Italian (%)
Ancestries Reported - Lithuanian (%)
Ancestries Reported - Norwegian (%)
Ancestries Reported - Polish (%)
Ancestries Reported - Portuguese (%)
Ancestries Reported - Russian (%)
Ancestries Reported - Scotch-Irish (%)
Ancestries Reported - Scottish (%)
Ancestries Reported - Slovak (%)
Ancestries Reported - Subsaharan African (%)
Ancestries Reported - Swedish (%)
Ancestries Reported - Swiss (%)
Ancestries Reported - Ukrainian (%)
Ancestries Reported - United States (%)
Ancestries Reported - Welsh (%)
Ancestries Reported - West Indian (%)
Ancestries Reported - Other (%)
Geographical mobility - Same house 1 year ago (%)
Geographical mobility - Same house 1 year ago (%) - White
Geographical mobility - Same house 1 year ago (%) - Black or African American
Geographical mobility - Same house 1 year ago (%) - Asian
Geographical mobility - Same house 1 year ago (%) - Hispanic or Latino
Geographical mobility - Same house 1 year ago (%) - American Indian and Alaska Native
Geographical mobility - Same house 1 year ago (%) - Multirace
Geographical mobility - Same house 1 year ago (%) - Other Race
Geographical mobility - Moved within same county (%)
Geographical mobility - Moved within same county (%) - White
Geographical mobility - Moved within same county (%) - Black or African American
Geographical mobility - Moved within same county (%) - Asian
Geographical mobility - Moved within same county (%) - Hispanic or Latino
Geographical mobility - Moved within same county (%) - American Indian and Alaska Native
Geographical mobility - Moved within same county (%) - Multirace
Geographical mobility - Moved within same county (%) - Other Race
Geographical mobility - Moved from different county within same state (%)
Geographical mobility - Moved from different county within same state (%) - White
Geographical mobility - Moved from different county within same state (%) - Black or African American
Geographical mobility - Moved from different county within same state (%) - Asian
Geographical mobility - Moved from different county within same state (%) - Hispanic or Latino
Geographical mobility - Moved from different county within same state (%) - American Indian and Alaska Native
Geographical mobility - Moved from different county within same state (%) - Multirace
Geographical mobility - Moved from different county within same state (%) - Other Race
Geographical mobility - Moved from different state (%)
Geographical mobility - Moved from different state (%) - White
Geographical mobility - Moved from different state (%) - Black or African American
Geographical mobility - Moved from different state (%) - Asian
Geographical mobility - Moved from different state (%) - Hispanic or Latino
Geographical mobility - Moved from different state (%) - American Indian and Alaska Native
Geographical mobility - Moved from different state (%) - Multirace
Geographical mobility - Moved from different state (%) - Other Race
Geographical mobility - Moved from abroad (%)
Geographical mobility - Moved from abroad (%) - White
Geographical mobility - Moved from abroad (%) - Black or African American
Geographical mobility - Moved from abroad (%) - Asian
Geographical mobility - Moved from abroad (%) - Hispanic or Latino
Geographical mobility - Moved from abroad (%) - American Indian and Alaska Native
Geographical mobility - Moved from abroad (%) - Multirace
Geographical mobility - Moved from abroad (%) - Other Race
Place of birth for the foreign-born population - Ireland (%)
Place of birth for the foreign-born population - Denmark (%)
Place of birth for the foreign-born population - Norway (%)
Place of birth for the foreign-born population - Sweden (%)
Place of birth for the foreign-born population - United Kingdom (%)
Place of birth for the foreign-born population - England (%)
Place of birth for the foreign-born population - Scotland (%)
Place of birth for the foreign-born population - Other Northern Europe (%)
Place of birth for the foreign-born population - Austria (%)
Place of birth for the foreign-born population - Belgium (%)
Place of birth for the foreign-born population - France (%)
Place of birth for the foreign-born population - Germany (%)
Place of birth for the foreign-born population - Netherlands (%)
Place of birth for the foreign-born population - Switzerland (%)
Place of birth for the foreign-born population - Other Western Europe (%)
Place of birth for the foreign-born population - Greece (%)
Place of birth for the foreign-born population - Italy (%)
Place of birth for the foreign-born population - Portugal (%)
Place of birth for the foreign-born population - Spain (%)
Place of birth for the foreign-born population - Other Southern Europe (%)
Place of birth for the foreign-born population - Albania (%)
Place of birth for the foreign-born population - Belarus (%)
Place of birth for the foreign-born population - Bosnia and Herzegovina (%)
Place of birth for the foreign-born population - Bulgaria (%)
Place of birth for the foreign-born population - Croatia (%)
Place of birth for the foreign-born population - Czechoslovakia (%)
Place of birth for the foreign-born population - Hungary (%)
Place of birth for the foreign-born population - Latvia (%)
Place of birth for the foreign-born population - Lithuania (%)
Place of birth for the foreign-born population - North Macedonia (Macedonia) (%)
Place of birth for the foreign-born population - Moldova (%)
Place of birth for the foreign-born population - Poland (%)
Place of birth for the foreign-born population - Romania (%)
Place of birth for the foreign-born population - Russia (%)
Place of birth for the foreign-born population - Serbia (%)
Place of birth for the foreign-born population - Ukraine (%)
Place of birth for the foreign-born population - Other Eastern Europe (%)
Place of birth for the foreign-born population - China (%)
Place of birth for the foreign-born population - Hong Kong (%)
Place of birth for the foreign-born population - Taiwan (%)
Place of birth for the foreign-born population - Japan (%)
Place of birth for the foreign-born population - Korea (%)
Place of birth for the foreign-born population - Other Eastern Asia (%)
Place of birth for the foreign-born population - Afghanistan (%)
Place of birth for the foreign-born population - Bangladesh (%)
Place of birth for the foreign-born population - India (%)
Place of birth for the foreign-born population - Iran (%)
Place of birth for the foreign-born population - Kazakhstan (%)
Place of birth for the foreign-born population - Nepal (%)
Place of birth for the foreign-born population - Pakistan (%)
Place of birth for the foreign-born population - Sri Lanka (%)
Place of birth for the foreign-born population - Uzbekistan (%)
Place of birth for the foreign-born population - Other South Central Asia (%)
Place of birth for the foreign-born population - Burma (%)
Place of birth for the foreign-born population - Cambodia (%)
Place of birth for the foreign-born population - Indonesia (%)
Place of birth for the foreign-born population - Laos (%)
Place of birth for the foreign-born population - Malaysia (%)
Place of birth for the foreign-born population - Philippines (%)
Place of birth for the foreign-born population - Singapore (%)
Place of birth for the foreign-born population - Thailand (%)
Place of birth for the foreign-born population - Vietnam (%)
Place of birth for the foreign-born population - Other South Eastern Asia (%)
Place of birth for the foreign-born population - Armenia (%)
Place of birth for the foreign-born population - Iraq (%)
Place of birth for the foreign-born population - Israel (%)
Place of birth for the foreign-born population - Jordan (%)
Place of birth for the foreign-born population - Kuwait (%)
Place of birth for the foreign-born population - Lebanon (%)
Place of birth for the foreign-born population - Saudi Arabia (%)
Place of birth for the foreign-born population - Syria (%)
Place of birth for the foreign-born population - Turkey (%)
Place of birth for the foreign-born population - Yemen (%)
Place of birth for the foreign-born population - Other Western Asia (%)
Place of birth for the foreign-born population - Eritrea (%)
Place of birth for the foreign-born population - Ethiopia (%)
Place of birth for the foreign-born population - Kenya (%)
Place of birth for the foreign-born population - Somalia (%)
Place of birth for the foreign-born population - Uganda (%)
Place of birth for the foreign-born population - Zimbabwe (%)
Place of birth for the foreign-born population - Other Eastern Africa (%)
Place of birth for the foreign-born population - Cameroon (%)
Place of birth for the foreign-born population - Congo (%)
Place of birth for the foreign-born population - Democratic Republic of Congo (Zaire) (%)
Place of birth for the foreign-born population - Other Middle Africa (%)
Place of birth for the foreign-born population - Egypt (%)
Place of birth for the foreign-born population - Morocco (%)
Place of birth for the foreign-born population - Sudan (%)
Place of birth for the foreign-born population - Other Northern Africa (%)
Place of birth for the foreign-born population - South Africa (%)
Place of birth for the foreign-born population - Other Southern Africa (%)
Place of birth for the foreign-born population - Cabo Verde (%)
Place of birth for the foreign-born population - Ghana (%)
Place of birth for the foreign-born population - Liberia (%)
Place of birth for the foreign-born population - Nigeria (%)
Place of birth for the foreign-born population - Senegal (%)
Place of birth for the foreign-born population - Sierra Leone (%)
Place of birth for the foreign-born population - Other Western Africa (%)
Place of birth for the foreign-born population - Australia (%)
Place of birth for the foreign-born population - New Zealand (%)
Place of birth for the foreign-born population - Fiji (%)
Place of birth for the foreign-born population - Micronesia (%)
Place of birth for the foreign-born population - Bahamas (%)
Place of birth for the foreign-born population - Barbados (%)
Place of birth for the foreign-born population - Cuba (%)
Place of birth for the foreign-born population - Dominica (%)
Place of birth for the foreign-born population - Dominican Republic (%)
Place of birth for the foreign-born population - Grenada (%)
Place of birth for the foreign-born population - Haiti (%)
Place of birth for the foreign-born population - Jamaica (%)
Place of birth for the foreign-born population - St. Vincent and the Grenadines (%)
Place of birth for the foreign-born population - Trinidad and Tobago (%)
Place of birth for the foreign-born population - West Indies (%)
Place of birth for the foreign-born population - Other Caribbean (%)
Place of birth for the foreign-born population - Belize (%)
Place of birth for the foreign-born population - Costa Rica (%)
Place of birth for the foreign-born population - El Salvador (%)
Place of birth for the foreign-born population - Guatemala (%)
Place of birth for the foreign-born population - Honduras (%)
Place of birth for the foreign-born population - Mexico (%)
Place of birth for the foreign-born population - Nicaragua (%)
Place of birth for the foreign-born population - Panama (%)
Place of birth for the foreign-born population - Other Central America (%)
Place of birth for the foreign-born population - Argentina (%)
Place of birth for the foreign-born population - Bolivia (%)
Place of birth for the foreign-born population - Brazil (%)
Place of birth for the foreign-born population - Chile (%)
Place of birth for the foreign-born population - Colombia (%)
Place of birth for the foreign-born population - Ecuador (%)
Place of birth for the foreign-born population - Guyana (%)
Place of birth for the foreign-born population - Peru (%)
Place of birth for the foreign-born population - Uruguay (%)
Place of birth for the foreign-born population - Venezuela (%)
Place of birth for the foreign-born population - Other South America (%)
Place of birth for the foreign-born population - Canada (%)
Place of birth for the foreign-born population - Other Northern America (%)
Place of birth for the foreign-born population - Other (%)
Latest news about races in Springfield, OR collected exclusively by city-data.com from local newspapers, TV, and radio stations
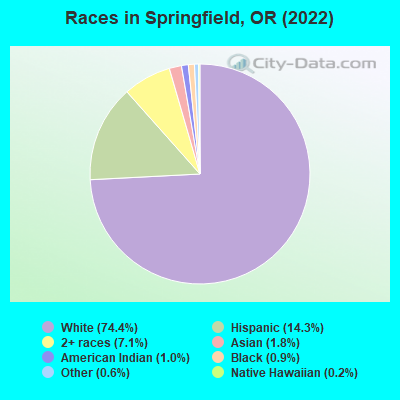
According to 2022 data, the most numerous races in Springfield, OR are White alone (45,924 residents), Hispanic (8,855 residents), and Two or more races (4,395 residents). 89.6% of Springfield residents speak English at home. 6.0% of Springfield, OR residents are foreign-born (3.7% born in Latin America, 1.0% born in Asia, 0.7% born in Europe), which is 49.3% less than the foreign-born rate of 9.0% across the entire state of Oregon.
Race distribution in Springfield
2000 2022
2,857,616 83.5% White alone 275,314 8.0% Hispanic 100,333 2.9% Asian alone 82,733 2.4% Two or more races 53,325 1.6% Black alone 40,130 1.2% American Indian alone 7,398 0.2% Native Hawaiian and Other 4,550 0.1% Other race alone
3,037,571 71.6% White alone 609,538 14.4% Hispanic 252,744 6.0% Two or more races 191,283 4.5% Asian alone 78,228 1.8% Black alone 29,399 0.7% American Indian alone 25,731 0.6% Other race alone 15,643 0.4% Native Hawaiian and Other
Income and house value in Springfield Median household income in 2022 $60,271 White non-Hispanic householders$65,997 Black householders$82,669 American Indian and Alaska Native householders$60,457 Asian householders$57,916 Native Hawaiian and other Pacific Islander householders$57,744 Some other race householders$59,378 Two or more races householders$54,077 Hispanic or Latino race householdersMedian 2022 house value $368,310 White Non-Hispanic householders$455,303 Black or African American householders$404,296 American Indian or Alaska Native householders $305,099 Asian householders$371,752 Native Hawaiian and other Pacific Islander householders$355,480 Some other race householders$319,807 Two or more races householders$360,800 Hispanic or Latino householders
Median age by race in Springfield
40.1 Median age for White residents38.2 42.3 36.4 Median age for Black or African American residents47.3 38.0 33.8 Median age for American Indian / Alaska Native residents33.3 27.2 41.3 Median age for Asian residents23.4 44.6 32.7 Median age for Native Hawaiian / Pacific Islander residents28.5 12.4 32.6 Median age for Other race residents27.5 35.2 29.5 Median age for Two or more races residents26.0 33.6 41.6 Median age for White alone residents39.9 43.0 26.6 Median age for Hispanic or Latino residents24.0 30.3
Owner/renter occupied households by race in Springfield
House owners and renters - White residents 11,909 56.9% Owner occupied9,033 43.1% Renter occupiedHouse owners and renters - Black or African American residents 73 47.9% Owner occupied79 52.1% Renter occupiedHouse owners and renters - American Indian / Alaska Native residents 241 63.8% Owner occupied137 36.2% Renter occupiedHouse owners and renters - Asian residents 192 66.6% Owner occupied96 33.4% Renter occupiedHouse owners and renters - Native Hawaiian / Pacific Islander residents 14 31.4% Owner occupied32 68.6% Renter occupiedHouse owners and renters - Other race residents 322 32.7% Owner occupied661 67.3% Renter occupiedHouse owners and renters - Two or more races residents 1,124 46.5% Owner occupied1,296 53.5% Renter occupiedHouse owners and renters - White alone residents 11,597 57.2% Owner occupied8,680 42.8% Renter occupiedHouse owners and renters - Hispanic or Latino residents 1,024 39.6% Owner occupied1,565 60.4% Renter occupied
Language usage in Springfield
English speakers - Total 89.6% of residents of Springfield speak English at home.
7.7% of residents speak Spanish at home 3,454 77.0% Speak English very well1,032 23.0% Speak English less than very well2.6% of residents speak other language at home 1,193 77.0% Speak English very well356 23.0% Speak English less than very well
English speakers - Born in the United States 93.9% of residents of Springfield speak English at home.
4.1% of residents speak Spanish at home 982 96.3% Speak English very well38 3.7% Speak English less than very well1.6% of residents speak other language at home 373 92.3% Speak English very well31 7.7% Speak English less than very well
English speakers - Native, born elsewhere 80.8% of residents of Springfield speak English at home.
12.1% of residents speak Spanish at home 43 74.1% Speak English very well15 25.9% Speak English less than very well6.5% of residents speak other language at home 31 100.0% Speak English very well
English speakers - Foreign-born 20.8% of residents of Springfield speak English at home.
53.3% of residents speak Spanish at home 1,164 57.7% Speak English very well854 42.3% Speak English less than very well23.1% of residents speak other language at home 556 63.7% Speak English very well317 36.3% Speak English less than very well
White (Caucasian) - Speak only English Native:
97.8% (43,897)Foreign-born:
46.7% (565)
White (Caucasian) - Speak another language Native:
2.2% (966)Foreign-born:
52.6% (636)
Black or African American - Speak another language Native:
11.3% (55)Foreign-born:
99.4% (11)
American Indian / Alaska Native - Speak another language Native:
5.3% (43)Foreign-born:
100.0% (35)
Asian - Speak only English Native:
44.7% (222)Foreign-born:
14.3% (74)
Asian - Speak another language Native:
56.5% (281)Foreign-born:
84.8% (440)
Native Hawaiian / Pacific Islander - Speak another language Native:
72.2% (40)Foreign-born:
96.9% (74)
Other race - Speak only English Native:
56.3% (1,143)Foreign-born:
12.2% (134)
Other race - Speak another language Native:
41.0% (833)Foreign-born:
97.6% (1,074)
Two or more races - Speak only English Native:
88.2% (5,327)Foreign-born:
12.1% (74)
Two or more races - Speak another language Native:
11.8% (713)Foreign-born:
84.0% (513)
White alone - Speak only English Native:
98.8% (42,732)Foreign-born:
61.6% (548)
White alone - Speak another language Native:
1.2% (506)Foreign-born:
38.4% (342)
Hispanic or Latino - Speak only English Native:
60.8% (3,465)Foreign-born:
3.8% (79)
Hispanic or Latino - Speak another language Native:
39.5% (2,254)Foreign-born:
96.1% (2,014)
Foreign-born residents in Springfield 3,724 residents are foreign born (3.7% Latin America , 1.0% Asia , 0.7% Europe ).
This city:
6.0%Oregon:
9.8%
Marital status for residents in Springfield Marital status - White (Caucasian) population 15 years and over
Males 38.2% Never married44.1% Now married1.8% Separated1.8% Widowed14.1% DivorcedFemales 26.4% Never married42.3% Now married2.7% Separated9.1% Widowed19.5% DivorcedWomen who gave birth in the past 12 months Now married:
56.7% (230)Unmarried:
43.3% (175)
Women who did not give birth in the past 12 months Now married:
39.9% (4,318)Unmarried:
60.1% (6,501)
Marital status - Black or African American population 15 years and over
Males 58.7% Never married13.2% Now married0.0% Separated0.0% Widowed28.1% DivorcedFemales 39.4% Never married22.2% Now married0.0% Separated2.0% Widowed36.4% DivorcedWomen who gave birth in the past 12 months Now married:
100.0% (5)Unmarried:
0.0% (0)
Women who did not give birth in the past 12 months Now married:
34.1% (16)Unmarried:
65.9% (31)
Marital status - American Indian / Alaska Native population 15 years and over
Males 56.7% Never married29.7% Now married0.0% Separated1.2% Widowed12.5% DivorcedFemales 42.7% Never married48.0% Now married0.0% Separated0.0% Widowed9.3% DivorcedWomen who did not give birth in the past 12 months Now married:
22.6% (44)Unmarried:
77.4% (150)
Marital status - Asian population 15 years and over
Males 67.6% Never married31.3% Now married0.0% Separated0.0% Widowed1.1% DivorcedFemales 16.6% Never married77.9% Now married0.0% Separated2.7% Widowed2.7% DivorcedWomen who did not give birth in the past 12 months Now married:
70.8% (257)Unmarried:
29.2% (106)
Marital status - Native Hawaiian / Pacific Islander population 15 years and over
Males 51.9% Never married46.2% Now married0.0% Separated0.0% Widowed1.9% DivorcedFemales 32.1% Never married28.3% Now married39.6% Separated0.0% Widowed0.0% DivorcedWomen who did not give birth in the past 12 months Now married:
60.5% (27)Unmarried:
39.5% (18)
Marital status - Other race population 15 years and over
Males 43.3% Never married56.0% Now married0.0% Separated0.0% Widowed0.6% DivorcedFemales 30.6% Never married56.4% Now married7.1% Separated0.1% Widowed5.9% DivorcedWomen who gave birth in the past 12 months Now married:
92.4% (86)Unmarried:
7.6% (7)
Women who did not give birth in the past 12 months Now married:
43.3% (229)Unmarried:
56.7% (300)
Marital status - Two or more races population 15 years and over
Males 44.2% Never married43.1% Now married2.1% Separated1.6% Widowed9.0% DivorcedFemales 39.2% Never married38.2% Now married5.5% Separated3.3% Widowed13.7% DivorcedWomen who gave birth in the past 12 months Now married:
100.0% (41)Unmarried:
0.0% (0)
Women who did not give birth in the past 12 months Now married:
38.4% (774)Unmarried:
61.6% (1,240)
Marital status - White alone, not Hispanic / Latino population 15 years and over
Males 38.0% Never married44.5% Now married1.5% Separated1.9% Widowed14.1% DivorcedFemales 25.8% Never married43.0% Now married2.4% Separated9.1% Widowed19.6% DivorcedWomen who gave birth in the past 12 months Now married:
56.7% (200)Unmarried:
43.3% (153)
Women who did not give birth in the past 12 months Now married:
40.4% (4,189)Unmarried:
59.6% (6,175)
Marital status - Hispanic or Latino population 15 years and over
Males 46.4% Never married47.4% Now married2.0% Separated0.0% Widowed4.2% DivorcedFemales 39.2% Never married42.8% Now married5.8% Separated3.0% Widowed9.1% DivorcedWomen who gave birth in the past 12 months Now married:
83.5% (184)Unmarried:
16.5% (36)
Women who did not give birth in the past 12 months Now married:
34.1% (646)Unmarried:
65.9% (1,247)
Ancestries in Springfield
2,222 10.1% English2,073 9.4% Irish1,984 9.0% German1,879 8.5% American1,012 4.6% European542 2.5% Italian469 2.1% Norwegian430 1.9% Scottish288 1.3% Dutch265 1.2% Swedish198 0.9% French Canadian174 0.8% Scandinavian166 0.8% French121 0.5% Scotch-Irish116 0.5% Danish95 0.4% Polish75 0.3% Australian68 0.3% Welsh63 0.3% Northern European62 0.3% Canadian60 0.3% British54 0.2% Eastern European53 0.2% Finnish51 0.2% Russian51 0.2% Swiss48 0.2% Egyptian39 0.2% Celtic36 0.2% Greek34 0.2% Czech34 0.2% Portuguese31 0.1% Ukrainian20 0.09% Nigerian19 0.09% Armenian19 0.09% Hungarian19 0.09% Albanian17 0.08% Croatian16 0.07% Czechoslovakian12 0.05% Icelander11 0.05% Austrian8 0.04% Basque8 0.04% Iranian5 0.02% Belgian5 0.02% Latvian4 0.02% New Zealander
Geographical mobility in Springfield Same house 1 year ago 41,156 86.2% White (Caucasian)400 68.0% Black or African American760 79.3% American Indian / Alaska Native996 90.0% Asian140 100.0% Native Hawaiian / Pacific Islander4,028 84.5% Other race6,345 86.2% Two or more races39,471 86.5% White alone, not Hispanic / Latino7,343 85.5% Hispanic or LatinoMoved within same county 4,449 9.3% White / Caucasian82 13.9% Black or African American58 6.1% American Indian / Alaska Native91 8.2% Asian561 11.8% Other race898 12.2% Two or more races4,178 9.2% White alone, not Hispanic / Latino939 10.9% Hispanic or LatinoMoved within same state 838 1.8% White / Caucasian61 6.3% American Indian / Alaska Native9 0.2% Other race40 0.5% Two or more races730 1.6% White alone, not Hispanic / Latino192 2.2% Hispanic or LatinoMoved from different state 1,253 2.6% White / Caucasian98 16.6% Black or African American70 7.3% American Indian / Alaska Native6 0.6% Asian103 2.2% Other race83 1.1% Two or more races1,212 2.7% White alone, not Hispanic / Latino117 1.4% Hispanic or LatinoMoved from abroad 71 0.1% White5 0.9% Black or African American31 2.8% Asian25 0.5% Other race66 0.1% White alone, not Hispanic / Latino43 0.5% Hispanic or Latino
Children Nativity (place of birth) in Springfield
Children under 6 years - Living with two parents Both parents native 1,929 100.0% NativeBoth parents foreign-born 131 100.0% NativeOne native, one foreign-born parent 162 100.0% NativeChildren under 6 years - Living with one parent Native parent 1,300 100.0% NativeForeign-born parent 69 100.0% NativeChildren 6 to 17 years - Living with two parents Both parents native 4,369 100.0% NativeBoth parents foreign-born 354 88.7% Native45 11.3% Foreign-bornOne native, one foreign-born parent 579 100.0% NativeChildren 6 to 17 years - Living with one parent Native parent 2,388 100.0% NativeForeign-born parent 265 57.9% Native192 42.1% Foreign-born
Grandparents responsible for own grandchildren in Springfield
Grandparents (30 to 59 years) White / Caucasian 113 43.0% Responsible for grandchildren150 57.0% Not responsible for grandchildrenAmerican Indian / Alaska Native 21 55.2% Responsible for grandchildren17 44.8% Not responsible for grandchildrenAsian 14 100.0% Responsible for grandchildrenOther race 12 33.9% Responsible for grandchildren24 66.1% Not responsible for grandchildrenTwo or more races 79 100.0% Responsible for grandchildrenWhite alone, not Hispanic / Latino 117 47.0% Responsible for grandchildren132 53.0% Not responsible for grandchildrenHispanic or Latino 47 37.2% Responsible for grandchildren80 62.8% Not responsible for grandchildrenGrandparents (60 years and over) White / Caucasian 240 59.8% Responsible for grandchildren161 40.2% Not responsible for grandchildrenAsian 21 100.0% Not responsible for grandchildrenOther race 17 100.0% Not responsible for grandchildrenTwo or more races 35 62.5% Responsible for grandchildren21 37.5% Not responsible for grandchildrenWhite alone, not Hispanic / Latino 267 62.4% Responsible for grandchildren161 37.6% Not responsible for grandchildrenHispanic or Latino 7 32.4% Responsible for grandchildren15 67.6% Not responsible for grandchildren