Races in Springfield, Massachusetts (MA) Detailed Stats
Data:
Races - White alone (%)
Races - White alone (% change since 2000)
Races - Black alone (%)
Races - Black alone (% change since 2000)
Races - American Indian alone (%)
Races - American Indian alone (% change since 2000)
Races - Asian alone (%)
Races - Asian alone (% change since 2000)
Races - Hispanic (%)
Races - Hispanic (% change since 2000)
Races - Native Hawaiian and Other Pacific Islander alone (%)
Races - Native Hawaiian and Other Pacific Islander alone (% change since 2000)
Races - Two or more races(%)
Races - Two or more races(% change since 2000)
Races - Other race alone (%)
Races - Other race alone (% change since 2000)
Racial diversity
Place of birth - Born in state of residence (%)
Place of birth - Born in state of residence (%) - White
Place of birth - Born in state of residence (%) - Black or African American
Place of birth - Born in state of residence (%) - Asian
Place of birth - Born in state of residence (%) - Hispanic or Latino
Place of birth - Born in state of residence (%) - American Indian and Alaska Native
Place of birth - Born in state of residence (%) - Multirace
Place of birth - Born in state of residence (%) - Other Race
Place of birth - Born in other state (%)
Place of birth - Born in other state (%) - White
Place of birth - Born in other state (%) - Black or African American
Place of birth - Born in other state (%) - Asian
Place of birth - Born in other state (%) - Hispanic or Latino
Place of birth - Born in other state (%) - American Indian and Alaska Native
Place of birth - Born in other state (%) - Multirace
Place of birth - Born in other state (%) - Other Race
Place of birth - Native, outside of US (%)
Place of birth - Native, outside of US (%) - White
Place of birth - Native, outside of US (%) - Black or African American
Place of birth - Native, outside of US (%) - Asian
Place of birth - Native, outside of US (%) - Hispanic or Latino
Place of birth - Native, outside of US (%) - American Indian and Alaska Native
Place of birth - Native, outside of US (%) - Multirace
Place of birth - Native, outside of US (%) - Other Race
Place of birth - Foreign born (%)
Place of birth - Foreign born (%) - White
Place of birth - Foreign born (%) - Black or African American
Place of birth - Foreign born (%) - Asian
Place of birth - Foreign born (%) - Hispanic or Latino
Place of birth - Foreign born (%) - American Indian and Alaska Native
Place of birth - Foreign born (%) - Multirace
Place of birth - Foreign born (%) - Other Race
Residents speaking English at home (%)
Residents speaking English at home - Born in the United States (%)
Residents speaking English at home - Native, born elsewhere (%)
Residents speaking English at home - Foreign born (%)
Residents speaking Spanish at home (%)
Residents speaking Spanish at home - Born in the United States (%)
Residents speaking Spanish at home - Native, born elsewhere (%)
Residents speaking Spanish at home - Foreign born (%)
Residents speaking other language at home (%)
Residents speaking other language at home - Born in the United States (%)
Residents speaking other language at home - Native, born elsewhere (%)
Residents speaking other language at home - Foreign born (%)
Marital status - Never married (%)
Marital status - Now married (%)
Marital status - Separated (%)
Marital status - Widowed (%)
Marital status - Divorced (%)
Ancestries Reported - Arab (%)
Ancestries Reported - Czech (%)
Ancestries Reported - Danish (%)
Ancestries Reported - Dutch (%)
Ancestries Reported - English (%)
Ancestries Reported - French (%)
Ancestries Reported - French Canadian (%)
Ancestries Reported - German (%)
Ancestries Reported - Greek (%)
Ancestries Reported - Hungarian (%)
Ancestries Reported - Irish (%)
Ancestries Reported - Italian (%)
Ancestries Reported - Lithuanian (%)
Ancestries Reported - Norwegian (%)
Ancestries Reported - Polish (%)
Ancestries Reported - Portuguese (%)
Ancestries Reported - Russian (%)
Ancestries Reported - Scotch-Irish (%)
Ancestries Reported - Scottish (%)
Ancestries Reported - Slovak (%)
Ancestries Reported - Subsaharan African (%)
Ancestries Reported - Swedish (%)
Ancestries Reported - Swiss (%)
Ancestries Reported - Ukrainian (%)
Ancestries Reported - United States (%)
Ancestries Reported - Welsh (%)
Ancestries Reported - West Indian (%)
Ancestries Reported - Other (%)
Geographical mobility - Same house 1 year ago (%)
Geographical mobility - Same house 1 year ago (%) - White
Geographical mobility - Same house 1 year ago (%) - Black or African American
Geographical mobility - Same house 1 year ago (%) - Asian
Geographical mobility - Same house 1 year ago (%) - Hispanic or Latino
Geographical mobility - Same house 1 year ago (%) - American Indian and Alaska Native
Geographical mobility - Same house 1 year ago (%) - Multirace
Geographical mobility - Same house 1 year ago (%) - Other Race
Geographical mobility - Moved within same county (%)
Geographical mobility - Moved within same county (%) - White
Geographical mobility - Moved within same county (%) - Black or African American
Geographical mobility - Moved within same county (%) - Asian
Geographical mobility - Moved within same county (%) - Hispanic or Latino
Geographical mobility - Moved within same county (%) - American Indian and Alaska Native
Geographical mobility - Moved within same county (%) - Multirace
Geographical mobility - Moved within same county (%) - Other Race
Geographical mobility - Moved from different county within same state (%)
Geographical mobility - Moved from different county within same state (%) - White
Geographical mobility - Moved from different county within same state (%) - Black or African American
Geographical mobility - Moved from different county within same state (%) - Asian
Geographical mobility - Moved from different county within same state (%) - Hispanic or Latino
Geographical mobility - Moved from different county within same state (%) - American Indian and Alaska Native
Geographical mobility - Moved from different county within same state (%) - Multirace
Geographical mobility - Moved from different county within same state (%) - Other Race
Geographical mobility - Moved from different state (%)
Geographical mobility - Moved from different state (%) - White
Geographical mobility - Moved from different state (%) - Black or African American
Geographical mobility - Moved from different state (%) - Asian
Geographical mobility - Moved from different state (%) - Hispanic or Latino
Geographical mobility - Moved from different state (%) - American Indian and Alaska Native
Geographical mobility - Moved from different state (%) - Multirace
Geographical mobility - Moved from different state (%) - Other Race
Geographical mobility - Moved from abroad (%)
Geographical mobility - Moved from abroad (%) - White
Geographical mobility - Moved from abroad (%) - Black or African American
Geographical mobility - Moved from abroad (%) - Asian
Geographical mobility - Moved from abroad (%) - Hispanic or Latino
Geographical mobility - Moved from abroad (%) - American Indian and Alaska Native
Geographical mobility - Moved from abroad (%) - Multirace
Geographical mobility - Moved from abroad (%) - Other Race
Place of birth for the foreign-born population - Ireland (%)
Place of birth for the foreign-born population - Denmark (%)
Place of birth for the foreign-born population - Norway (%)
Place of birth for the foreign-born population - Sweden (%)
Place of birth for the foreign-born population - United Kingdom (%)
Place of birth for the foreign-born population - England (%)
Place of birth for the foreign-born population - Scotland (%)
Place of birth for the foreign-born population - Other Northern Europe (%)
Place of birth for the foreign-born population - Austria (%)
Place of birth for the foreign-born population - Belgium (%)
Place of birth for the foreign-born population - France (%)
Place of birth for the foreign-born population - Germany (%)
Place of birth for the foreign-born population - Netherlands (%)
Place of birth for the foreign-born population - Switzerland (%)
Place of birth for the foreign-born population - Other Western Europe (%)
Place of birth for the foreign-born population - Greece (%)
Place of birth for the foreign-born population - Italy (%)
Place of birth for the foreign-born population - Portugal (%)
Place of birth for the foreign-born population - Spain (%)
Place of birth for the foreign-born population - Other Southern Europe (%)
Place of birth for the foreign-born population - Albania (%)
Place of birth for the foreign-born population - Belarus (%)
Place of birth for the foreign-born population - Bosnia and Herzegovina (%)
Place of birth for the foreign-born population - Bulgaria (%)
Place of birth for the foreign-born population - Croatia (%)
Place of birth for the foreign-born population - Czechoslovakia (%)
Place of birth for the foreign-born population - Hungary (%)
Place of birth for the foreign-born population - Latvia (%)
Place of birth for the foreign-born population - Lithuania (%)
Place of birth for the foreign-born population - North Macedonia (Macedonia) (%)
Place of birth for the foreign-born population - Moldova (%)
Place of birth for the foreign-born population - Poland (%)
Place of birth for the foreign-born population - Romania (%)
Place of birth for the foreign-born population - Russia (%)
Place of birth for the foreign-born population - Serbia (%)
Place of birth for the foreign-born population - Ukraine (%)
Place of birth for the foreign-born population - Other Eastern Europe (%)
Place of birth for the foreign-born population - China (%)
Place of birth for the foreign-born population - Hong Kong (%)
Place of birth for the foreign-born population - Taiwan (%)
Place of birth for the foreign-born population - Japan (%)
Place of birth for the foreign-born population - Korea (%)
Place of birth for the foreign-born population - Other Eastern Asia (%)
Place of birth for the foreign-born population - Afghanistan (%)
Place of birth for the foreign-born population - Bangladesh (%)
Place of birth for the foreign-born population - India (%)
Place of birth for the foreign-born population - Iran (%)
Place of birth for the foreign-born population - Kazakhstan (%)
Place of birth for the foreign-born population - Nepal (%)
Place of birth for the foreign-born population - Pakistan (%)
Place of birth for the foreign-born population - Sri Lanka (%)
Place of birth for the foreign-born population - Uzbekistan (%)
Place of birth for the foreign-born population - Other South Central Asia (%)
Place of birth for the foreign-born population - Burma (%)
Place of birth for the foreign-born population - Cambodia (%)
Place of birth for the foreign-born population - Indonesia (%)
Place of birth for the foreign-born population - Laos (%)
Place of birth for the foreign-born population - Malaysia (%)
Place of birth for the foreign-born population - Philippines (%)
Place of birth for the foreign-born population - Singapore (%)
Place of birth for the foreign-born population - Thailand (%)
Place of birth for the foreign-born population - Vietnam (%)
Place of birth for the foreign-born population - Other South Eastern Asia (%)
Place of birth for the foreign-born population - Armenia (%)
Place of birth for the foreign-born population - Iraq (%)
Place of birth for the foreign-born population - Israel (%)
Place of birth for the foreign-born population - Jordan (%)
Place of birth for the foreign-born population - Kuwait (%)
Place of birth for the foreign-born population - Lebanon (%)
Place of birth for the foreign-born population - Saudi Arabia (%)
Place of birth for the foreign-born population - Syria (%)
Place of birth for the foreign-born population - Turkey (%)
Place of birth for the foreign-born population - Yemen (%)
Place of birth for the foreign-born population - Other Western Asia (%)
Place of birth for the foreign-born population - Eritrea (%)
Place of birth for the foreign-born population - Ethiopia (%)
Place of birth for the foreign-born population - Kenya (%)
Place of birth for the foreign-born population - Somalia (%)
Place of birth for the foreign-born population - Uganda (%)
Place of birth for the foreign-born population - Zimbabwe (%)
Place of birth for the foreign-born population - Other Eastern Africa (%)
Place of birth for the foreign-born population - Cameroon (%)
Place of birth for the foreign-born population - Congo (%)
Place of birth for the foreign-born population - Democratic Republic of Congo (Zaire) (%)
Place of birth for the foreign-born population - Other Middle Africa (%)
Place of birth for the foreign-born population - Egypt (%)
Place of birth for the foreign-born population - Morocco (%)
Place of birth for the foreign-born population - Sudan (%)
Place of birth for the foreign-born population - Other Northern Africa (%)
Place of birth for the foreign-born population - South Africa (%)
Place of birth for the foreign-born population - Other Southern Africa (%)
Place of birth for the foreign-born population - Cabo Verde (%)
Place of birth for the foreign-born population - Ghana (%)
Place of birth for the foreign-born population - Liberia (%)
Place of birth for the foreign-born population - Nigeria (%)
Place of birth for the foreign-born population - Senegal (%)
Place of birth for the foreign-born population - Sierra Leone (%)
Place of birth for the foreign-born population - Other Western Africa (%)
Place of birth for the foreign-born population - Australia (%)
Place of birth for the foreign-born population - New Zealand (%)
Place of birth for the foreign-born population - Fiji (%)
Place of birth for the foreign-born population - Micronesia (%)
Place of birth for the foreign-born population - Bahamas (%)
Place of birth for the foreign-born population - Barbados (%)
Place of birth for the foreign-born population - Cuba (%)
Place of birth for the foreign-born population - Dominica (%)
Place of birth for the foreign-born population - Dominican Republic (%)
Place of birth for the foreign-born population - Grenada (%)
Place of birth for the foreign-born population - Haiti (%)
Place of birth for the foreign-born population - Jamaica (%)
Place of birth for the foreign-born population - St. Vincent and the Grenadines (%)
Place of birth for the foreign-born population - Trinidad and Tobago (%)
Place of birth for the foreign-born population - West Indies (%)
Place of birth for the foreign-born population - Other Caribbean (%)
Place of birth for the foreign-born population - Belize (%)
Place of birth for the foreign-born population - Costa Rica (%)
Place of birth for the foreign-born population - El Salvador (%)
Place of birth for the foreign-born population - Guatemala (%)
Place of birth for the foreign-born population - Honduras (%)
Place of birth for the foreign-born population - Mexico (%)
Place of birth for the foreign-born population - Nicaragua (%)
Place of birth for the foreign-born population - Panama (%)
Place of birth for the foreign-born population - Other Central America (%)
Place of birth for the foreign-born population - Argentina (%)
Place of birth for the foreign-born population - Bolivia (%)
Place of birth for the foreign-born population - Brazil (%)
Place of birth for the foreign-born population - Chile (%)
Place of birth for the foreign-born population - Colombia (%)
Place of birth for the foreign-born population - Ecuador (%)
Place of birth for the foreign-born population - Guyana (%)
Place of birth for the foreign-born population - Peru (%)
Place of birth for the foreign-born population - Uruguay (%)
Place of birth for the foreign-born population - Venezuela (%)
Place of birth for the foreign-born population - Other South America (%)
Place of birth for the foreign-born population - Canada (%)
Place of birth for the foreign-born population - Other Northern America (%)
Place of birth for the foreign-born population - Other (%)
Latest news about races in Springfield, MA collected exclusively by city-data.com from local newspapers, TV, and radio stations
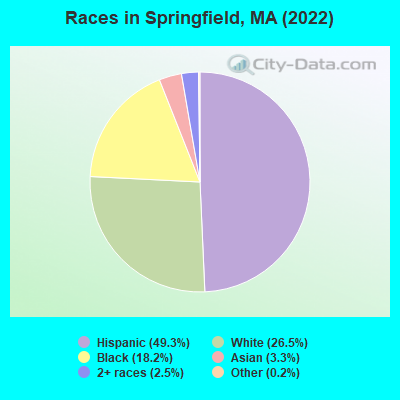
According to 2022 data, the most numerous races in Springfield, MA are White alone (40,831 residents), Hispanic (75,988 residents), and Asian alone (5,111 residents). 60.9% of Springfield residents speak English at home. 10.6% of Springfield, MA residents are foreign-born (6.0% born in Latin America, 2.2% born in Asia, 1.1% born in Africa), which is 69.7% less than the foreign-born rate of 18.0% across the entire state of Massachusetts.
Race distribution in Springfield
2000 2022
74,291 48.8% White alone 41,343 27.2% Hispanic 29,831 19.6% Black alone 3,146 2.1% Two or more races 2,857 1.9% Asian alone 236 0.2% Other race alone 336 0.2% American Indian alone 42 0.03% Native Hawaiian and Other
75,988 49.3% Hispanic 40,831 26.5% White alone 27,992 18.2% Black alone 5,111 3.3% Asian alone 3,829 2.5% Two or more races 297 0.2% Other race alone 10 0.01% American Indian alone
2000 2022
5,198,359 81.9% White alone 428,729 6.8% Hispanic 318,329 5.0% Black alone 236,786 3.7% Asian alone 110,338 1.7% Two or more races 43,586 0.7% Other race alone 11,264 0.2% American Indian alone 1,706 0.03% Native Hawaiian and Other
4,676,627 67.0% White alone 911,038 13.0% Hispanic 501,463 7.2% Asian alone 459,740 6.6% Black alone 341,889 4.9% Two or more races 84,403 1.2% Other race alone 5,838 0.08% American Indian alone 976 0.01% Native Hawaiian and Other
Income and house value in Springfield Median household income in 2022 $53,895 White non-Hispanic householders$44,173 Black householders$54,309 Asian householders$54,574 Some other race householders$33,876 Two or more races householders$38,556 Hispanic or Latino race householdersMedian 2022 house value $231,941 White Non-Hispanic householders$218,313 Black or African American householders$205,209 American Indian or Alaska Native householders $202,850 Asian householders$248,976 Native Hawaiian and other Pacific Islander householders$216,216 Some other race householders$245,831 Two or more races householders$216,740 Hispanic or Latino householders
Median age by race in Springfield
45.8 Median age for White residents41.2 50.2 30.6 Median age for Black or African American residents28.6 32.2 17.9 Median age for American Indian / Alaska Native residents41.2 -666,666,666.0 36.1 Median age for Asian residents28.6 36.8 -666,666,666.0 Median age for Native Hawaiian / Pacific Islander residents-666,666,666.0 -666,666,666.0 32.3 Median age for Other race residents30.0 35.1 28.1 Median age for Two or more races residents26.1 30.9 50.4 Median age for White alone residents45.8 52.4 28.6 Median age for Hispanic or Latino residents26.1 32.2
Owner/renter occupied households by race in Springfield
House owners and renters - White residents 13,935 62.8% Owner occupied8,255 37.2% Renter occupiedHouse owners and renters - Black or African American residents 4,748 42.8% Owner occupied6,353 57.2% Renter occupiedHouse owners and renters - American Indian / Alaska Native residents 142 67.2% Owner occupied69 32.8% Renter occupiedHouse owners and renters - Asian residents 1,393 57.9% Owner occupied1,012 42.1% Renter occupiedHouse owners and renters - Other race residents 2,811 37.6% Owner occupied4,667 62.4% Renter occupiedHouse owners and renters - Two or more races residents 5,189 30.5% Owner occupied11,809 69.5% Renter occupiedHouse owners and renters - White alone residents 12,465 63.3% Owner occupied7,236 36.7% Renter occupiedHouse owners and renters - Hispanic or Latino residents 8,516 32.6% Owner occupied17,598 67.4% Renter occupied
Language usage in Springfield
English speakers - Total 60.9% of residents of Springfield speak English at home.
33.3% of residents speak Spanish at home 27,123 56.3% Speak English very well21,043 43.7% Speak English less than very well5.7% of residents speak other language at home 4,116 49.7% Speak English very well4,163 50.3% Speak English less than very well
English speakers - Born in the United States 79.1% of residents of Springfield speak English at home.
20.3% of residents speak Spanish at home 4,407 76.7% Speak English very well1,341 23.3% Speak English less than very well0.6% of residents speak other language at home 134 79.3% Speak English very well35 20.7% Speak English less than very well
English speakers - Native, born elsewhere 16.5% of residents of Springfield speak English at home.
82.3% of residents speak Spanish at home 8,134 37.2% Speak English very well13,752 62.8% Speak English less than very well1.2% of residents speak other language at home 316 100.0% Speak English very well
English speakers - Foreign-born 26.6% of residents of Springfield speak English at home.
35.0% of residents speak Spanish at home 1,343 21.0% Speak English very well5,057 79.0% Speak English less than very well38.4% of residents speak other language at home 2,940 41.8% Speak English very well4,089 58.2% Speak English less than very well
White (Caucasian) - Speak only English Native:
90.1% (38,086)Foreign-born:
21.4% (702)
White (Caucasian) - Speak another language Native:
9.9% (4,164)Foreign-born:
78.6% (2,586)
Black or African American - Speak only English Native:
95.2% (24,415)Foreign-born:
64.3% (2,446)
Black or African American - Speak another language Native:
4.8% (1,244)Foreign-born:
35.7% (1,358)
American Indian / Alaska Native - Speak only English Native:
41.2% (302)Foreign-born:
53.7% (2)
Asian - Speak only English Native:
64.1% (602)Foreign-born:
15.2% (634)
Asian - Speak another language Native:
35.9% (337)Foreign-born:
84.8% (3,538)
Other race - Speak only English Native:
30.0% (5,813)Foreign-born:
13.1% (350)
Other race - Speak another language Native:
70.0% (13,543)Foreign-born:
86.9% (2,328)
Two or more races - Speak only English Native:
38.4% (14,311)Foreign-born:
16.7% (727)
Two or more races - Speak another language Native:
61.6% (23,001)Foreign-born:
83.3% (3,619)
White alone - Speak only English Native:
97.9% (36,537)Foreign-born:
22.6% (702)
White alone - Speak another language Native:
2.1% (768)Foreign-born:
77.4% (2,406)
Hispanic or Latino - Speak only English Native:
33.5% (20,767)Foreign-born:
13.8% (1,013)
Hispanic or Latino - Speak another language Native:
66.5% (41,275)Foreign-born:
86.2% (6,322)
Foreign-born residents in Springfield 16,345 residents are foreign born (6.0% Latin America , 2.2% Asia , 1.1% Africa ).
This city:
10.6%Massachusetts:
17.6%
Marital status for residents in Springfield Marital status - White (Caucasian) population 15 years and over
Males 51.2% Never married35.3% Now married0.3% Separated4.2% Widowed9.0% DivorcedFemales 41.9% Never married34.5% Now married3.1% Separated12.2% Widowed8.3% DivorcedWomen who gave birth in the past 12 months Now married:
100.0% (128)Unmarried:
0.0% (0)
Women who did not give birth in the past 12 months Now married:
31.6% (3,533)Unmarried:
68.4% (7,660)
Marital status - Black or African American population 15 years and over
Males 53.4% Never married35.2% Now married2.2% Separated3.1% Widowed6.2% DivorcedFemales 54.2% Never married27.5% Now married5.9% Separated2.9% Widowed9.4% DivorcedWomen who gave birth in the past 12 months Now married:
48.1% (226)Unmarried:
51.9% (244)
Women who did not give birth in the past 12 months Now married:
24.2% (1,898)Unmarried:
75.8% (5,948)
Marital status - American Indian / Alaska Native population 15 years and over
Males 50.8% Never married25.7% Now married20.1% Separated1.2% Widowed2.2% DivorcedFemales 33.5% Never married59.7% Now married0.0% Separated6.8% Widowed0.0% DivorcedWomen who did not give birth in the past 12 months Now married:
55.1% (88)Unmarried:
44.9% (72)
Marital status - Asian population 15 years and over
Males 52.4% Never married34.6% Now married0.0% Separated0.3% Widowed12.7% DivorcedFemales 38.8% Never married34.1% Now married0.0% Separated13.3% Widowed13.8% DivorcedWomen who gave birth in the past 12 months Now married:
100.0% (23)Unmarried:
0.0% (0)
Women who did not give birth in the past 12 months Now married:
49.7% (658)Unmarried:
50.3% (665)
Marital status - Other race population 15 years and over
Males 65.3% Never married28.3% Now married1.3% Separated0.0% Widowed5.1% DivorcedFemales 62.8% Never married23.2% Now married2.7% Separated1.7% Widowed9.5% DivorcedWomen who gave birth in the past 12 months Now married:
81.0% (154)Unmarried:
19.0% (36)
Women who did not give birth in the past 12 months Now married:
27.5% (1,832)Unmarried:
72.5% (4,830)
Marital status - Two or more races population 15 years and over
Males 55.0% Never married32.6% Now married4.1% Separated2.4% Widowed5.9% DivorcedFemales 57.0% Never married27.6% Now married3.1% Separated4.7% Widowed7.5% DivorcedWomen who gave birth in the past 12 months Now married:
20.0% (219)Unmarried:
80.0% (877)
Women who did not give birth in the past 12 months Now married:
25.0% (2,958)Unmarried:
75.0% (8,872)
Marital status - White alone, not Hispanic / Latino population 15 years and over
Males 51.6% Never married34.5% Now married0.4% Separated4.4% Widowed9.2% DivorcedFemales 40.7% Never married35.9% Now married2.6% Separated13.3% Widowed7.5% DivorcedWomen who gave birth in the past 12 months Now married:
100.0% (128)Unmarried:
0.0% (0)
Women who did not give birth in the past 12 months Now married:
33.1% (3,100)Unmarried:
66.9% (6,275)
Marital status - Hispanic or Latino population 15 years and over
Males 58.8% Never married31.2% Now married3.5% Separated1.2% Widowed5.3% DivorcedFemales 58.7% Never married24.3% Now married3.7% Separated3.9% Widowed9.3% DivorcedWomen who gave birth in the past 12 months Now married:
18.7% (219)Unmarried:
81.3% (953)
Women who did not give birth in the past 12 months Now married:
23.6% (4,677)Unmarried:
76.4% (15,135)
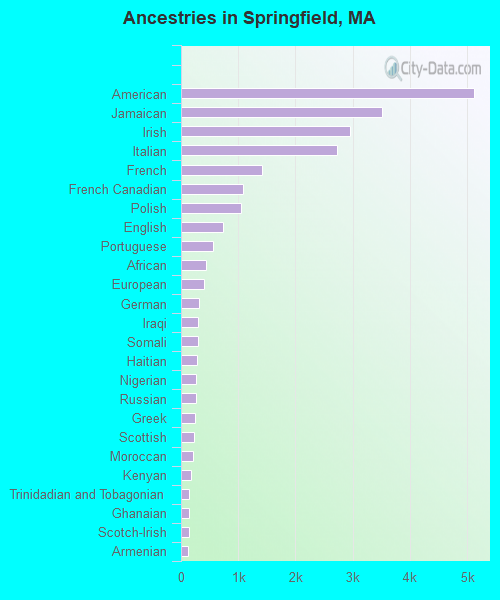
Ancestries in Springfield
5,128 5.2% American3,507 3.6% Jamaican2,950 3.0% Irish2,732 2.8% Italian1,408 1.4% French1,077 1.1% French Canadian1,054 1.1% Polish727 0.7% English564 0.6% Portuguese429 0.4% African395 0.4% European314 0.3% German290 0.3% Iraqi290 0.3% Somali273 0.3% Haitian261 0.3% Nigerian255 0.3% Russian248 0.3% Greek235 0.2% Scottish202 0.2% Moroccan183 0.2% Kenyan142 0.1% Trinidadian and Tobagonian140 0.1% Ghanaian136 0.1% Scotch-Irish115 0.1% Armenian101 0.1% Guyanese96 0.10% Canadian93 0.10% Lebanese90 0.09% Ukrainian84 0.09% British West Indian79 0.08% Cape Verdean69 0.07% Eastern European54 0.06% U.S. Virgin Islander44 0.05% Brazilian44 0.05% Swedish44 0.05% Barbadian37 0.04% Basque36 0.04% Dutch35 0.04% Egyptian32 0.03% Northern European29 0.03% Jordanian29 0.03% Lithuanian28 0.03% Iranian28 0.03% Sudanese27 0.03% Finnish26 0.03% Arab25 0.03% Belizean25 0.03% Ethiopian25 0.03% West Indian20 0.02% Sierra Leonean20 0.02% Turkish19 0.02% British13 0.01% Danish11 0.01% Bulgarian10 0.01% Belgian9 0.01% Romanian9 0.01% Welsh7 0.01% Czechoslovakian6 0.01% Celtic6 0.01% Liberian5 0.01% Australian5 0.01% Pennsylvania German
Geographical mobility in Springfield Same house 1 year ago 41,832 90.0% White (Caucasian)28,987 92.8% Black or African American877 100.0% American Indian / Alaska Native3,673 80.1% Asian20,109 88.8% Other race37,573 90.7% Two or more races36,936 90.5% White alone, not Hispanic / Latino67,117 90.0% Hispanic or LatinoMoved within same county 1,847 4.0% White / Caucasian1,184 3.8% Black or African American588 12.8% Asian1,796 7.9% Other race3,048 7.4% Two or more races1,408 3.4% White alone, not Hispanic / Latino5,495 7.4% Hispanic or LatinoMoved within same state 2,002 4.3% White / Caucasian338 1.1% Black or African American4 0.1% Asian251 0.6% Two or more races1,983 4.9% White alone, not Hispanic / Latino360 0.5% Hispanic or LatinoMoved from different state 654 1.4% White / Caucasian333 1.1% Black or African American208 4.5% Asian69 0.2% Two or more races342 0.8% White alone, not Hispanic / Latino376 0.5% Hispanic or LatinoMoved from abroad 162 0.3% White399 1.3% Black or African American24 2.7% American Indian / Alaska Native57 1.2% Asian753 3.3% Other race508 1.2% Two or more races162 0.4% White alone, not Hispanic / Latino1,234 1.7% Hispanic or Latino
Children Nativity (place of birth) in Springfield
Children under 6 years - Living with two parents Both parents native 2,085 100.0% NativeBoth parents foreign-born 885 89.7% Native102 10.3% Foreign-bornOne native, one foreign-born parent 1,404 100.0% NativeChildren under 6 years - Living with one parent Native parent 6,241 100.0% NativeForeign-born parent 478 97.0% Native15 3.0% Foreign-bornChildren 6 to 17 years - Living with two parents Both parents native 5,678 100.0% NativeBoth parents foreign-born 1,072 68.8% Native485 31.2% Foreign-bornOne native, one foreign-born parent 1,192 97.2% Native35 2.8% Foreign-bornChildren 6 to 17 years - Living with one parent Native parent 12,019 100.0% NativeForeign-born parent 2,648 53.9% Native2,268 46.1% Foreign-born
Place of birth for residents in Springfield 9,667 Americas9,525 Latin America6,049 Caribbean3,551 Asia2,237 Central America1,827 Africa1,503 South Eastern Asia1,292 Europe1,237 South America1,217 South Central Asia863 Eastern Africa539 Western Africa477 Eastern Europe471 Southern Europe442 Western Asia387 Eastern Asia344 China205 Northern Europe194 Northern Africa142 Northern America138 Western Europe37 Middle Africa6 Oceania6 Australia and New Zealand Subregion2,838 Jamaica2,504 Dominican Republic989 Guatemala976 Vietnam535 Mexico424 El Salvador411 Nepal369 Colombia324 China311 Peru242 Ghana242 Bhutan239 India230 Pakistan219 Ecuador218 Somalia198 Italy195 Nigeria192 Iraq182 Portugal171 Kenya171 Dominica168 Poland153 Laos152 Barbados150 Cambodia148 Trinidad and Tobago142 Canada132 Guyana126 Nicaragua115 Haiti110 Morocco109 Russia106 Ireland106 Thailand93 Honduras93 Philippines91 Greece91 Brazil81 Belarus75 Germany66 Lebanon65 West Indies59 Ukraine55 Azerbaijan42 Senegal38 Jordan37 Panama33 Sudan31 England31 Iran30 Costa Rica29 Ethiopia29 United Kingdom27 Syria26 Korea25 Netherlands25 Tanzania24 Grenada22 Kazakhstan22 Sweden21 Georgia20 Hong Kong19 Turkey19 Kuwait19 Bangladesh18 Austria16 Japan15 Burma (Myanmar)15 Moldova14 Scotland14 Sierra Leone14 Liberia14 Argentina14 Bolivia13 Cameroon13 Lithuania12 Belgium12 Venezuela11 Afghanistan10 Cuba8 Egypt7 Cabo Verde7 Azores Islands6 Indonesia6 Australia6 France6 Uruguay5 Congo5 Chile1 Romania
Grandparents responsible for own grandchildren in Springfield
Grandparents (30 to 59 years) White / Caucasian 394 57.3% Responsible for grandchildren294 42.7% Not responsible for grandchildrenBlack or African American 279 54.3% Responsible for grandchildren235 45.7% Not responsible for grandchildrenAsian 12 100.0% Not responsible for grandchildrenOther race 36 16.3% Responsible for grandchildren185 83.7% Not responsible for grandchildrenTwo or more races 582 65.6% Responsible for grandchildren305 34.4% Not responsible for grandchildrenWhite alone, not Hispanic / Latino 327 71.7% Responsible for grandchildren129 28.3% Not responsible for grandchildrenHispanic or Latino 889 52.2% Responsible for grandchildren815 47.8% Not responsible for grandchildrenGrandparents (60 years and over) White / Caucasian 163 50.3% Responsible for grandchildren161 49.7% Not responsible for grandchildrenBlack or African American 311 47.8% Responsible for grandchildren340 52.2% Not responsible for grandchildrenAsian 46 39.2% Responsible for grandchildren72 60.8% Not responsible for grandchildrenOther race 53 22.9% Responsible for grandchildren177 77.1% Not responsible for grandchildrenTwo or more races 151 38.0% Responsible for grandchildren247 62.0% Not responsible for grandchildrenWhite alone, not Hispanic / Latino 134 58.0% Responsible for grandchildren97 42.0% Not responsible for grandchildrenHispanic or Latino 303 44.7% Responsible for grandchildren375 55.3% Not responsible for grandchildren
Zip codes: 01103 , 01104 , 01105 , 01107 , 01108 , 01109 , 01118 , 01119 , 01128 , 01129 , 01151 , 01199.