Races in Springfield, Florida (FL) Detailed Stats
Ancestries, Foreign-born residents, place of birth
Settings
X


Recent posts about races in Springfield, Florida on our local forum with over 2,400,000 registered users:
 | North Springfield rent 2/2? (0 replies) |
| How will this affect the growth? (80 replies) |
| is springfield really on its way up? (19 replies) |
| Springfield Safety (56 replies) |
| Finally Moving To Jax!! (11 replies) |
| I'm thinking of moving to Springfield Jacksonville (20 replies) |
Latest news about races in Springfield, FL collected exclusively by city-data.com from local newspapers, TV, and radio stations
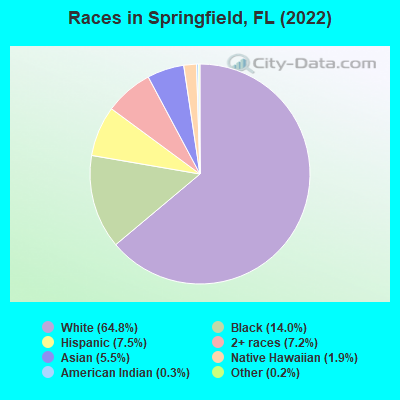
According to 2022 data, the most numerous races in Springfield, FL are White alone (5,493 residents), Hispanic (638 residents), and Black alone (1,185 residents). 90.0% of Springfield residents speak English at home. 4.9% of Springfield, FL residents are foreign-born (3.5% born in Asia, 0.9% born in Latin America), which is 329.2% less than the foreign-born rate of 21.0% across the entire state of Florida.
Race distribution in Springfield
2000
2022

- 5,83766.3%White alone
- 2,04923.3%Black alone
- 3744.2%Asian alone
- 2362.7%Two or more races
- 2252.6%Hispanic
- 670.8%American Indian alone
- 110.1%Other race alone
- 110.1%Native Hawaiian and Other
Pacific Islander alone

-
- 5,49364.8%White alone
- 1,18514.0%Black alone
- 6387.5%Hispanic
- 6117.2%Two or more races
- 4655.5%Asian alone
- 1621.9%Native Hawaiian and Other
Pacific Islander alone - 260.3%American Indian alone
- 160.2%Other race alone
2000
2022
-
- 10,458,50965.4%White alone
- 2,682,71516.8%Hispanic
- 2,264,26814.2%Black alone
- 261,6931.6%Asian alone
- 236,9541.5%Two or more races
- 42,3580.3%American Indian alone
- 28,9940.2%Other race alone
- 6,8870.04%Native Hawaiian and Other
Pacific Islander alone

-
- 11,309,40350.8%White alone
- 6,025,03927.1%Hispanic
- 3,241,01514.6%Black alone
- 861,6303.9%Two or more races
- 623,6922.8%Asian alone
- 152,0540.7%Other race alone
- 22,5040.1%American Indian alone
- 9,4860.04%Native Hawaiian and Other
Pacific Islander alone

Income and house value in Springfield
- Median household income in 2022
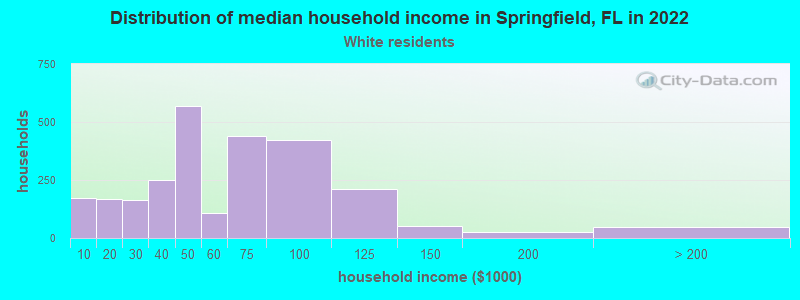
- $53,574White non-Hispanic householders
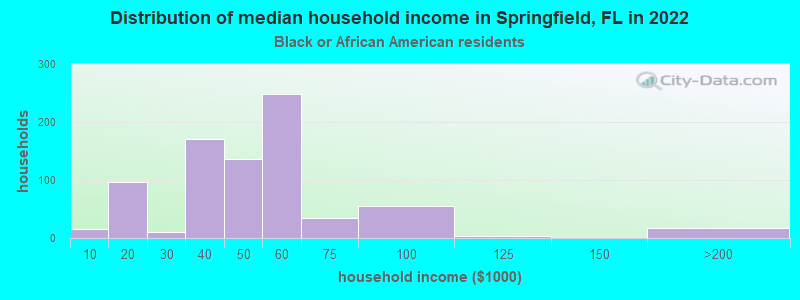
- $44,262Black householders
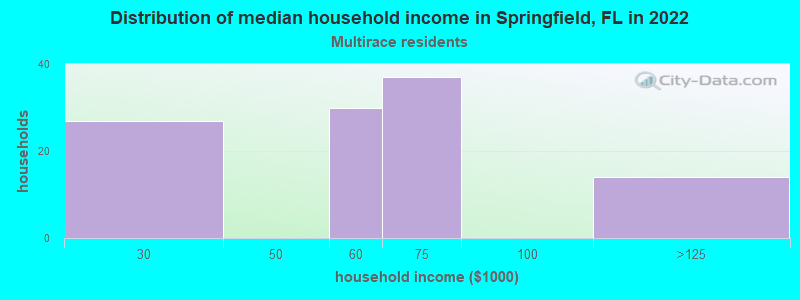
- $68,910Two or more races householders
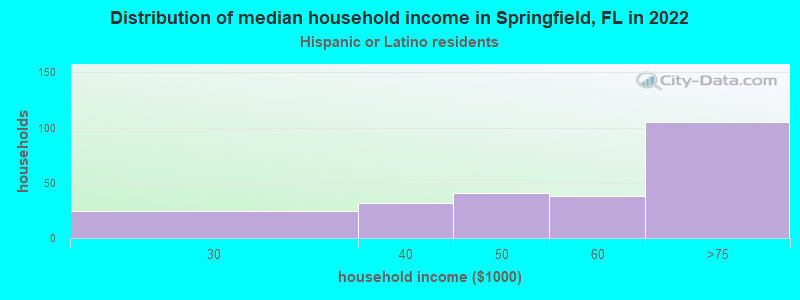
- $57,761Hispanic or Latino race householders
- Median 2022 house value
- $188,104White Non-Hispanic householders
- $184,926Black or African American householders
- $158,920American Indian or Alaska Native householders
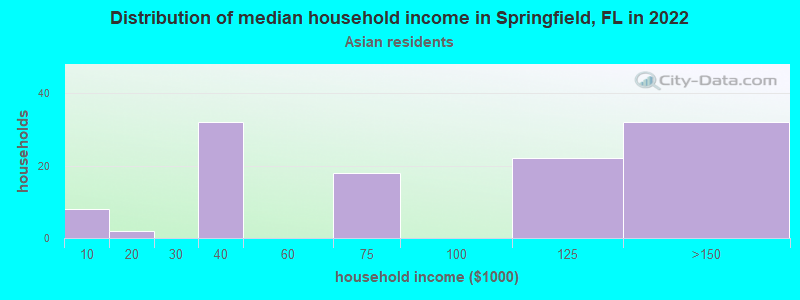
- $184,637Asian householders
- $187,815Some other race householders
- $206,019Two or more races householders
- $198,795Hispanic or Latino householders
Household income for White non-Hispanic householders
Household income for Black householders
Household income for Asian householders
Household income for Native Hawaiian and other Pacific Islander householders

Household income for Some other race householders
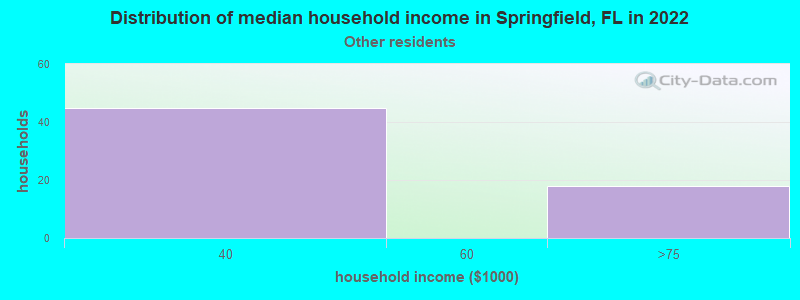
Household income for Two or more races householders
Household income for Hispanic or Latino race householders
Median age by race in Springfield
- 46.7Median age for White residents
- 43.2Males
- 48.4Females
- 38.5Median age for Black or African American residents
- 41.8Males
- 29.0Females
- 21.5Median age for American Indian / Alaska Native residents
- 38.1Males
- -594,925,633.7Females
- 60.5Median age for Asian residents
- 57.6Males
- 59.6Females
- 17.1Median age for Native Hawaiian / Pacific Islander residents
- 25.5Males
- 10.6Females
- 45.1Median age for Other race residents
- 61.5Males
- -558,558,558.0Females
- 24.9Median age for Two or more races residents
- 11.4Males
- 29.3Females
- 48.2Median age for White alone residents
- 45.0Males
- 47.9Females
- 27.7Median age for Hispanic or Latino residents
- 41.8Males
- 24.6Females
Owner/renter occupied households by race in Springfield
- House owners and renters - White residents
- 1,68664.9%Owner occupied
- 91335.1%Renter occupied
- House owners and renters - Black or African American residents
- 46069.4%Owner occupied
- 20330.6%Renter occupied
- House owners and renters - American Indian / Alaska Native residents
- 10100.0%Owner occupied
- House owners and renters - Asian residents
- 100100.0%Owner occupied
- House owners and renters - Native Hawaiian / Pacific Islander residents
- 627.0%Owner occupied
- 1673.0%Renter occupied
- House owners and renters - Other race residents
- 4673.2%Owner occupied
- 1726.8%Renter occupied
- House owners and renters - Two or more races residents
- 4638.5%Owner occupied
- 7461.5%Renter occupied
- House owners and renters - White alone residents
- 1,69068.0%Owner occupied
- 79532.0%Renter occupied
- House owners and renters - Hispanic or Latino residents
- 4817.9%Owner occupied
- 22182.1%Renter occupied
Language usage in Springfield
- English speakers - Total
- 90.0% of residents of Springfield speak English at home.
- 3.7% of residents speak Spanish at home
- 21873.6%Speak English very well
- 7826.4%Speak English less than very well
- 4.7% of residents speak other language at home
- 19250.7%Speak English very well
- 18749.3%Speak English less than very well
- English speakers - Born in the United States
- 94.7% of residents of Springfield speak English at home.
- 2.7% of residents speak Spanish at home
- 106100.0%Speak English very well
- 2.6% of residents speak other language at home
- 7271.3%Speak English very well
- 2928.7%Speak English less than very well
- English speakers - Native, born elsewhere
- 51.2% of residents of Springfield speak English at home.
- 44.7% of residents speak Spanish at home
- 8549.4%Speak English very well
- 8750.6%Speak English less than very well
- 1.3% of residents speak other language at home
- 5100.0%Speak English very well
- English speakers - Foreign-born
- 20.1% of residents of Springfield speak English at home.
- 9.9% of residents speak Spanish at home
- 1336.1%Speak English very well
- 2363.9%Speak English less than very well
- 48.9% of residents speak other language at home
- 6134.3%Speak English very well
- 11765.7%Speak English less than very well
White (Caucasian) - Speak only English
| Native: | 95.0% (5,216) |
| Foreign-born: | 20.8% (7) |
White (Caucasian) - Speak another language
| Native: | 4.3% (234) |
| Foreign-born: | 77.9% (27) |
Black or African American - Speak only English
| Native: | 96.6% (1,030) |
| Foreign-born: | 97.0% (60) |
Asian - Speak only English
| Native: | 42.8% (95) |
| Foreign-born: | 9.3% (23) |
Asian - Speak another language
| Native: | 39.9% (88) |
| Foreign-born: | 87.5% (219) |
Other race - Speak another language
| Native: | 35.6% (15) |
| Foreign-born: | 98.4% (6) |
Two or more races - Speak another language
| Native: | 6.7% (50) |
| Foreign-born: | 97.0% (20) |
White alone - Speak only English
| Native: | 97.7% (5,096) |
| Foreign-born: | 35.2% (8) |
White alone - Speak another language
| Native: | 2.2% (116) |
| Foreign-born: | 64.4% (15) |
Hispanic or Latino - Speak another language
| Native: | 52.8% (305) |
| Foreign-born: | 100.0% (37) |
Foreign-born residents in Springfield
415 residents are foreign born (3.5% Asia, 0.9% Latin America).
| This city: | 4.9% |
| Florida: | 21.1% |


Marital status for residents in Springfield
Marital status - White (Caucasian) population 15 years and over
- Males
- 30.3%Never married
- 43.5%Now married
- 5.1%Separated
- 4.9%Widowed
- 16.2%Divorced
- Females
- 26.0%Never married
- 34.5%Now married
- 7.1%Separated
- 14.1%Widowed
- 18.4%Divorced
Women who gave birth in the past 12 months
| Now married: | 36.5% (19) |
| Unmarried: | 63.5% (33) |
Women who did not give birth in the past 12 months
| Now married: | 42.5% (546) |
| Unmarried: | 57.5% (739) |
Marital status - Black or African American population 15 years and over
- Males
- 40.9%Never married
- 24.2%Now married
- 9.8%Separated
- 1.6%Widowed
- 23.5%Divorced
- Females
- 16.9%Never married
- 42.5%Now married
- 3.2%Separated
- 25.3%Widowed
- 12.1%Divorced
Women who did not give birth in the past 12 months
| Now married: | 58.8% (129) |
| Unmarried: | 41.2% (90) |
Marital status - Asian population 15 years and over
- Males
- 81.7%Never married
- 18.3%Now married
- 0.0%Separated
- 0.0%Widowed
- 0.0%Divorced
- Females
- 48.9%Never married
- 27.9%Now married
- 0.0%Separated
- 17.9%Widowed
- 5.3%Divorced
Women who did not give birth in the past 12 months
| Now married: | 0.0% (0) |
| Unmarried: | 100.0% (29) |
Marital status - Native Hawaiian / Pacific Islander population 15 years and over
- Males
- 37.5%Never married
- 62.5%Now married
- 0.0%Separated
- 0.0%Widowed
- 0.0%Divorced
- Females
- 52.2%Never married
- 32.6%Now married
- 0.0%Separated
- 0.0%Widowed
- 15.2%Divorced
Women who did not give birth in the past 12 months
| Now married: | 38.5% (11) |
| Unmarried: | 61.5% (18) |
Marital status - Other race population 15 years and over
- Males
- 8.5%Never married
- 66.0%Now married
- 0.0%Separated
- 0.0%Widowed
- 25.5%Divorced
- Females
- 100.0%Never married
- 0.0%Now married
- 0.0%Separated
- 0.0%Widowed
- 0.0%Divorced
Women who did not give birth in the past 12 months
| Now married: | 0.0% (0) |
| Unmarried: | 100.0% (7) |
Marital status - Two or more races population 15 years and over
- Males
- 70.5%Never married
- 18.9%Now married
- 0.0%Separated
- 10.6%Widowed
- 0.0%Divorced
- Females
- 57.3%Never married
- 32.0%Now married
- 0.0%Separated
- 6.8%Widowed
- 3.9%Divorced
Women who did not give birth in the past 12 months
| Now married: | 34.4% (96) |
| Unmarried: | 65.6% (182) |
Marital status - White alone, not Hispanic / Latino population 15 years and over
- Males
- 29.4%Never married
- 45.8%Now married
- 2.3%Separated
- 5.3%Widowed
- 17.2%Divorced
- Females
- 24.1%Never married
- 34.3%Now married
- 7.6%Separated
- 14.9%Widowed
- 19.1%Divorced
Women who gave birth in the past 12 months
| Now married: | 36.5% (19) |
| Unmarried: | 63.5% (33) |
Women who did not give birth in the past 12 months
| Now married: | 45.9% (546) |
| Unmarried: | 54.1% (643) |
Marital status - Hispanic or Latino population 15 years and over
- Males
- 42.5%Never married
- 16.9%Now married
- 29.5%Separated
- 5.5%Widowed
- 5.5%Divorced
- Females
- 54.5%Never married
- 33.6%Now married
- 0.0%Separated
- 3.0%Widowed
- 9.0%Divorced
Women who did not give birth in the past 12 months
| Now married: | 16.4% (37) |
| Unmarried: | 83.6% (190) |
Ancestries in Springfield

- 71317.9%American
- 3388.5%English
- 2155.4%Irish
- 1644.1%European
- 1162.9%Scotch-Irish
- 1132.8%German
- 862.2%Italian
- 681.7%Scottish
- 431.1%Jamaican
- 381.0%Welsh
- 230.6%Slovak
- 190.5%French
- 150.4%Austrian
- 140.4%British
- 80.2%Polish
- 60.2%Finnish
- 20.05%Dutch
- 20.05%Haitian
- 10.03%African

Geographical mobility in Springfield

- Same house 1 year ago
- 4,77982.9%White (Caucasian)
- 1,245100.0%Black or African American
- 44100.0%American Indian / Alaska Native
- 458100.0%Asian
- 3640.6%Native Hawaiian / Pacific Islander
- 4443.3%Other race
- 59169.7%Two or more races
- 4,52182.6%White alone, not Hispanic / Latino
- 55187.7%Hispanic or Latino

-
- Moved within same county
- 4447.7%White / Caucasian
- 463.8%Black or African American
- 5866.0%Native Hawaiian / Pacific Islander
- 1616.0%Other race
- 28833.9%Two or more races
- 4307.9%White alone, not Hispanic / Latino
- 213.4%Hispanic or Latino

-
- Moved within same state
- 310.5%White / Caucasian
- 131.1%Black or African American
- 55.2%Other race
- 260.5%White alone, not Hispanic / Latino
- 50.8%Hispanic or Latino

-
- Moved from different state
- 3265.7%White / Caucasian
- 3938.7%Other race
- 3356.1%White alone, not Hispanic / Latino
- 436.8%Hispanic or Latino

-
- Moved from abroad
- 741.3%White
- 611.1%White alone, not Hispanic / Latino
- 223.5%Hispanic or Latino

Children Nativity (place of birth) in Springfield
Place of birth for residents in Springfield
![Place of birth for the foreign-born population - Regions]()
- 310Asia
- 263South Eastern Asia
- 97Americas
- 82Latin America
- 63Caribbean
- 31South Central Asia
- 15Eastern Asia
- 15China
- 15Northern America
- 13South America
- 7Europe
- 7Northern Europe
- 5Central America

![Place of birth for the foreign-born population - Countries]()
- 209Vietnam
- 47Jamaica
- 38Philippines
- 31Pakistan
- 15Taiwan
- 15Cuba
- 14Thailand
- 13Colombia
- 7England
- 5Mexico

Grandparents responsible for own grandchildren in Springfield
Zip codes: 32401.