Races in Spring Lake Park, Minnesota (MN) Detailed Stats
Data:
Races - White alone (%)
Races - White alone (% change since 2000)
Races - Black alone (%)
Races - Black alone (% change since 2000)
Races - American Indian alone (%)
Races - American Indian alone (% change since 2000)
Races - Asian alone (%)
Races - Asian alone (% change since 2000)
Races - Hispanic (%)
Races - Hispanic (% change since 2000)
Races - Native Hawaiian and Other Pacific Islander alone (%)
Races - Native Hawaiian and Other Pacific Islander alone (% change since 2000)
Races - Two or more races(%)
Races - Two or more races(% change since 2000)
Races - Other race alone (%)
Races - Other race alone (% change since 2000)
Racial diversity
Place of birth - Born in state of residence (%)
Place of birth - Born in state of residence (%) - White
Place of birth - Born in state of residence (%) - Black or African American
Place of birth - Born in state of residence (%) - Asian
Place of birth - Born in state of residence (%) - Hispanic or Latino
Place of birth - Born in state of residence (%) - American Indian and Alaska Native
Place of birth - Born in state of residence (%) - Multirace
Place of birth - Born in state of residence (%) - Other Race
Place of birth - Born in other state (%)
Place of birth - Born in other state (%) - White
Place of birth - Born in other state (%) - Black or African American
Place of birth - Born in other state (%) - Asian
Place of birth - Born in other state (%) - Hispanic or Latino
Place of birth - Born in other state (%) - American Indian and Alaska Native
Place of birth - Born in other state (%) - Multirace
Place of birth - Born in other state (%) - Other Race
Place of birth - Native, outside of US (%)
Place of birth - Native, outside of US (%) - White
Place of birth - Native, outside of US (%) - Black or African American
Place of birth - Native, outside of US (%) - Asian
Place of birth - Native, outside of US (%) - Hispanic or Latino
Place of birth - Native, outside of US (%) - American Indian and Alaska Native
Place of birth - Native, outside of US (%) - Multirace
Place of birth - Native, outside of US (%) - Other Race
Place of birth - Foreign born (%)
Place of birth - Foreign born (%) - White
Place of birth - Foreign born (%) - Black or African American
Place of birth - Foreign born (%) - Asian
Place of birth - Foreign born (%) - Hispanic or Latino
Place of birth - Foreign born (%) - American Indian and Alaska Native
Place of birth - Foreign born (%) - Multirace
Place of birth - Foreign born (%) - Other Race
Residents speaking English at home (%)
Residents speaking English at home - Born in the United States (%)
Residents speaking English at home - Native, born elsewhere (%)
Residents speaking English at home - Foreign born (%)
Residents speaking Spanish at home (%)
Residents speaking Spanish at home - Born in the United States (%)
Residents speaking Spanish at home - Native, born elsewhere (%)
Residents speaking Spanish at home - Foreign born (%)
Residents speaking other language at home (%)
Residents speaking other language at home - Born in the United States (%)
Residents speaking other language at home - Native, born elsewhere (%)
Residents speaking other language at home - Foreign born (%)
Marital status - Never married (%)
Marital status - Now married (%)
Marital status - Separated (%)
Marital status - Widowed (%)
Marital status - Divorced (%)
Ancestries Reported - Arab (%)
Ancestries Reported - Czech (%)
Ancestries Reported - Danish (%)
Ancestries Reported - Dutch (%)
Ancestries Reported - English (%)
Ancestries Reported - French (%)
Ancestries Reported - French Canadian (%)
Ancestries Reported - German (%)
Ancestries Reported - Greek (%)
Ancestries Reported - Hungarian (%)
Ancestries Reported - Irish (%)
Ancestries Reported - Italian (%)
Ancestries Reported - Lithuanian (%)
Ancestries Reported - Norwegian (%)
Ancestries Reported - Polish (%)
Ancestries Reported - Portuguese (%)
Ancestries Reported - Russian (%)
Ancestries Reported - Scotch-Irish (%)
Ancestries Reported - Scottish (%)
Ancestries Reported - Slovak (%)
Ancestries Reported - Subsaharan African (%)
Ancestries Reported - Swedish (%)
Ancestries Reported - Swiss (%)
Ancestries Reported - Ukrainian (%)
Ancestries Reported - United States (%)
Ancestries Reported - Welsh (%)
Ancestries Reported - West Indian (%)
Ancestries Reported - Other (%)
Geographical mobility - Same house 1 year ago (%)
Geographical mobility - Same house 1 year ago (%) - White
Geographical mobility - Same house 1 year ago (%) - Black or African American
Geographical mobility - Same house 1 year ago (%) - Asian
Geographical mobility - Same house 1 year ago (%) - Hispanic or Latino
Geographical mobility - Same house 1 year ago (%) - American Indian and Alaska Native
Geographical mobility - Same house 1 year ago (%) - Multirace
Geographical mobility - Same house 1 year ago (%) - Other Race
Geographical mobility - Moved within same county (%)
Geographical mobility - Moved within same county (%) - White
Geographical mobility - Moved within same county (%) - Black or African American
Geographical mobility - Moved within same county (%) - Asian
Geographical mobility - Moved within same county (%) - Hispanic or Latino
Geographical mobility - Moved within same county (%) - American Indian and Alaska Native
Geographical mobility - Moved within same county (%) - Multirace
Geographical mobility - Moved within same county (%) - Other Race
Geographical mobility - Moved from different county within same state (%)
Geographical mobility - Moved from different county within same state (%) - White
Geographical mobility - Moved from different county within same state (%) - Black or African American
Geographical mobility - Moved from different county within same state (%) - Asian
Geographical mobility - Moved from different county within same state (%) - Hispanic or Latino
Geographical mobility - Moved from different county within same state (%) - American Indian and Alaska Native
Geographical mobility - Moved from different county within same state (%) - Multirace
Geographical mobility - Moved from different county within same state (%) - Other Race
Geographical mobility - Moved from different state (%)
Geographical mobility - Moved from different state (%) - White
Geographical mobility - Moved from different state (%) - Black or African American
Geographical mobility - Moved from different state (%) - Asian
Geographical mobility - Moved from different state (%) - Hispanic or Latino
Geographical mobility - Moved from different state (%) - American Indian and Alaska Native
Geographical mobility - Moved from different state (%) - Multirace
Geographical mobility - Moved from different state (%) - Other Race
Geographical mobility - Moved from abroad (%)
Geographical mobility - Moved from abroad (%) - White
Geographical mobility - Moved from abroad (%) - Black or African American
Geographical mobility - Moved from abroad (%) - Asian
Geographical mobility - Moved from abroad (%) - Hispanic or Latino
Geographical mobility - Moved from abroad (%) - American Indian and Alaska Native
Geographical mobility - Moved from abroad (%) - Multirace
Geographical mobility - Moved from abroad (%) - Other Race
Place of birth for the foreign-born population - Ireland (%)
Place of birth for the foreign-born population - Denmark (%)
Place of birth for the foreign-born population - Norway (%)
Place of birth for the foreign-born population - Sweden (%)
Place of birth for the foreign-born population - United Kingdom (%)
Place of birth for the foreign-born population - England (%)
Place of birth for the foreign-born population - Scotland (%)
Place of birth for the foreign-born population - Other Northern Europe (%)
Place of birth for the foreign-born population - Austria (%)
Place of birth for the foreign-born population - Belgium (%)
Place of birth for the foreign-born population - France (%)
Place of birth for the foreign-born population - Germany (%)
Place of birth for the foreign-born population - Netherlands (%)
Place of birth for the foreign-born population - Switzerland (%)
Place of birth for the foreign-born population - Other Western Europe (%)
Place of birth for the foreign-born population - Greece (%)
Place of birth for the foreign-born population - Italy (%)
Place of birth for the foreign-born population - Portugal (%)
Place of birth for the foreign-born population - Spain (%)
Place of birth for the foreign-born population - Other Southern Europe (%)
Place of birth for the foreign-born population - Albania (%)
Place of birth for the foreign-born population - Belarus (%)
Place of birth for the foreign-born population - Bosnia and Herzegovina (%)
Place of birth for the foreign-born population - Bulgaria (%)
Place of birth for the foreign-born population - Croatia (%)
Place of birth for the foreign-born population - Czechoslovakia (%)
Place of birth for the foreign-born population - Hungary (%)
Place of birth for the foreign-born population - Latvia (%)
Place of birth for the foreign-born population - Lithuania (%)
Place of birth for the foreign-born population - North Macedonia (Macedonia) (%)
Place of birth for the foreign-born population - Moldova (%)
Place of birth for the foreign-born population - Poland (%)
Place of birth for the foreign-born population - Romania (%)
Place of birth for the foreign-born population - Russia (%)
Place of birth for the foreign-born population - Serbia (%)
Place of birth for the foreign-born population - Ukraine (%)
Place of birth for the foreign-born population - Other Eastern Europe (%)
Place of birth for the foreign-born population - China (%)
Place of birth for the foreign-born population - Hong Kong (%)
Place of birth for the foreign-born population - Taiwan (%)
Place of birth for the foreign-born population - Japan (%)
Place of birth for the foreign-born population - Korea (%)
Place of birth for the foreign-born population - Other Eastern Asia (%)
Place of birth for the foreign-born population - Afghanistan (%)
Place of birth for the foreign-born population - Bangladesh (%)
Place of birth for the foreign-born population - India (%)
Place of birth for the foreign-born population - Iran (%)
Place of birth for the foreign-born population - Kazakhstan (%)
Place of birth for the foreign-born population - Nepal (%)
Place of birth for the foreign-born population - Pakistan (%)
Place of birth for the foreign-born population - Sri Lanka (%)
Place of birth for the foreign-born population - Uzbekistan (%)
Place of birth for the foreign-born population - Other South Central Asia (%)
Place of birth for the foreign-born population - Burma (%)
Place of birth for the foreign-born population - Cambodia (%)
Place of birth for the foreign-born population - Indonesia (%)
Place of birth for the foreign-born population - Laos (%)
Place of birth for the foreign-born population - Malaysia (%)
Place of birth for the foreign-born population - Philippines (%)
Place of birth for the foreign-born population - Singapore (%)
Place of birth for the foreign-born population - Thailand (%)
Place of birth for the foreign-born population - Vietnam (%)
Place of birth for the foreign-born population - Other South Eastern Asia (%)
Place of birth for the foreign-born population - Armenia (%)
Place of birth for the foreign-born population - Iraq (%)
Place of birth for the foreign-born population - Israel (%)
Place of birth for the foreign-born population - Jordan (%)
Place of birth for the foreign-born population - Kuwait (%)
Place of birth for the foreign-born population - Lebanon (%)
Place of birth for the foreign-born population - Saudi Arabia (%)
Place of birth for the foreign-born population - Syria (%)
Place of birth for the foreign-born population - Turkey (%)
Place of birth for the foreign-born population - Yemen (%)
Place of birth for the foreign-born population - Other Western Asia (%)
Place of birth for the foreign-born population - Eritrea (%)
Place of birth for the foreign-born population - Ethiopia (%)
Place of birth for the foreign-born population - Kenya (%)
Place of birth for the foreign-born population - Somalia (%)
Place of birth for the foreign-born population - Uganda (%)
Place of birth for the foreign-born population - Zimbabwe (%)
Place of birth for the foreign-born population - Other Eastern Africa (%)
Place of birth for the foreign-born population - Cameroon (%)
Place of birth for the foreign-born population - Congo (%)
Place of birth for the foreign-born population - Democratic Republic of Congo (Zaire) (%)
Place of birth for the foreign-born population - Other Middle Africa (%)
Place of birth for the foreign-born population - Egypt (%)
Place of birth for the foreign-born population - Morocco (%)
Place of birth for the foreign-born population - Sudan (%)
Place of birth for the foreign-born population - Other Northern Africa (%)
Place of birth for the foreign-born population - South Africa (%)
Place of birth for the foreign-born population - Other Southern Africa (%)
Place of birth for the foreign-born population - Cabo Verde (%)
Place of birth for the foreign-born population - Ghana (%)
Place of birth for the foreign-born population - Liberia (%)
Place of birth for the foreign-born population - Nigeria (%)
Place of birth for the foreign-born population - Senegal (%)
Place of birth for the foreign-born population - Sierra Leone (%)
Place of birth for the foreign-born population - Other Western Africa (%)
Place of birth for the foreign-born population - Australia (%)
Place of birth for the foreign-born population - New Zealand (%)
Place of birth for the foreign-born population - Fiji (%)
Place of birth for the foreign-born population - Micronesia (%)
Place of birth for the foreign-born population - Bahamas (%)
Place of birth for the foreign-born population - Barbados (%)
Place of birth for the foreign-born population - Cuba (%)
Place of birth for the foreign-born population - Dominica (%)
Place of birth for the foreign-born population - Dominican Republic (%)
Place of birth for the foreign-born population - Grenada (%)
Place of birth for the foreign-born population - Haiti (%)
Place of birth for the foreign-born population - Jamaica (%)
Place of birth for the foreign-born population - St. Vincent and the Grenadines (%)
Place of birth for the foreign-born population - Trinidad and Tobago (%)
Place of birth for the foreign-born population - West Indies (%)
Place of birth for the foreign-born population - Other Caribbean (%)
Place of birth for the foreign-born population - Belize (%)
Place of birth for the foreign-born population - Costa Rica (%)
Place of birth for the foreign-born population - El Salvador (%)
Place of birth for the foreign-born population - Guatemala (%)
Place of birth for the foreign-born population - Honduras (%)
Place of birth for the foreign-born population - Mexico (%)
Place of birth for the foreign-born population - Nicaragua (%)
Place of birth for the foreign-born population - Panama (%)
Place of birth for the foreign-born population - Other Central America (%)
Place of birth for the foreign-born population - Argentina (%)
Place of birth for the foreign-born population - Bolivia (%)
Place of birth for the foreign-born population - Brazil (%)
Place of birth for the foreign-born population - Chile (%)
Place of birth for the foreign-born population - Colombia (%)
Place of birth for the foreign-born population - Ecuador (%)
Place of birth for the foreign-born population - Guyana (%)
Place of birth for the foreign-born population - Peru (%)
Place of birth for the foreign-born population - Uruguay (%)
Place of birth for the foreign-born population - Venezuela (%)
Place of birth for the foreign-born population - Other South America (%)
Place of birth for the foreign-born population - Canada (%)
Place of birth for the foreign-born population - Other Northern America (%)
Place of birth for the foreign-born population - Other (%)
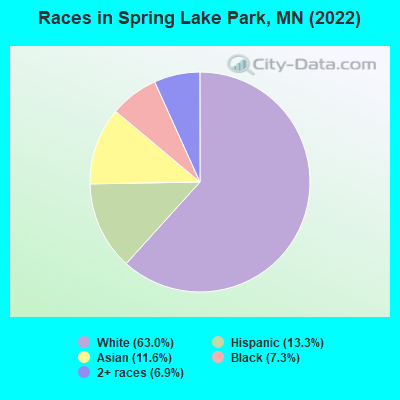
According to 2022 data, the most numerous races in Spring Lake Park, MN are White alone (4,444 residents), Black alone (512 residents), and Hispanic (940 residents). 76.9% of Spring Lake Park residents speak English at home. 14.7% of Spring Lake Park, MN residents are foreign-born (5.7% born in Latin America, 4.8% born in Asia, 1.9% born in Europe, 1.9% born in Africa), which is 45.8% greater than the foreign-born rate of 8.0% across the entire state of Minnesota.
Race distribution in Spring Lake Park
2000 2022
4,337,143 88.2% White alone 168,813 3.4% Black alone 143,382 2.9% Hispanic 141,083 2.9% Asian alone 70,304 1.4% Two or more races 52,009 1.1% American Indian alone 5,031 0.1% Other race alone 1,714 0.03% Native Hawaiian and Other
4,356,347 76.2% White alone 395,179 6.9% Black alone 333,830 5.8% Hispanic 294,800 5.2% Asian alone 259,649 4.5% Two or more races 42,125 0.7% American Indian alone 32,976 0.6% Other race alone 2,278 0.04% Native Hawaiian and Other
Income and house value in Spring Lake Park Median household income in 2022 $81,590 White non-Hispanic householders$58,735 Black householders$76,192 Some other race householders$71,297 Two or more races householders$64,686 Hispanic or Latino race householdersMedian 2022 house value $294,962 White Non-Hispanic householders$320,076 Black or African American householders$861,744 American Indian or Alaska Native householders $328,201 Asian householders$276,989 Some other race householders$276,989 Two or more races householders$276,989 Hispanic or Latino householders
Median age by race in Spring Lake Park
49.0 Median age for White residents46.5 53.9 38.9 Median age for Black or African American residents42.6 33.3 -915,392,455.8 Median age for American Indian / Alaska Native residents-783,968,718.7 -1,037,974,682.5 32.3 Median age for Asian residents32.2 15.7 -670,553,935.2 Median age for Native Hawaiian / Pacific Islander residents-670,553,935.2 -534,959,349.1 33.8 Median age for Other race residents31.2 34.0 25.2 Median age for Two or more races residents31.4 22.2 49.6 Median age for White alone residents47.8 53.4 24.4 Median age for Hispanic or Latino residents24.0 24.4
Owner/renter occupied households by race in Spring Lake Park
House owners and renters - White residents 1,453 71.4% Owner occupied583 28.6% Renter occupiedHouse owners and renters - Black or African American residents 56 35.7% Owner occupied101 64.3% Renter occupiedHouse owners and renters - American Indian / Alaska Native residents 12 100.0% Renter occupiedHouse owners and renters - Asian residents 145 72.1% Owner occupied56 27.9% Renter occupiedHouse owners and renters - Other race residents 133 92.4% Owner occupied11 7.6% Renter occupiedHouse owners and renters - Two or more races residents 252 80.3% Owner occupied62 19.7% Renter occupiedHouse owners and renters - White alone residents 1,464 72.2% Owner occupied564 27.8% Renter occupiedHouse owners and renters - Hispanic or Latino residents 168 78.5% Owner occupied46 21.5% Renter occupied
Language usage in Spring Lake Park
English speakers - Total 76.9% of residents of Spring Lake Park speak English at home.
10.5% of residents speak Spanish at home 481 67.0% Speak English very well237 33.0% Speak English less than very well13.7% of residents speak other language at home 473 50.5% Speak English very well463 49.5% Speak English less than very well
English speakers - Born in the United States 84.2% of residents of Spring Lake Park speak English at home.
10.8% of residents speak Spanish at home 146 95.4% Speak English very well7 4.6% Speak English less than very well6.6% of residents speak other language at home 62 66.7% Speak English very well31 33.3% Speak English less than very well
English speakers - Native, born elsewhere 68.6% of residents of Spring Lake Park speak English at home.
31.4% of residents speak other language at home 11 100.0% Speak English very well
English speakers - Foreign-born 11.9% of residents of Spring Lake Park speak English at home.
35.4% of residents speak Spanish at home 190 46.5% Speak English very well219 53.5% Speak English less than very well53.2% of residents speak other language at home 267 43.4% Speak English very well348 56.6% Speak English less than very well
White (Caucasian) - Speak only English Native:
96.0% (4,038)Foreign-born:
12.4% (31)
White (Caucasian) - Speak another language Native:
4.4% (184)Foreign-born:
88.4% (218)
Black or African American - Speak only English Native:
87.7% (324)Foreign-born:
33.9% (44)
Black or African American - Speak another language Native:
8.6% (32)Foreign-born:
66.2% (86)
Asian - Speak only English Native:
37.9% (152)Foreign-born:
5.7% (18)
Asian - Speak another language Native:
61.8% (248)Foreign-born:
99.2% (308)
Other race - Speak only English Native:
35.2% (47)Foreign-born:
9.5% (33)
Other race - Speak another language Native:
61.5% (82)Foreign-born:
79.5% (280)
Two or more races - Speak only English Native:
83.5% (671)Foreign-born:
3.2% (6)
Two or more races - Speak another language Native:
13.4% (107)Foreign-born:
100.0% (194)
White alone - Speak only English Native:
97.8% (4,042)Foreign-born:
13.6% (34)
White alone - Speak another language Native:
2.2% (90)Foreign-born:
87.6% (217)
Hispanic or Latino - Speak only English Native:
35.7% (152)Foreign-born:
9.2% (43)
Hispanic or Latino - Speak another language Native:
67.8% (289)Foreign-born:
85.1% (402)
Foreign-born residents in Spring Lake Park 1,041 residents are foreign born (5.7% Latin America , 4.8% Asia , 1.9% Europe , 1.9% Africa ).
This city:
14.7%Minnesota:
8.5%
Marital status for residents in Spring Lake Park Marital status - White (Caucasian) population 15 years and over
Males 46.0% Never married40.4% Now married1.1% Separated2.7% Widowed9.7% DivorcedFemales 33.0% Never married37.8% Now married0.5% Separated13.2% Widowed15.5% DivorcedWomen who gave birth in the past 12 months Now married:
40.7% (10)Unmarried:
59.3% (15)
Women who did not give birth in the past 12 months Now married:
31.1% (281)Unmarried:
68.9% (622)
Marital status - Black or African American population 15 years and over
Males 9.1% Never married72.0% Now married0.0% Separated1.7% Widowed17.1% DivorcedFemales 28.0% Never married48.7% Now married0.0% Separated8.0% Widowed15.3% DivorcedWomen who gave birth in the past 12 months Now married:
0.0% (0)Unmarried:
100.0% (11)
Women who did not give birth in the past 12 months Now married:
51.3% (43)Unmarried:
48.7% (40)
Marital status - Asian population 15 years and over
Males 40.4% Never married41.7% Now married18.0% Separated0.0% Widowed0.0% DivorcedFemales 9.2% Never married61.2% Now married0.0% Separated3.4% Widowed26.2% DivorcedWomen who gave birth in the past 12 months Now married:
100.0% (23)Unmarried:
0.0% (0)
Women who did not give birth in the past 12 months Now married:
34.6% (44)Unmarried:
65.4% (83)
Marital status - Other race population 15 years and over
Males 6.2% Never married53.1% Now married37.2% Separated0.0% Widowed3.5% DivorcedFemales 0.0% Never married87.2% Now married0.0% Separated12.8% Widowed0.0% DivorcedWomen who did not give birth in the past 12 months Now married:
100.0% (121)Unmarried:
0.0% (0)
Marital status - Two or more races population 15 years and over
Males 66.8% Never married29.3% Now married0.0% Separated0.0% Widowed3.9% DivorcedFemales 50.4% Never married28.0% Now married0.0% Separated4.7% Widowed16.8% DivorcedWomen who did not give birth in the past 12 months Now married:
30.1% (94)Unmarried:
69.9% (219)
Marital status - White alone, not Hispanic / Latino population 15 years and over
Males 45.4% Never married40.6% Now married1.2% Separated2.8% Widowed10.1% DivorcedFemales 32.3% Never married38.4% Now married0.6% Separated13.4% Widowed15.3% DivorcedWomen who gave birth in the past 12 months Now married:
100.0% (10)Unmarried:
0.0% (0)
Women who did not give birth in the past 12 months Now married:
31.5% (286)Unmarried:
68.5% (624)
Marital status - Hispanic or Latino population 15 years and over
Males 44.6% Never married42.0% Now married12.2% Separated0.0% Widowed1.2% DivorcedFemales 21.3% Never married56.9% Now married0.0% Separated4.6% Widowed17.1% DivorcedWomen who gave birth in the past 12 months Now married:
0.0% (0)Unmarried:
100.0% (18)
Women who did not give birth in the past 12 months Now married:
68.3% (136)Unmarried:
31.7% (63)
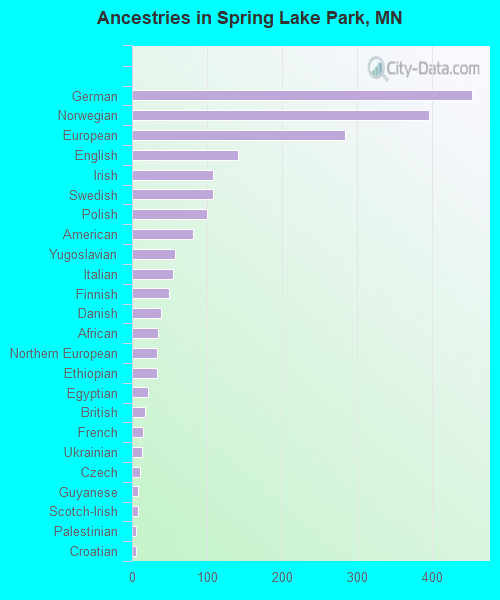
Ancestries in Spring Lake Park
454 11.6% German396 10.1% Norwegian285 7.3% European142 3.6% English108 2.8% Irish108 2.8% Swedish100 2.6% Polish82 2.1% American57 1.5% Yugoslavian55 1.4% Italian50 1.3% Finnish39 1.0% Danish35 0.9% African34 0.9% Northern European33 0.8% Ethiopian22 0.6% Egyptian17 0.4% British15 0.4% French13 0.3% Ukrainian11 0.3% Czech8 0.2% Guyanese8 0.2% Scotch-Irish6 0.2% Palestinian5 0.1% Croatian3 0.08% Arab1 0.03% Russian
Children Nativity (place of birth) in Spring Lake Park
Children under 6 years - Living with two parents Both parents native 118 100.0% NativeOne native, one foreign-born parent 50 100.0% NativeChildren under 6 years - Living with one parent Native parent 67 100.0% NativeForeign-born parent 85 100.0% NativeChildren 6 to 17 years - Living with two parents Both parents native 294 100.0% NativeBoth parents foreign-born 67 56.8% Native51 43.2% Foreign-bornOne native, one foreign-born parent 58 100.0% NativeChildren 6 to 17 years - Living with one parent Native parent 272 100.0% NativeForeign-born parent 237 53.8% Native203 46.2% Foreign-born
Grandparents responsible for own grandchildren in Spring Lake Park
Grandparents (30 to 59 years) White / Caucasian 9 100.0% Responsible for grandchildrenBlack or African American 9 100.0% Responsible for grandchildrenAsian 50 100.0% Not responsible for grandchildrenWhite alone, not Hispanic / Latino 9 100.0% Responsible for grandchildrenGrandparents (60 years and over) White / Caucasian 24 69.7% Responsible for grandchildren10 30.3% Not responsible for grandchildrenBlack or African American 2 100.0% Not responsible for grandchildrenAsian 5 100.0% Not responsible for grandchildrenWhite alone, not Hispanic / Latino 24 69.7% Responsible for grandchildren10 30.3% Not responsible for grandchildren