Races in Spring Creek, Nevada (NV) Detailed Stats
Data:
Races - White alone (%)
Races - White alone (% change since 2000)
Races - Black alone (%)
Races - Black alone (% change since 2000)
Races - American Indian alone (%)
Races - American Indian alone (% change since 2000)
Races - Asian alone (%)
Races - Asian alone (% change since 2000)
Races - Hispanic (%)
Races - Hispanic (% change since 2000)
Races - Native Hawaiian and Other Pacific Islander alone (%)
Races - Native Hawaiian and Other Pacific Islander alone (% change since 2000)
Races - Two or more races(%)
Races - Two or more races(% change since 2000)
Races - Other race alone (%)
Races - Other race alone (% change since 2000)
Racial diversity
Place of birth - Born in state of residence (%)
Place of birth - Born in state of residence (%) - White
Place of birth - Born in state of residence (%) - Black or African American
Place of birth - Born in state of residence (%) - Asian
Place of birth - Born in state of residence (%) - Hispanic or Latino
Place of birth - Born in state of residence (%) - American Indian and Alaska Native
Place of birth - Born in state of residence (%) - Multirace
Place of birth - Born in state of residence (%) - Other Race
Place of birth - Born in other state (%)
Place of birth - Born in other state (%) - White
Place of birth - Born in other state (%) - Black or African American
Place of birth - Born in other state (%) - Asian
Place of birth - Born in other state (%) - Hispanic or Latino
Place of birth - Born in other state (%) - American Indian and Alaska Native
Place of birth - Born in other state (%) - Multirace
Place of birth - Born in other state (%) - Other Race
Place of birth - Native, outside of US (%)
Place of birth - Native, outside of US (%) - White
Place of birth - Native, outside of US (%) - Black or African American
Place of birth - Native, outside of US (%) - Asian
Place of birth - Native, outside of US (%) - Hispanic or Latino
Place of birth - Native, outside of US (%) - American Indian and Alaska Native
Place of birth - Native, outside of US (%) - Multirace
Place of birth - Native, outside of US (%) - Other Race
Place of birth - Foreign born (%)
Place of birth - Foreign born (%) - White
Place of birth - Foreign born (%) - Black or African American
Place of birth - Foreign born (%) - Asian
Place of birth - Foreign born (%) - Hispanic or Latino
Place of birth - Foreign born (%) - American Indian and Alaska Native
Place of birth - Foreign born (%) - Multirace
Place of birth - Foreign born (%) - Other Race
Residents speaking English at home (%)
Residents speaking English at home - Born in the United States (%)
Residents speaking English at home - Native, born elsewhere (%)
Residents speaking English at home - Foreign born (%)
Residents speaking Spanish at home (%)
Residents speaking Spanish at home - Born in the United States (%)
Residents speaking Spanish at home - Native, born elsewhere (%)
Residents speaking Spanish at home - Foreign born (%)
Residents speaking other language at home (%)
Residents speaking other language at home - Born in the United States (%)
Residents speaking other language at home - Native, born elsewhere (%)
Residents speaking other language at home - Foreign born (%)
Marital status - Never married (%)
Marital status - Now married (%)
Marital status - Separated (%)
Marital status - Widowed (%)
Marital status - Divorced (%)
Ancestries Reported - Arab (%)
Ancestries Reported - Czech (%)
Ancestries Reported - Danish (%)
Ancestries Reported - Dutch (%)
Ancestries Reported - English (%)
Ancestries Reported - French (%)
Ancestries Reported - French Canadian (%)
Ancestries Reported - German (%)
Ancestries Reported - Greek (%)
Ancestries Reported - Hungarian (%)
Ancestries Reported - Irish (%)
Ancestries Reported - Italian (%)
Ancestries Reported - Lithuanian (%)
Ancestries Reported - Norwegian (%)
Ancestries Reported - Polish (%)
Ancestries Reported - Portuguese (%)
Ancestries Reported - Russian (%)
Ancestries Reported - Scotch-Irish (%)
Ancestries Reported - Scottish (%)
Ancestries Reported - Slovak (%)
Ancestries Reported - Subsaharan African (%)
Ancestries Reported - Swedish (%)
Ancestries Reported - Swiss (%)
Ancestries Reported - Ukrainian (%)
Ancestries Reported - United States (%)
Ancestries Reported - Welsh (%)
Ancestries Reported - West Indian (%)
Ancestries Reported - Other (%)
Geographical mobility - Same house 1 year ago (%)
Geographical mobility - Same house 1 year ago (%) - White
Geographical mobility - Same house 1 year ago (%) - Black or African American
Geographical mobility - Same house 1 year ago (%) - Asian
Geographical mobility - Same house 1 year ago (%) - Hispanic or Latino
Geographical mobility - Same house 1 year ago (%) - American Indian and Alaska Native
Geographical mobility - Same house 1 year ago (%) - Multirace
Geographical mobility - Same house 1 year ago (%) - Other Race
Geographical mobility - Moved within same county (%)
Geographical mobility - Moved within same county (%) - White
Geographical mobility - Moved within same county (%) - Black or African American
Geographical mobility - Moved within same county (%) - Asian
Geographical mobility - Moved within same county (%) - Hispanic or Latino
Geographical mobility - Moved within same county (%) - American Indian and Alaska Native
Geographical mobility - Moved within same county (%) - Multirace
Geographical mobility - Moved within same county (%) - Other Race
Geographical mobility - Moved from different county within same state (%)
Geographical mobility - Moved from different county within same state (%) - White
Geographical mobility - Moved from different county within same state (%) - Black or African American
Geographical mobility - Moved from different county within same state (%) - Asian
Geographical mobility - Moved from different county within same state (%) - Hispanic or Latino
Geographical mobility - Moved from different county within same state (%) - American Indian and Alaska Native
Geographical mobility - Moved from different county within same state (%) - Multirace
Geographical mobility - Moved from different county within same state (%) - Other Race
Geographical mobility - Moved from different state (%)
Geographical mobility - Moved from different state (%) - White
Geographical mobility - Moved from different state (%) - Black or African American
Geographical mobility - Moved from different state (%) - Asian
Geographical mobility - Moved from different state (%) - Hispanic or Latino
Geographical mobility - Moved from different state (%) - American Indian and Alaska Native
Geographical mobility - Moved from different state (%) - Multirace
Geographical mobility - Moved from different state (%) - Other Race
Geographical mobility - Moved from abroad (%)
Geographical mobility - Moved from abroad (%) - White
Geographical mobility - Moved from abroad (%) - Black or African American
Geographical mobility - Moved from abroad (%) - Asian
Geographical mobility - Moved from abroad (%) - Hispanic or Latino
Geographical mobility - Moved from abroad (%) - American Indian and Alaska Native
Geographical mobility - Moved from abroad (%) - Multirace
Geographical mobility - Moved from abroad (%) - Other Race
Place of birth for the foreign-born population - Ireland (%)
Place of birth for the foreign-born population - Denmark (%)
Place of birth for the foreign-born population - Norway (%)
Place of birth for the foreign-born population - Sweden (%)
Place of birth for the foreign-born population - United Kingdom (%)
Place of birth for the foreign-born population - England (%)
Place of birth for the foreign-born population - Scotland (%)
Place of birth for the foreign-born population - Other Northern Europe (%)
Place of birth for the foreign-born population - Austria (%)
Place of birth for the foreign-born population - Belgium (%)
Place of birth for the foreign-born population - France (%)
Place of birth for the foreign-born population - Germany (%)
Place of birth for the foreign-born population - Netherlands (%)
Place of birth for the foreign-born population - Switzerland (%)
Place of birth for the foreign-born population - Other Western Europe (%)
Place of birth for the foreign-born population - Greece (%)
Place of birth for the foreign-born population - Italy (%)
Place of birth for the foreign-born population - Portugal (%)
Place of birth for the foreign-born population - Spain (%)
Place of birth for the foreign-born population - Other Southern Europe (%)
Place of birth for the foreign-born population - Albania (%)
Place of birth for the foreign-born population - Belarus (%)
Place of birth for the foreign-born population - Bosnia and Herzegovina (%)
Place of birth for the foreign-born population - Bulgaria (%)
Place of birth for the foreign-born population - Croatia (%)
Place of birth for the foreign-born population - Czechoslovakia (%)
Place of birth for the foreign-born population - Hungary (%)
Place of birth for the foreign-born population - Latvia (%)
Place of birth for the foreign-born population - Lithuania (%)
Place of birth for the foreign-born population - North Macedonia (Macedonia) (%)
Place of birth for the foreign-born population - Moldova (%)
Place of birth for the foreign-born population - Poland (%)
Place of birth for the foreign-born population - Romania (%)
Place of birth for the foreign-born population - Russia (%)
Place of birth for the foreign-born population - Serbia (%)
Place of birth for the foreign-born population - Ukraine (%)
Place of birth for the foreign-born population - Other Eastern Europe (%)
Place of birth for the foreign-born population - China (%)
Place of birth for the foreign-born population - Hong Kong (%)
Place of birth for the foreign-born population - Taiwan (%)
Place of birth for the foreign-born population - Japan (%)
Place of birth for the foreign-born population - Korea (%)
Place of birth for the foreign-born population - Other Eastern Asia (%)
Place of birth for the foreign-born population - Afghanistan (%)
Place of birth for the foreign-born population - Bangladesh (%)
Place of birth for the foreign-born population - India (%)
Place of birth for the foreign-born population - Iran (%)
Place of birth for the foreign-born population - Kazakhstan (%)
Place of birth for the foreign-born population - Nepal (%)
Place of birth for the foreign-born population - Pakistan (%)
Place of birth for the foreign-born population - Sri Lanka (%)
Place of birth for the foreign-born population - Uzbekistan (%)
Place of birth for the foreign-born population - Other South Central Asia (%)
Place of birth for the foreign-born population - Burma (%)
Place of birth for the foreign-born population - Cambodia (%)
Place of birth for the foreign-born population - Indonesia (%)
Place of birth for the foreign-born population - Laos (%)
Place of birth for the foreign-born population - Malaysia (%)
Place of birth for the foreign-born population - Philippines (%)
Place of birth for the foreign-born population - Singapore (%)
Place of birth for the foreign-born population - Thailand (%)
Place of birth for the foreign-born population - Vietnam (%)
Place of birth for the foreign-born population - Other South Eastern Asia (%)
Place of birth for the foreign-born population - Armenia (%)
Place of birth for the foreign-born population - Iraq (%)
Place of birth for the foreign-born population - Israel (%)
Place of birth for the foreign-born population - Jordan (%)
Place of birth for the foreign-born population - Kuwait (%)
Place of birth for the foreign-born population - Lebanon (%)
Place of birth for the foreign-born population - Saudi Arabia (%)
Place of birth for the foreign-born population - Syria (%)
Place of birth for the foreign-born population - Turkey (%)
Place of birth for the foreign-born population - Yemen (%)
Place of birth for the foreign-born population - Other Western Asia (%)
Place of birth for the foreign-born population - Eritrea (%)
Place of birth for the foreign-born population - Ethiopia (%)
Place of birth for the foreign-born population - Kenya (%)
Place of birth for the foreign-born population - Somalia (%)
Place of birth for the foreign-born population - Uganda (%)
Place of birth for the foreign-born population - Zimbabwe (%)
Place of birth for the foreign-born population - Other Eastern Africa (%)
Place of birth for the foreign-born population - Cameroon (%)
Place of birth for the foreign-born population - Congo (%)
Place of birth for the foreign-born population - Democratic Republic of Congo (Zaire) (%)
Place of birth for the foreign-born population - Other Middle Africa (%)
Place of birth for the foreign-born population - Egypt (%)
Place of birth for the foreign-born population - Morocco (%)
Place of birth for the foreign-born population - Sudan (%)
Place of birth for the foreign-born population - Other Northern Africa (%)
Place of birth for the foreign-born population - South Africa (%)
Place of birth for the foreign-born population - Other Southern Africa (%)
Place of birth for the foreign-born population - Cabo Verde (%)
Place of birth for the foreign-born population - Ghana (%)
Place of birth for the foreign-born population - Liberia (%)
Place of birth for the foreign-born population - Nigeria (%)
Place of birth for the foreign-born population - Senegal (%)
Place of birth for the foreign-born population - Sierra Leone (%)
Place of birth for the foreign-born population - Other Western Africa (%)
Place of birth for the foreign-born population - Australia (%)
Place of birth for the foreign-born population - New Zealand (%)
Place of birth for the foreign-born population - Fiji (%)
Place of birth for the foreign-born population - Micronesia (%)
Place of birth for the foreign-born population - Bahamas (%)
Place of birth for the foreign-born population - Barbados (%)
Place of birth for the foreign-born population - Cuba (%)
Place of birth for the foreign-born population - Dominica (%)
Place of birth for the foreign-born population - Dominican Republic (%)
Place of birth for the foreign-born population - Grenada (%)
Place of birth for the foreign-born population - Haiti (%)
Place of birth for the foreign-born population - Jamaica (%)
Place of birth for the foreign-born population - St. Vincent and the Grenadines (%)
Place of birth for the foreign-born population - Trinidad and Tobago (%)
Place of birth for the foreign-born population - West Indies (%)
Place of birth for the foreign-born population - Other Caribbean (%)
Place of birth for the foreign-born population - Belize (%)
Place of birth for the foreign-born population - Costa Rica (%)
Place of birth for the foreign-born population - El Salvador (%)
Place of birth for the foreign-born population - Guatemala (%)
Place of birth for the foreign-born population - Honduras (%)
Place of birth for the foreign-born population - Mexico (%)
Place of birth for the foreign-born population - Nicaragua (%)
Place of birth for the foreign-born population - Panama (%)
Place of birth for the foreign-born population - Other Central America (%)
Place of birth for the foreign-born population - Argentina (%)
Place of birth for the foreign-born population - Bolivia (%)
Place of birth for the foreign-born population - Brazil (%)
Place of birth for the foreign-born population - Chile (%)
Place of birth for the foreign-born population - Colombia (%)
Place of birth for the foreign-born population - Ecuador (%)
Place of birth for the foreign-born population - Guyana (%)
Place of birth for the foreign-born population - Peru (%)
Place of birth for the foreign-born population - Uruguay (%)
Place of birth for the foreign-born population - Venezuela (%)
Place of birth for the foreign-born population - Other South America (%)
Place of birth for the foreign-born population - Canada (%)
Place of birth for the foreign-born population - Other Northern America (%)
Place of birth for the foreign-born population - Other (%)
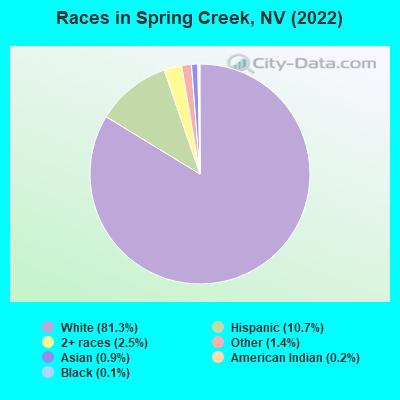
According to 2022 data, the most numerous races in Spring Creek, NV are White alone (12,532 residents), Hispanic (1,643 residents), and Black alone (23 residents). 93.7% of Spring Creek residents speak English at home. 2.9% of Spring Creek, NV residents are foreign-born (1.5% born in Latin America, 0.5% born in Europe, 0.5% born in Asia), which is 515.3% less than the foreign-born rate of 18.0% across the entire state of Nevada.
Race distribution in Spring Creek
2000 2022
1,303,001 65.2% White alone 393,970 19.7% Hispanic 131,509 6.6% Black alone 88,593 4.4% Asian alone 49,231 2.5% Two or more races 21,397 1.1% American Indian alone 7,769 0.4% Native Hawaiian and Other 2,787 0.1% Other race alone
1,410,145 44.4% White alone 961,357 30.3% Hispanic 286,471 9.0% Black alone 281,149 8.8% Asian alone 182,151 5.7% Two or more races 20,102 0.6% Native Hawaiian and Other 18,781 0.6% Other race alone 17,616 0.6% American Indian alone
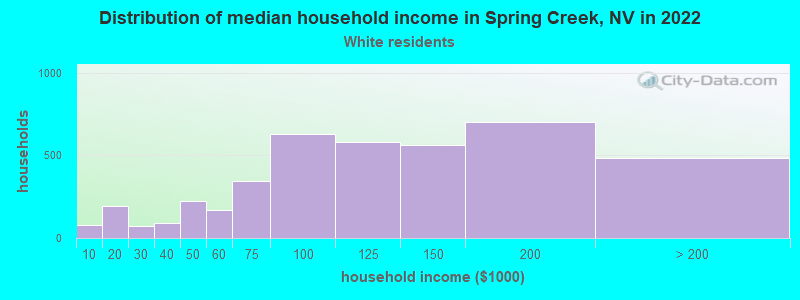
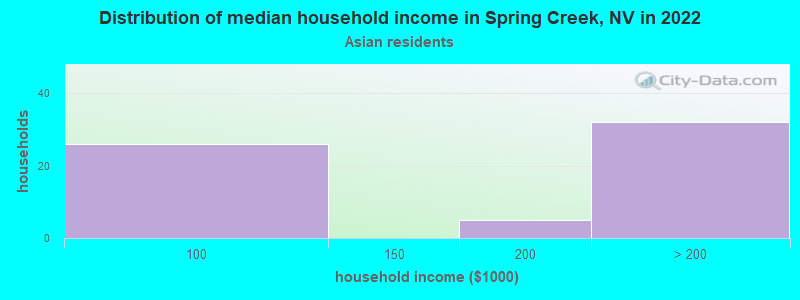
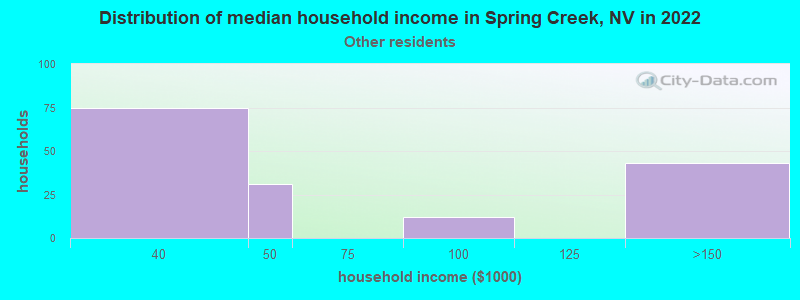
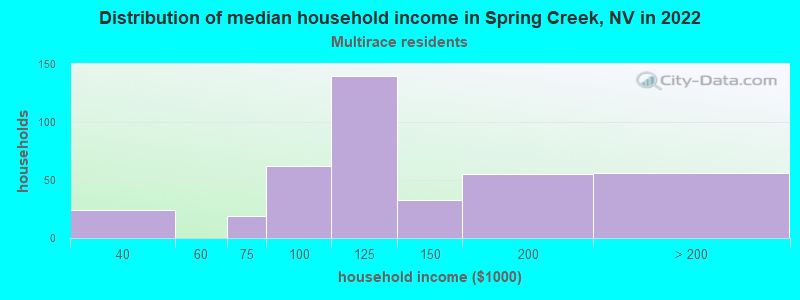
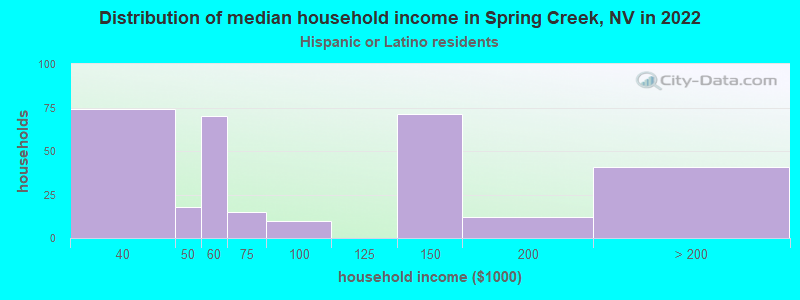
Income and house value in Spring Creek Median household income in 2022 $110,357 White non-Hispanic householders$170,513 Asian householders$41,289 Some other race householders$118,361 Two or more races householdersMedian 2022 house value $389,837 White Non-Hispanic householders$401,878 American Indian or Alaska Native householders $442,217 Asian householders$266,715 Some other race householders$338,661 Two or more races householders$395,256 Hispanic or Latino householders
Median age by race in Spring Creek
36.9 Median age for White residents37.0 35.6 -676,557,862.8 Median age for Black or African American residents-676,798,378.2 -676,356,588.5 50.8 Median age for American Indian / Alaska Native residents-660,984,847.8 -648,550,724.0 54.1 Median age for Asian residents-656,814,449.3 37.3 -690,618,761.8 Median age for Native Hawaiian / Pacific Islander residents-648,090,814.6 -725,146,198.1 21.2 Median age for Other race residents17.6 33.5 28.1 Median age for Two or more races residents35.8 24.3 35.7 Median age for White alone residents35.6 35.8 22.1 Median age for Hispanic or Latino residents21.4 22.4
Owner/renter occupied households by race in Spring Creek
House owners and renters - White residents 3,796 89.5% Owner occupied445 10.5% Renter occupiedHouse owners and renters - American Indian / Alaska Native residents 19 100.0% Owner occupiedHouse owners and renters - Asian residents 63 100.0% Owner occupiedHouse owners and renters - Other race residents 165 100.0% Owner occupiedHouse owners and renters - Two or more races residents 392 100.0% Owner occupiedHouse owners and renters - White alone residents 3,875 89.1% Owner occupied476 10.9% Renter occupiedHouse owners and renters - Hispanic or Latino residents 300 98.1% Owner occupied6 1.9% Renter occupied
Language usage in Spring Creek
English speakers - Total 93.7% of residents of Spring Creek speak English at home.
5.0% of residents speak Spanish at home 515 71.4% Speak English very well206 28.6% Speak English less than very well1.1% of residents speak other language at home 149 90.9% Speak English very well15 9.1% Speak English less than very well
English speakers - Born in the United States 96.3% of residents of Spring Creek speak English at home.
2.9% of residents speak Spanish at home 227 95.0% Speak English very well12 5.0% Speak English less than very well0.8% of residents speak other language at home 53 76.8% Speak English very well16 23.2% Speak English less than very well
English speakers - Native, born elsewhere 86.8% of residents of Spring Creek speak English at home.
6.0% of residents speak Spanish at home 16 100.0% Speak English very well
English speakers - Foreign-born 32.6% of residents of Spring Creek speak English at home.
51.0% of residents speak Spanish at home 115 50.0% Speak English very well115 50.0% Speak English less than very well16.4% of residents speak other language at home 74 100.0% Speak English very well
White (Caucasian) - Speak only English Native:
100.0% (11,331)Foreign-born:
96.4% (126)
White (Caucasian) - Speak another language Native:
1.2% (141)Foreign-born:
27.2% (36)
Asian - Speak another language Native:
84.8% (67)Foreign-born:
99.4% (62)
Other race - Speak another language Native:
25.0% (170)Foreign-born:
100.0% (152)
Two or more races - Speak another language Native:
21.9% (216)Foreign-born:
100.0% (47)
White alone - Speak only English Native:
98.7% (11,404)Foreign-born:
66.1% (92)
White alone - Speak another language Native:
1.3% (154)Foreign-born:
33.1% (46)
Hispanic or Latino - Speak only English Native:
72.8% (912)Foreign-born:
20.2% (49)
Hispanic or Latino - Speak another language Native:
27.7% (347)Foreign-born:
79.2% (193)
Foreign-born residents in Spring Creek 451 residents are foreign born (1.5% Latin America , 0.5% Europe , 0.5% Asia ).
This city:
2.9%Nevada:
19.1%
Marital status for residents in Spring Creek Marital status - White (Caucasian) population 15 years and over
Males 28.3% Never married58.0% Now married0.6% Separated3.7% Widowed9.4% DivorcedFemales 22.7% Never married60.9% Now married0.8% Separated5.8% Widowed9.8% DivorcedWomen who gave birth in the past 12 months Now married:
79.0% (86)Unmarried:
21.0% (23)
Women who did not give birth in the past 12 months Now married:
54.6% (1,402)Unmarried:
45.4% (1,164)
Marital status - American Indian / Alaska Native population 15 years and over
Males 0.0% Never married39.3% Now married0.0% Separated0.0% Widowed60.7% DivorcedFemales 0.0% Never married0.0% Now married100.0% Separated0.0% Widowed0.0% DivorcedWomen who did not give birth in the past 12 months Now married:
100.0% (17)Unmarried:
0.0% (0)
Marital status - Asian population 15 years and over
Males 0.0% Never married54.5% Now married0.0% Separated45.5% Widowed0.0% DivorcedFemales 44.2% Never married33.7% Now married0.0% Separated22.1% Widowed0.0% DivorcedWomen who did not give birth in the past 12 months Now married:
24.6% (17)Unmarried:
75.4% (52)
Marital status - Other race population 15 years and over
Males 63.5% Never married32.9% Now married0.0% Separated0.0% Widowed3.6% DivorcedFemales 13.8% Never married60.0% Now married8.0% Separated0.0% Widowed18.2% DivorcedWomen who gave birth in the past 12 months Now married:
100.0% (24)Unmarried:
0.0% (0)
Women who did not give birth in the past 12 months Now married:
55.0% (95)Unmarried:
45.0% (78)
Marital status - Two or more races population 15 years and over
Males 39.7% Never married30.1% Now married0.0% Separated0.0% Widowed30.1% DivorcedFemales 57.6% Never married39.7% Now married0.0% Separated0.0% Widowed2.8% DivorcedWomen who gave birth in the past 12 months Now married:
100.0% (15)Unmarried:
0.0% (0)
Women who did not give birth in the past 12 months Now married:
28.4% (116)Unmarried:
71.6% (293)
Marital status - White alone, not Hispanic / Latino population 15 years and over
Males 28.7% Never married57.3% Now married0.6% Separated3.9% Widowed9.5% DivorcedFemales 22.2% Never married62.0% Now married0.8% Separated5.9% Widowed9.0% DivorcedWomen who gave birth in the past 12 months Now married:
79.0% (95)Unmarried:
21.0% (25)
Women who did not give birth in the past 12 months Now married:
55.4% (1,534)Unmarried:
44.6% (1,233)
Marital status - Hispanic or Latino population 15 years and over
Males 43.9% Never married51.9% Now married0.0% Separated0.0% Widowed4.2% DivorcedFemales 33.7% Never married43.2% Now married3.6% Separated0.0% Widowed19.5% DivorcedWomen who gave birth in the past 12 months Now married:
100.0% (35)Unmarried:
0.0% (0)
Women who did not give birth in the past 12 months Now married:
40.8% (157)Unmarried:
59.2% (227)
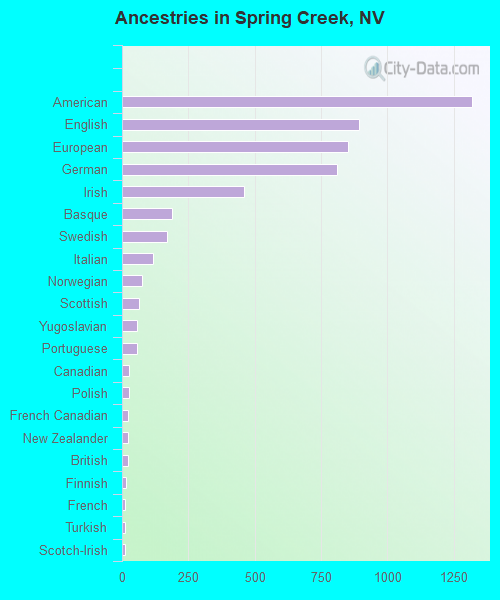
Ancestries in Spring Creek
1,317 19.0% American893 12.9% English851 12.3% European811 11.7% German460 6.6% Irish188 2.7% Basque169 2.4% Swedish116 1.7% Italian74 1.1% Norwegian65 0.9% Scottish57 0.8% Yugoslavian55 0.8% Portuguese27 0.4% Canadian26 0.4% Polish22 0.3% French Canadian22 0.3% New Zealander21 0.3% British16 0.2% Finnish13 0.2% French13 0.2% Turkish12 0.2% Scotch-Irish9 0.1% Danish8 0.1% Dutch7 0.1% Armenian6 0.09% Scandinavian5 0.07% Welsh
Geographical mobility in Spring Creek Same house 1 year ago 9,971 83.7% White (Caucasian)25 100.0% Black or African American52 100.0% American Indian / Alaska Native143 100.0% Asian871 100.0% Other race1,117 100.0% Two or more races10,349 83.1% White alone, not Hispanic / Latino1,611 99.7% Hispanic or LatinoMoved within same county 456 3.8% White / Caucasian14 1.7% Other race503 4.0% White alone, not Hispanic / Latino20 1.2% Hispanic or LatinoMoved within same state 238 2.0% White / Caucasian246 2.0% White alone, not Hispanic / LatinoMoved from different state 1,246 10.5% White / Caucasian1,297 10.4% White alone, not Hispanic / Latino26 1.6% Hispanic or LatinoMoved from abroad 75 0.6% White97 0.8% White alone, not Hispanic / Latino
Children Nativity (place of birth) in Spring Creek
Children under 6 years - Living with two parents Both parents native 904 100.0% NativeBoth parents foreign-born 18 100.0% NativeOne native, one foreign-born parent 61 100.0% NativeChildren under 6 years - Living with one parent Native parent 397 100.0% Native
Children 6 to 17 years - Living with two parents Both parents native 2,106 100.0% NativeBoth parents foreign-born 19 100.0% NativeOne native, one foreign-born parent 137 100.0% NativeChildren 6 to 17 years - Living with one parent Native parent 485 100.0% Native
Grandparents responsible for own grandchildren in Spring Creek
Grandparents (30 to 59 years) White / Caucasian 62 47.8% Responsible for grandchildren68 52.2% Not responsible for grandchildrenWhite alone, not Hispanic / Latino 86 52.9% Responsible for grandchildren76 47.1% Not responsible for grandchildrenGrandparents (60 years and over) White / Caucasian 10 13.4% Responsible for grandchildren64 86.6% Not responsible for grandchildrenWhite alone, not Hispanic / Latino 11 13.6% Responsible for grandchildren72 86.4% Not responsible for grandchildren