Races in Spokane, Washington (WA) Detailed Stats
Data:
Races - White alone (%)
Races - White alone (% change since 2000)
Races - Black alone (%)
Races - Black alone (% change since 2000)
Races - American Indian alone (%)
Races - American Indian alone (% change since 2000)
Races - Asian alone (%)
Races - Asian alone (% change since 2000)
Races - Hispanic (%)
Races - Hispanic (% change since 2000)
Races - Native Hawaiian and Other Pacific Islander alone (%)
Races - Native Hawaiian and Other Pacific Islander alone (% change since 2000)
Races - Two or more races(%)
Races - Two or more races(% change since 2000)
Races - Other race alone (%)
Races - Other race alone (% change since 2000)
Racial diversity
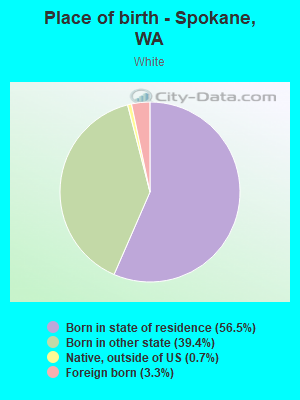
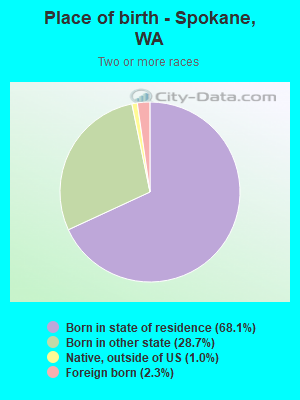
Place of birth - Born in state of residence (%)
Place of birth - Born in state of residence (%) - White
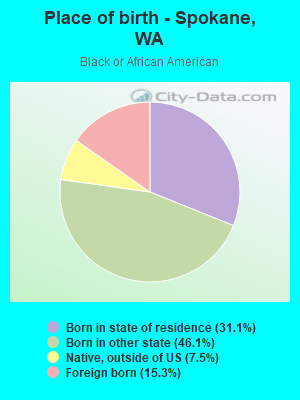
Place of birth - Born in state of residence (%) - Black or African American
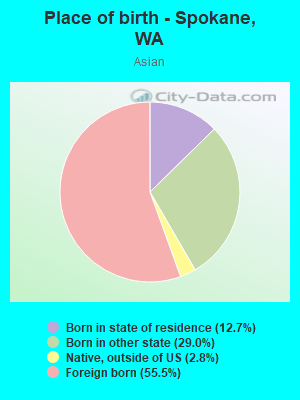
Place of birth - Born in state of residence (%) - Asian
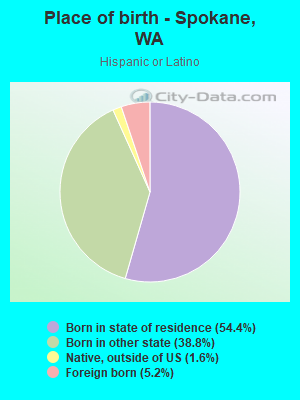
Place of birth - Born in state of residence (%) - Hispanic or Latino
Place of birth - Born in state of residence (%) - American Indian and Alaska Native
Place of birth - Born in state of residence (%) - Multirace
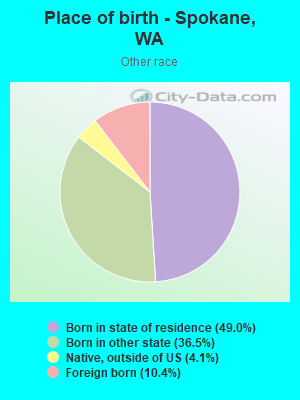
Place of birth - Born in state of residence (%) - Other Race
Place of birth - Born in other state (%)
Place of birth - Born in other state (%) - White
Place of birth - Born in other state (%) - Black or African American
Place of birth - Born in other state (%) - Asian
Place of birth - Born in other state (%) - Hispanic or Latino
Place of birth - Born in other state (%) - American Indian and Alaska Native
Place of birth - Born in other state (%) - Multirace
Place of birth - Born in other state (%) - Other Race
Place of birth - Native, outside of US (%)
Place of birth - Native, outside of US (%) - White
Place of birth - Native, outside of US (%) - Black or African American
Place of birth - Native, outside of US (%) - Asian
Place of birth - Native, outside of US (%) - Hispanic or Latino
Place of birth - Native, outside of US (%) - American Indian and Alaska Native
Place of birth - Native, outside of US (%) - Multirace
Place of birth - Native, outside of US (%) - Other Race
Place of birth - Foreign born (%)
Place of birth - Foreign born (%) - White
Place of birth - Foreign born (%) - Black or African American
Place of birth - Foreign born (%) - Asian
Place of birth - Foreign born (%) - Hispanic or Latino
Place of birth - Foreign born (%) - American Indian and Alaska Native
Place of birth - Foreign born (%) - Multirace
Place of birth - Foreign born (%) - Other Race
Residents speaking English at home (%)
Residents speaking English at home - Born in the United States (%)
Residents speaking English at home - Native, born elsewhere (%)
Residents speaking English at home - Foreign born (%)
Residents speaking Spanish at home (%)
Residents speaking Spanish at home - Born in the United States (%)
Residents speaking Spanish at home - Native, born elsewhere (%)
Residents speaking Spanish at home - Foreign born (%)
Residents speaking other language at home (%)
Residents speaking other language at home - Born in the United States (%)
Residents speaking other language at home - Native, born elsewhere (%)
Residents speaking other language at home - Foreign born (%)
Marital status - Never married (%)
Marital status - Now married (%)
Marital status - Separated (%)
Marital status - Widowed (%)
Marital status - Divorced (%)
Ancestries Reported - Arab (%)
Ancestries Reported - Czech (%)
Ancestries Reported - Danish (%)
Ancestries Reported - Dutch (%)
Ancestries Reported - English (%)
Ancestries Reported - French (%)
Ancestries Reported - French Canadian (%)
Ancestries Reported - German (%)
Ancestries Reported - Greek (%)
Ancestries Reported - Hungarian (%)
Ancestries Reported - Irish (%)
Ancestries Reported - Italian (%)
Ancestries Reported - Lithuanian (%)
Ancestries Reported - Norwegian (%)
Ancestries Reported - Polish (%)
Ancestries Reported - Portuguese (%)
Ancestries Reported - Russian (%)
Ancestries Reported - Scotch-Irish (%)
Ancestries Reported - Scottish (%)
Ancestries Reported - Slovak (%)
Ancestries Reported - Subsaharan African (%)
Ancestries Reported - Swedish (%)
Ancestries Reported - Swiss (%)
Ancestries Reported - Ukrainian (%)
Ancestries Reported - United States (%)
Ancestries Reported - Welsh (%)
Ancestries Reported - West Indian (%)
Ancestries Reported - Other (%)
Geographical mobility - Same house 1 year ago (%)
Geographical mobility - Same house 1 year ago (%) - White
Geographical mobility - Same house 1 year ago (%) - Black or African American
Geographical mobility - Same house 1 year ago (%) - Asian
Geographical mobility - Same house 1 year ago (%) - Hispanic or Latino
Geographical mobility - Same house 1 year ago (%) - American Indian and Alaska Native
Geographical mobility - Same house 1 year ago (%) - Multirace
Geographical mobility - Same house 1 year ago (%) - Other Race
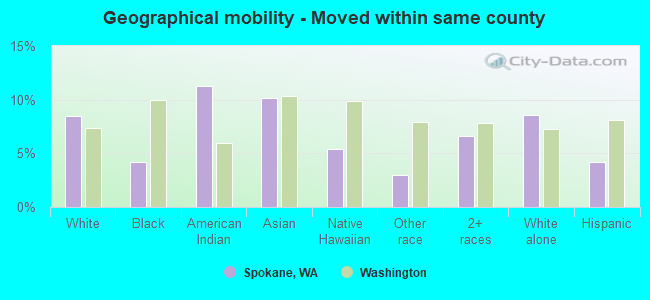
Geographical mobility - Moved within same county (%)
Geographical mobility - Moved within same county (%) - White
Geographical mobility - Moved within same county (%) - Black or African American
Geographical mobility - Moved within same county (%) - Asian
Geographical mobility - Moved within same county (%) - Hispanic or Latino
Geographical mobility - Moved within same county (%) - American Indian and Alaska Native
Geographical mobility - Moved within same county (%) - Multirace
Geographical mobility - Moved within same county (%) - Other Race
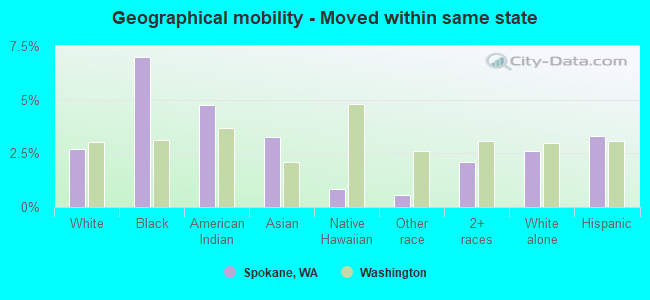
Geographical mobility - Moved from different county within same state (%)
Geographical mobility - Moved from different county within same state (%) - White
Geographical mobility - Moved from different county within same state (%) - Black or African American
Geographical mobility - Moved from different county within same state (%) - Asian
Geographical mobility - Moved from different county within same state (%) - Hispanic or Latino
Geographical mobility - Moved from different county within same state (%) - American Indian and Alaska Native
Geographical mobility - Moved from different county within same state (%) - Multirace
Geographical mobility - Moved from different county within same state (%) - Other Race
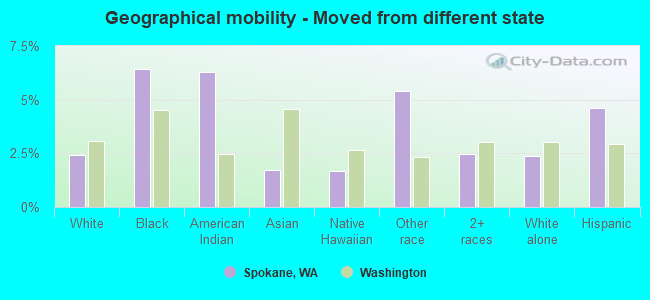
Geographical mobility - Moved from different state (%)
Geographical mobility - Moved from different state (%) - White
Geographical mobility - Moved from different state (%) - Black or African American
Geographical mobility - Moved from different state (%) - Asian
Geographical mobility - Moved from different state (%) - Hispanic or Latino
Geographical mobility - Moved from different state (%) - American Indian and Alaska Native
Geographical mobility - Moved from different state (%) - Multirace
Geographical mobility - Moved from different state (%) - Other Race
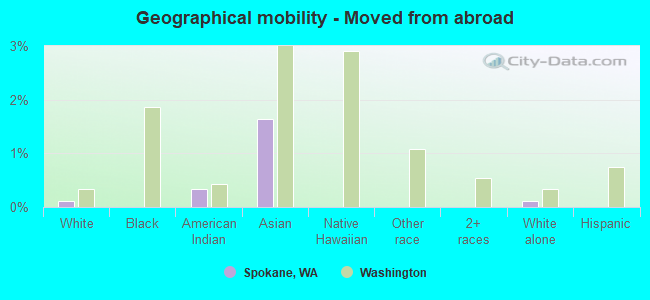
Geographical mobility - Moved from abroad (%)
Geographical mobility - Moved from abroad (%) - White
Geographical mobility - Moved from abroad (%) - Black or African American
Geographical mobility - Moved from abroad (%) - Asian
Geographical mobility - Moved from abroad (%) - Hispanic or Latino
Geographical mobility - Moved from abroad (%) - American Indian and Alaska Native
Geographical mobility - Moved from abroad (%) - Multirace
Geographical mobility - Moved from abroad (%) - Other Race
Place of birth for the foreign-born population - Ireland (%)
Place of birth for the foreign-born population - Denmark (%)
Place of birth for the foreign-born population - Norway (%)
Place of birth for the foreign-born population - Sweden (%)
Place of birth for the foreign-born population - United Kingdom (%)
Place of birth for the foreign-born population - England (%)
Place of birth for the foreign-born population - Scotland (%)
Place of birth for the foreign-born population - Other Northern Europe (%)
Place of birth for the foreign-born population - Austria (%)
Place of birth for the foreign-born population - Belgium (%)
Place of birth for the foreign-born population - France (%)
Place of birth for the foreign-born population - Germany (%)
Place of birth for the foreign-born population - Netherlands (%)
Place of birth for the foreign-born population - Switzerland (%)
Place of birth for the foreign-born population - Other Western Europe (%)
Place of birth for the foreign-born population - Greece (%)
Place of birth for the foreign-born population - Italy (%)
Place of birth for the foreign-born population - Portugal (%)
Place of birth for the foreign-born population - Spain (%)
Place of birth for the foreign-born population - Other Southern Europe (%)
Place of birth for the foreign-born population - Albania (%)
Place of birth for the foreign-born population - Belarus (%)
Place of birth for the foreign-born population - Bosnia and Herzegovina (%)
Place of birth for the foreign-born population - Bulgaria (%)
Place of birth for the foreign-born population - Croatia (%)
Place of birth for the foreign-born population - Czechoslovakia (%)
Place of birth for the foreign-born population - Hungary (%)
Place of birth for the foreign-born population - Latvia (%)
Place of birth for the foreign-born population - Lithuania (%)
Place of birth for the foreign-born population - North Macedonia (Macedonia) (%)
Place of birth for the foreign-born population - Moldova (%)
Place of birth for the foreign-born population - Poland (%)
Place of birth for the foreign-born population - Romania (%)
Place of birth for the foreign-born population - Russia (%)
Place of birth for the foreign-born population - Serbia (%)
Place of birth for the foreign-born population - Ukraine (%)
Place of birth for the foreign-born population - Other Eastern Europe (%)
Place of birth for the foreign-born population - China (%)
Place of birth for the foreign-born population - Hong Kong (%)
Place of birth for the foreign-born population - Taiwan (%)
Place of birth for the foreign-born population - Japan (%)
Place of birth for the foreign-born population - Korea (%)
Place of birth for the foreign-born population - Other Eastern Asia (%)
Place of birth for the foreign-born population - Afghanistan (%)
Place of birth for the foreign-born population - Bangladesh (%)
Place of birth for the foreign-born population - India (%)
Place of birth for the foreign-born population - Iran (%)
Place of birth for the foreign-born population - Kazakhstan (%)
Place of birth for the foreign-born population - Nepal (%)
Place of birth for the foreign-born population - Pakistan (%)
Place of birth for the foreign-born population - Sri Lanka (%)
Place of birth for the foreign-born population - Uzbekistan (%)
Place of birth for the foreign-born population - Other South Central Asia (%)
Place of birth for the foreign-born population - Burma (%)
Place of birth for the foreign-born population - Cambodia (%)
Place of birth for the foreign-born population - Indonesia (%)
Place of birth for the foreign-born population - Laos (%)
Place of birth for the foreign-born population - Malaysia (%)
Place of birth for the foreign-born population - Philippines (%)
Place of birth for the foreign-born population - Singapore (%)
Place of birth for the foreign-born population - Thailand (%)
Place of birth for the foreign-born population - Vietnam (%)
Place of birth for the foreign-born population - Other South Eastern Asia (%)
Place of birth for the foreign-born population - Armenia (%)
Place of birth for the foreign-born population - Iraq (%)
Place of birth for the foreign-born population - Israel (%)
Place of birth for the foreign-born population - Jordan (%)
Place of birth for the foreign-born population - Kuwait (%)
Place of birth for the foreign-born population - Lebanon (%)
Place of birth for the foreign-born population - Saudi Arabia (%)
Place of birth for the foreign-born population - Syria (%)
Place of birth for the foreign-born population - Turkey (%)
Place of birth for the foreign-born population - Yemen (%)
Place of birth for the foreign-born population - Other Western Asia (%)
Place of birth for the foreign-born population - Eritrea (%)
Place of birth for the foreign-born population - Ethiopia (%)
Place of birth for the foreign-born population - Kenya (%)
Place of birth for the foreign-born population - Somalia (%)
Place of birth for the foreign-born population - Uganda (%)
Place of birth for the foreign-born population - Zimbabwe (%)
Place of birth for the foreign-born population - Other Eastern Africa (%)
Place of birth for the foreign-born population - Cameroon (%)
Place of birth for the foreign-born population - Congo (%)
Place of birth for the foreign-born population - Democratic Republic of Congo (Zaire) (%)
Place of birth for the foreign-born population - Other Middle Africa (%)
Place of birth for the foreign-born population - Egypt (%)
Place of birth for the foreign-born population - Morocco (%)
Place of birth for the foreign-born population - Sudan (%)
Place of birth for the foreign-born population - Other Northern Africa (%)
Place of birth for the foreign-born population - South Africa (%)
Place of birth for the foreign-born population - Other Southern Africa (%)
Place of birth for the foreign-born population - Cabo Verde (%)
Place of birth for the foreign-born population - Ghana (%)
Place of birth for the foreign-born population - Liberia (%)
Place of birth for the foreign-born population - Nigeria (%)
Place of birth for the foreign-born population - Senegal (%)
Place of birth for the foreign-born population - Sierra Leone (%)
Place of birth for the foreign-born population - Other Western Africa (%)
Place of birth for the foreign-born population - Australia (%)
Place of birth for the foreign-born population - New Zealand (%)
Place of birth for the foreign-born population - Fiji (%)
Place of birth for the foreign-born population - Micronesia (%)
Place of birth for the foreign-born population - Bahamas (%)
Place of birth for the foreign-born population - Barbados (%)
Place of birth for the foreign-born population - Cuba (%)
Place of birth for the foreign-born population - Dominica (%)
Place of birth for the foreign-born population - Dominican Republic (%)
Place of birth for the foreign-born population - Grenada (%)
Place of birth for the foreign-born population - Haiti (%)
Place of birth for the foreign-born population - Jamaica (%)
Place of birth for the foreign-born population - St. Vincent and the Grenadines (%)
Place of birth for the foreign-born population - Trinidad and Tobago (%)
Place of birth for the foreign-born population - West Indies (%)
Place of birth for the foreign-born population - Other Caribbean (%)
Place of birth for the foreign-born population - Belize (%)
Place of birth for the foreign-born population - Costa Rica (%)
Place of birth for the foreign-born population - El Salvador (%)
Place of birth for the foreign-born population - Guatemala (%)
Place of birth for the foreign-born population - Honduras (%)
Place of birth for the foreign-born population - Mexico (%)
Place of birth for the foreign-born population - Nicaragua (%)
Place of birth for the foreign-born population - Panama (%)
Place of birth for the foreign-born population - Other Central America (%)
Place of birth for the foreign-born population - Argentina (%)
Place of birth for the foreign-born population - Bolivia (%)
Place of birth for the foreign-born population - Brazil (%)
Place of birth for the foreign-born population - Chile (%)
Place of birth for the foreign-born population - Colombia (%)
Place of birth for the foreign-born population - Ecuador (%)
Place of birth for the foreign-born population - Guyana (%)
Place of birth for the foreign-born population - Peru (%)
Place of birth for the foreign-born population - Uruguay (%)
Place of birth for the foreign-born population - Venezuela (%)
Place of birth for the foreign-born population - Other South America (%)
Place of birth for the foreign-born population - Canada (%)
Place of birth for the foreign-born population - Other Northern America (%)
Place of birth for the foreign-born population - Other (%)
Latest news about races in Spokane, WA collected exclusively by city-data.com from local newspapers, TV, and radio stations
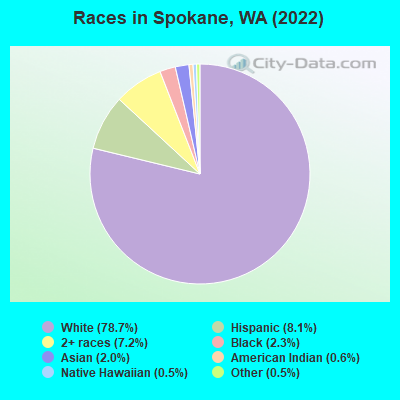
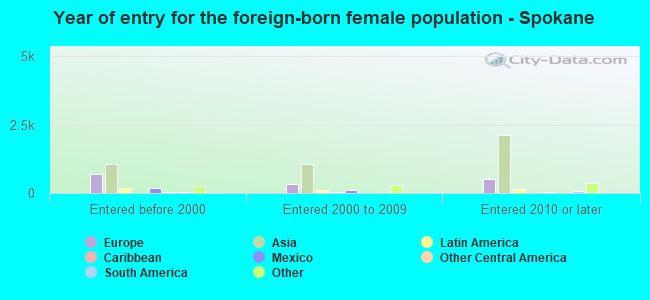
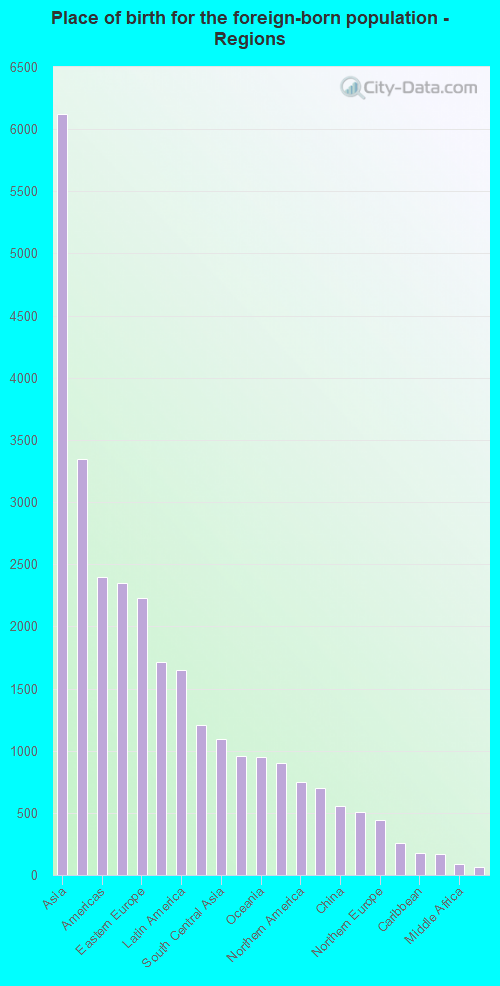
According to 2022 data, the most numerous races in Spokane, WA are White alone (181,263 residents), Hispanic (18,619 residents), and Asian alone (4,658 residents). 92.3% of Spokane residents speak English at home. 5.9% of Spokane, WA residents are foreign-born (2.6% born in Asia, 1.4% born in Europe, 0.7% born in Latin America), which is 154.3% less than the foreign-born rate of 15.0% across the entire state of Washington.
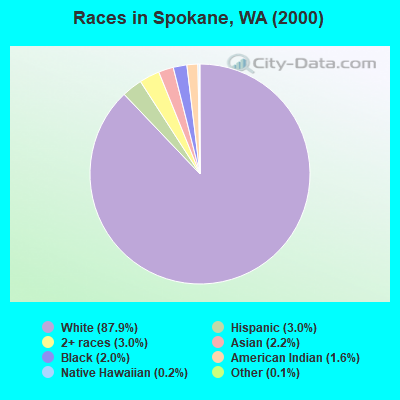
Race distribution in Spokane
2000 2022
171,918 87.9% White alone 5,857 3.0% Hispanic 5,772 3.0% Two or more races 4,343 2.2% Asian alone 3,898 2.0% Black alone 3,208 1.6% American Indian alone 348 0.2% Native Hawaiian and Other 285 0.1% Other race alone
181,263 78.7% White alone 18,619 8.1% Hispanic 16,669 7.2% Two or more races 5,389 2.3% Black alone 4,658 2.0% Asian alone 1,280 0.6% American Indian alone 1,240 0.5% Native Hawaiian and Other 1,058 0.5% Other race alone
2000 2022
4,652,490 78.9% White alone 441,509 7.5% Hispanic 319,401 5.4% Asian alone 184,631 3.1% Black alone 175,926 3.0% Two or more races 85,396 1.4% American Indian alone 22,779 0.4% Native Hawaiian and Other 11,989 0.2% Other race alone
4,941,456 63.5% White alone 1,093,313 14.0% Hispanic 755,832 9.7% Asian alone 523,448 6.7% Two or more races 299,537 3.8% Black alone 69,024 0.9% American Indian alone 52,231 0.7% Native Hawaiian and Other 50,945 0.7% Other race alone
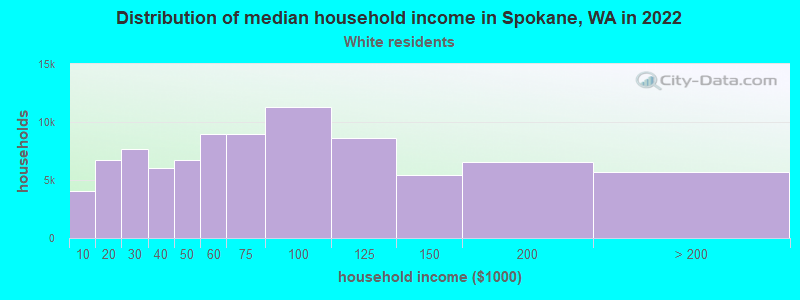
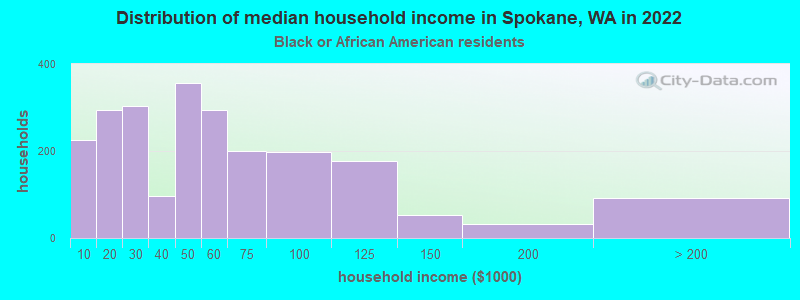
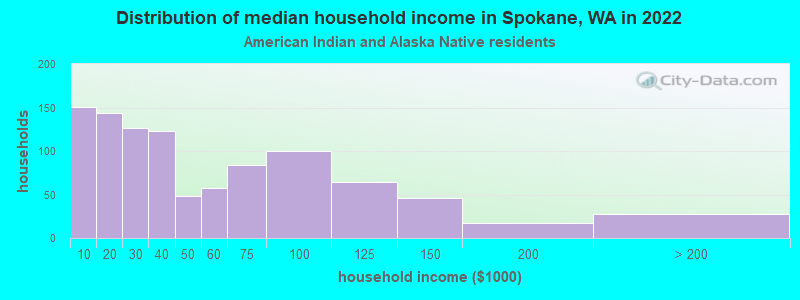
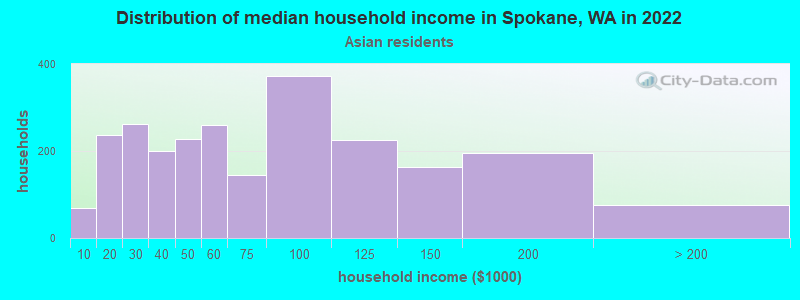
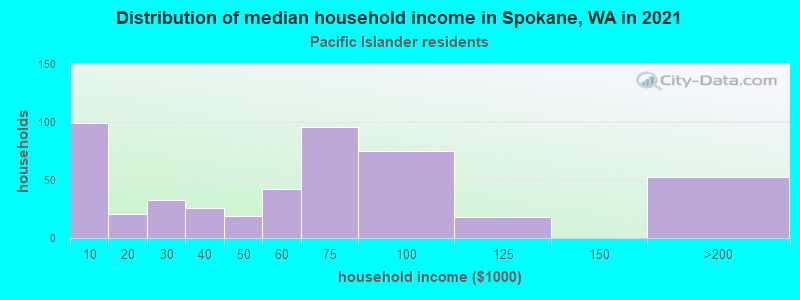
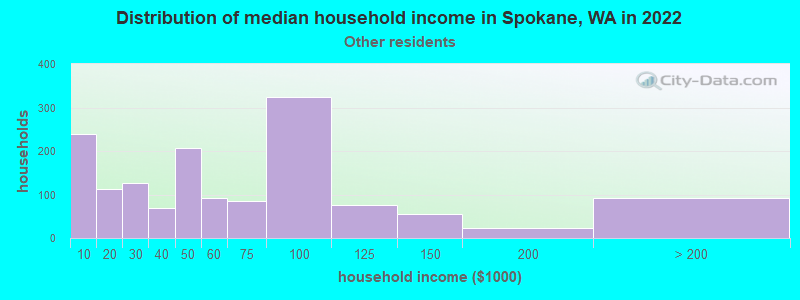
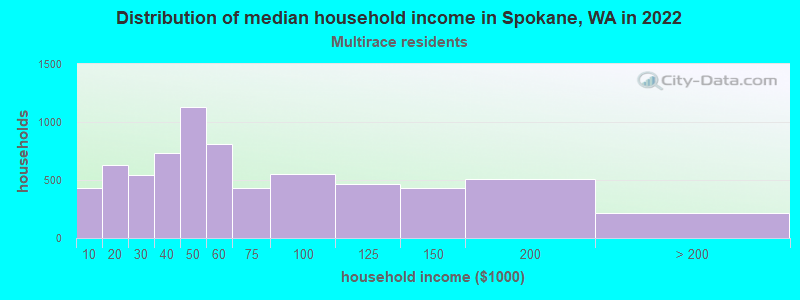
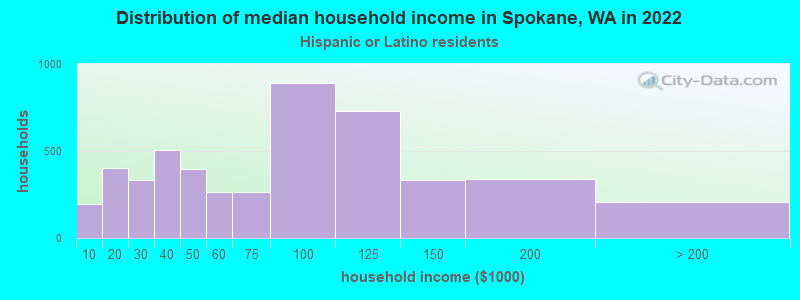
Income and house value in Spokane Median household income in 2022 $64,875 White non-Hispanic householders$50,338 Black householders$40,501 American Indian and Alaska Native householders$59,960 Asian householders$63,266 Native Hawaiian and other Pacific Islander householders$58,575 Some other race householders$49,540 Two or more races householders$59,083 Hispanic or Latino race householdersMedian 2022 house value $373,484 White Non-Hispanic householders$340,507 Black or African American householders$298,327 American Indian or Alaska Native householders $375,402 Asian householders$374,635 Native Hawaiian and other Pacific Islander householders$366,199 Some other race householders$343,575 Two or more races householders$383,454 Hispanic or Latino householders
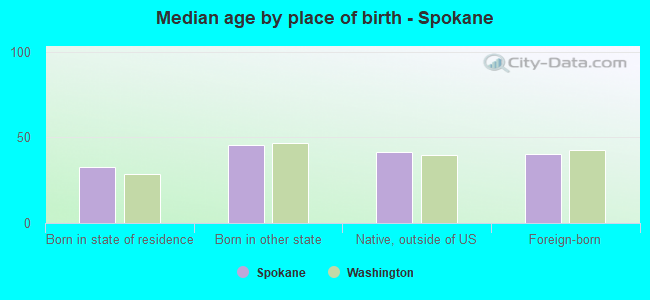
Median age by race in Spokane
41.3 Median age for White residents39.9 42.8 33.0 Median age for Black or African American residents34.5 31.9 32.5 Median age for American Indian / Alaska Native residents41.0 26.5 37.1 Median age for Asian residents26.9 46.9 32.8 Median age for Native Hawaiian / Pacific Islander residents38.5 32.3 30.8 Median age for Other race residents33.1 29.7 23.9 Median age for Two or more races residents24.8 23.0 41.8 Median age for White alone residents40.9 43.2 25.7 Median age for Hispanic or Latino residents24.3 27.1
Owner/renter occupied households by race in Spokane
House owners and renters - White residents 53,786 62.1% Owner occupied32,850 37.9% Renter occupiedHouse owners and renters - Black or African American residents 969 37.9% Owner occupied1,590 62.1% Renter occupiedHouse owners and renters - American Indian / Alaska Native residents 146 21.7% Owner occupied526 78.3% Renter occupiedHouse owners and renters - Asian residents 1,454 64.2% Owner occupied810 35.8% Renter occupiedHouse owners and renters - Native Hawaiian / Pacific Islander residents 129 21.7% Owner occupied467 78.3% Renter occupiedHouse owners and renters - Other race residents 476 28.8% Owner occupied1,179 71.2% Renter occupiedHouse owners and renters - Two or more races residents 3,554 51.6% Owner occupied3,329 48.4% Renter occupiedHouse owners and renters - White alone residents 53,223 62.5% Owner occupied31,923 37.5% Renter occupiedHouse owners and renters - Hispanic or Latino residents 1,793 39.7% Owner occupied2,718 60.3% Renter occupied
Language usage in Spokane
English speakers - Total 92.3% of residents of Spokane speak English at home.
2.9% of residents speak Spanish at home 3,685 58.3% Speak English very well2,636 41.7% Speak English less than very well4.8% of residents speak other language at home 5,451 51.5% Speak English very well5,141 48.5% Speak English less than very well
English speakers - Born in the United States 95.0% of residents of Spokane speak English at home.
3.8% of residents speak Spanish at home 1,337 40.5% Speak English very well1,968 59.5% Speak English less than very well1.2% of residents speak other language at home 773 74.9% Speak English very well259 25.1% Speak English less than very well
English speakers - Native, born elsewhere 90.3% of residents of Spokane speak English at home.
5.6% of residents speak Spanish at home 150 100.0% Speak English very well4.1% of residents speak other language at home 59 54.6% Speak English very well49 45.4% Speak English less than very well
English speakers - Foreign-born 29.1% of residents of Spokane speak English at home.
6.5% of residents speak Spanish at home 336 46.0% Speak English very well394 54.0% Speak English less than very well64.4% of residents speak other language at home 2,465 34.0% Speak English very well4,787 66.0% Speak English less than very well
White (Caucasian) - Speak only English Native:
97.8% (169,123)Foreign-born:
34.6% (2,116)
White (Caucasian) - Speak another language Native:
2.2% (3,791)Foreign-born:
65.4% (3,993)
Black or African American - Speak only English Native:
99.1% (4,857)Foreign-born:
41.4% (397)
Black or African American - Speak another language Native:
2.2% (107)Foreign-born:
61.1% (586)
American Indian / Alaska Native - Speak only English Native:
87.8% (2,525)Foreign-born:
27.8% (43)
American Indian / Alaska Native - Speak another language Native:
11.5% (330)Foreign-born:
61.9% (95)
Asian - Speak only English Native:
88.8% (1,694)Foreign-born:
18.8% (457)
Asian - Speak another language Native:
11.2% (213)Foreign-born:
81.2% (1,977)
Native Hawaiian / Pacific Islander - Speak only English Native:
74.4% (698)Foreign-born:
4.5% (38)
Native Hawaiian / Pacific Islander - Speak another language Native:
25.6% (240)Foreign-born:
100.0% (848)
Other race - Speak only English Native:
46.9% (2,541)Foreign-born:
25.8% (181)
Other race - Speak another language Native:
53.1% (2,882)Foreign-born:
74.2% (521)
Two or more races - Speak only English Native:
92.3% (19,162)Foreign-born:
9.1% (50)
Two or more races - Speak another language Native:
7.7% (1,600)Foreign-born:
90.9% (497)
White alone - Speak only English Native:
98.0% (165,565)Foreign-born:
35.6% (2,116)
White alone - Speak another language Native:
2.0% (3,407)Foreign-born:
64.4% (3,836)
Hispanic or Latino - Speak only English Native:
75.6% (11,810)Foreign-born:
18.9% (181)
Hispanic or Latino - Speak another language Native:
24.4% (3,812)Foreign-born:
81.1% (779)
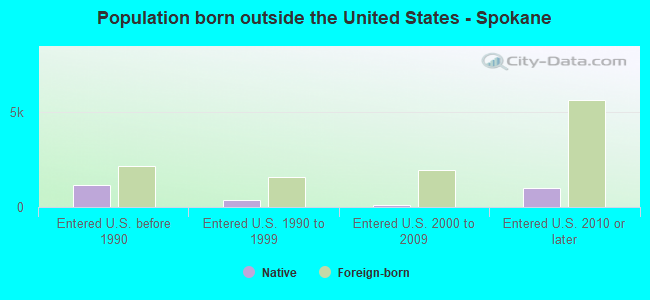
Foreign-born residents in Spokane 13,716 residents are foreign born (2.6% Asia , 1.4% Europe , 0.7% Latin America ).
This city:
5.9%Washington:
14.9%
Marital status for residents in Spokane Marital status - White (Caucasian) population 15 years and over
Males 39.2% Never married42.4% Now married1.0% Separated4.1% Widowed13.4% DivorcedFemales 29.8% Never married42.0% Now married0.7% Separated9.6% Widowed17.9% DivorcedWomen who gave birth in the past 12 months Now married:
75.8% (1,304)Unmarried:
24.2% (417)
Women who did not give birth in the past 12 months Now married:
41.4% (18,291)Unmarried:
58.6% (25,914)
Marital status - Black or African American population 15 years and over
Males 45.4% Never married19.6% Now married5.0% Separated9.7% Widowed20.3% DivorcedFemales 59.8% Never married19.7% Now married3.7% Separated4.1% Widowed12.7% DivorcedWomen who gave birth in the past 12 months Now married:
74.6% (50)Unmarried:
25.4% (17)
Women who did not give birth in the past 12 months Now married:
28.1% (404)Unmarried:
71.9% (1,034)
Marital status - American Indian / Alaska Native population 15 years and over
Males 58.3% Never married25.2% Now married2.2% Separated1.9% Widowed12.4% DivorcedFemales 47.1% Never married25.5% Now married0.0% Separated8.9% Widowed18.5% DivorcedWomen who gave birth in the past 12 months Now married:
35.4% (33)Unmarried:
64.6% (60)
Women who did not give birth in the past 12 months Now married:
20.6% (137)Unmarried:
79.4% (529)
Marital status - Asian population 15 years and over
Males 43.4% Never married48.7% Now married0.0% Separated1.4% Widowed6.5% DivorcedFemales 32.1% Never married42.7% Now married1.8% Separated11.6% Widowed11.8% DivorcedWomen who gave birth in the past 12 months Now married:
100.0% (65)Unmarried:
0.0% (0)
Women who did not give birth in the past 12 months Now married:
44.3% (790)Unmarried:
55.7% (993)
Marital status - Native Hawaiian / Pacific Islander population 15 years and over
Males 43.4% Never married41.0% Now married0.0% Separated9.0% Widowed6.6% DivorcedFemales 48.2% Never married26.5% Now married0.1% Separated12.7% Widowed12.5% DivorcedWomen who gave birth in the past 12 months Now married:
0.0% (0)Unmarried:
100.0% (33)
Women who did not give birth in the past 12 months Now married:
24.1% (136)Unmarried:
75.9% (430)
Marital status - Other race population 15 years and over
Males 44.8% Never married42.6% Now married5.2% Separated0.0% Widowed7.4% DivorcedFemales 29.0% Never married21.2% Now married26.6% Separated0.0% Widowed23.1% DivorcedWomen who gave birth in the past 12 months Now married:
100.0% (14)Unmarried:
0.0% (0)
Women who did not give birth in the past 12 months Now married:
29.6% (343)Unmarried:
70.4% (815)
Marital status - Two or more races population 15 years and over
Males 49.2% Never married36.6% Now married2.2% Separated2.4% Widowed9.7% DivorcedFemales 45.2% Never married33.1% Now married1.6% Separated4.6% Widowed15.5% DivorcedWomen who gave birth in the past 12 months Now married:
95.2% (177)Unmarried:
4.8% (9)
Women who did not give birth in the past 12 months Now married:
26.5% (1,782)Unmarried:
73.5% (4,936)
Marital status - White alone, not Hispanic / Latino population 15 years and over
Males 39.0% Never married42.2% Now married1.0% Separated4.1% Widowed13.6% DivorcedFemales 29.8% Never married42.1% Now married0.7% Separated9.8% Widowed17.7% DivorcedWomen who gave birth in the past 12 months Now married:
74.6% (1,225)Unmarried:
25.4% (417)
Women who did not give birth in the past 12 months Now married:
41.3% (17,722)Unmarried:
58.7% (25,197)
Marital status - Hispanic or Latino population 15 years and over
Males 46.6% Never married42.5% Now married4.8% Separated0.9% Widowed5.3% DivorcedFemales 39.0% Never married32.6% Now married8.0% Separated1.8% Widowed18.7% DivorcedWomen who gave birth in the past 12 months Now married:
95.0% (171)Unmarried:
5.0% (9)
Women who did not give birth in the past 12 months Now married:
37.9% (1,633)Unmarried:
62.1% (2,671)
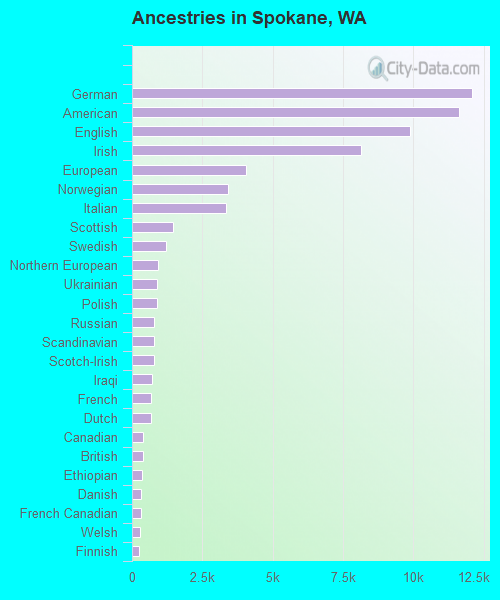
Ancestries in Spokane
12,087 12.7% German11,642 12.3% American9,868 10.4% English8,158 8.6% Irish4,049 4.3% European3,417 3.6% Norwegian3,324 3.5% Italian1,470 1.5% Scottish1,219 1.3% Swedish913 1.0% Northern European881 0.9% Ukrainian875 0.9% Polish790 0.8% Russian786 0.8% Scandinavian779 0.8% Scotch-Irish700 0.7% Iraqi673 0.7% French664 0.7% Dutch394 0.4% Canadian379 0.4% British368 0.4% Ethiopian313 0.3% Danish310 0.3% French Canadian274 0.3% Welsh265 0.3% Finnish234 0.2% Romanian212 0.2% Hungarian189 0.2% African186 0.2% Greek176 0.2% Czech155 0.2% Austrian148 0.2% Swiss136 0.1% Macedonian127 0.1% Turkish114 0.1% Yugoslavian113 0.1% Portuguese103 0.1% Eastern European100 0.1% Brazilian99 0.1% Jamaican96 0.1% Slovene96 0.1% Ugandan91 0.10% Afghan76 0.08% Icelander72 0.08% Croatian70 0.07% Nigerian70 0.07% Lithuanian65 0.07% Syrian44 0.05% Iranian41 0.04% Czechoslovakian38 0.04% Armenian28 0.03% Arab25 0.03% Ghanaian25 0.03% Basque25 0.03% British West Indian25 0.03% Belgian23 0.02% Slovak22 0.02% Slavic17 0.02% German Russian17 0.02% Kenyan16 0.02% Sudanese12 0.01% Celtic9 0.01% Luxembourger8 0.01% Bahamian7 0.01% Serbian5 0.01% Bulgarian
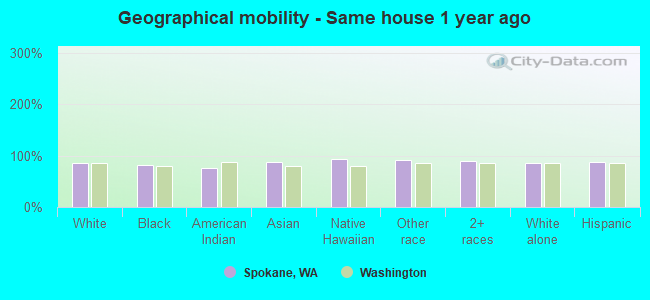
Geographical mobility in Spokane Same house 1 year ago 159,389 86.3% White (Caucasian)4,622 82.3% Black or African American2,349 75.9% American Indian / Alaska Native5,673 86.9% Asian1,902 93.2% Native Hawaiian / Pacific Islander6,127 91.0% Other race21,297 88.8% Two or more races155,587 86.3% White alone, not Hispanic / Latino16,214 87.9% Hispanic or LatinoMoved within same county 15,677 8.5% White / Caucasian236 4.2% Black or African American349 11.3% American Indian / Alaska Native662 10.1% Asian111 5.4% Native Hawaiian / Pacific Islander203 3.0% Other race1,591 6.6% Two or more races15,470 8.6% White alone, not Hispanic / Latino774 4.2% Hispanic or LatinoMoved within same state 4,961 2.7% White / Caucasian393 7.0% Black or African American147 4.8% American Indian / Alaska Native213 3.3% Asian17 0.9% Native Hawaiian / Pacific Islander38 0.6% Other race501 2.1% Two or more races4,709 2.6% White alone, not Hispanic / Latino614 3.3% Hispanic or LatinoMoved from different state 4,492 2.4% White / Caucasian362 6.4% Black or African American195 6.3% American Indian / Alaska Native113 1.7% Asian34 1.7% Native Hawaiian / Pacific Islander363 5.4% Other race590 2.5% Two or more races4,300 2.4% White alone, not Hispanic / Latino853 4.6% Hispanic or LatinoMoved from abroad 215 0.1% White10 0.3% American Indian / Alaska Native107 1.6% Asian215 0.1% White alone, not Hispanic / Latino
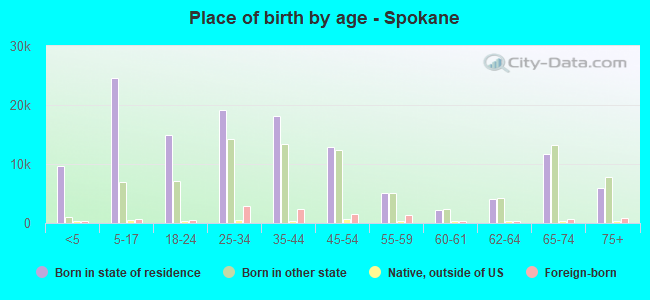
Children Nativity (place of birth) in Spokane
Children under 6 years - Living with two parents Both parents native 7,660 100.0% NativeBoth parents foreign-born 267 63.7% Native152 36.3% Foreign-bornOne native, one foreign-born parent 445 100.0% NativeChildren under 6 years - Living with one parent Native parent 4,528 100.0% NativeChildren 6 to 17 years - Living with two parents Both parents native 15,437 99.7% Native47 0.3% Foreign-bornBoth parents foreign-born 531 52.7% Native477 47.3% Foreign-bornOne native, one foreign-born parent 707 100.0% NativeChildren 6 to 17 years - Living with one parent Native parent 9,857 100.0% NativeForeign-born parent 825 52.2% Native755 47.8% Foreign-born
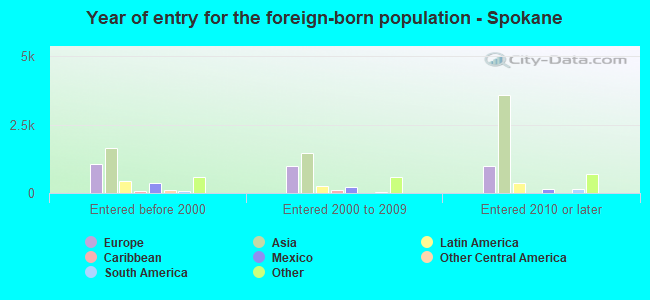
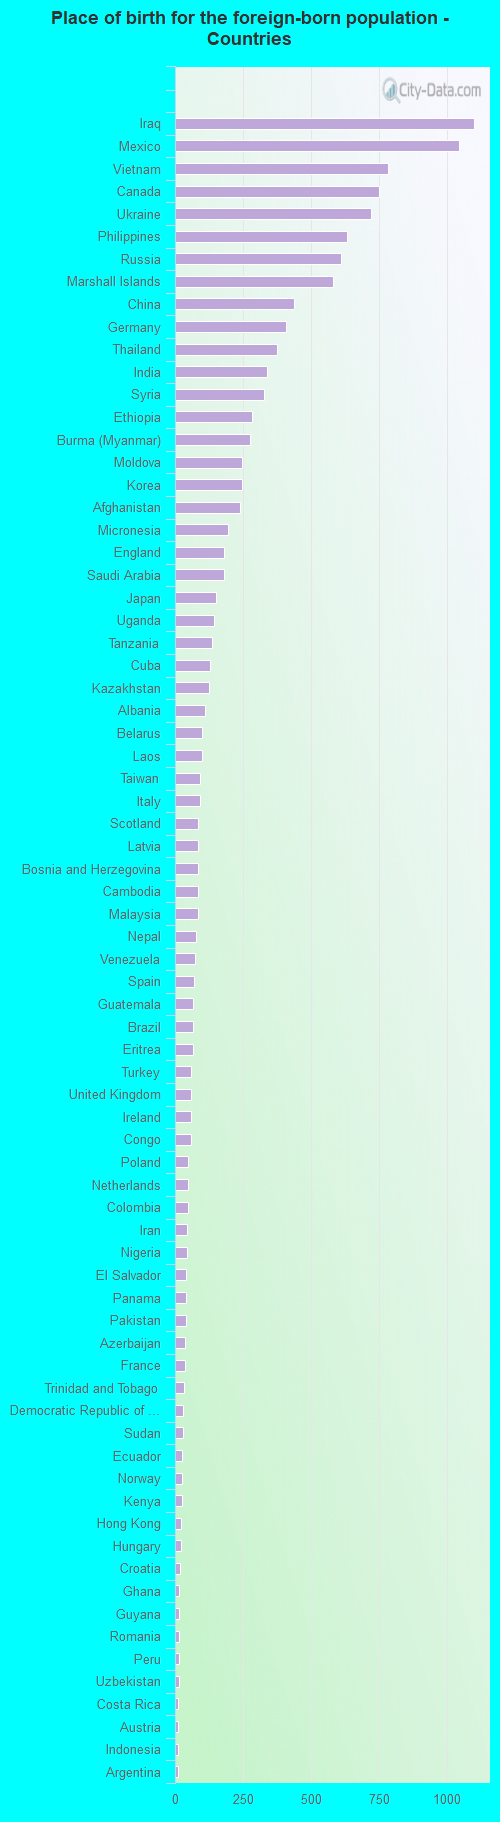
Place of birth for residents in Spokane 6,120 Asia3,345 Europe2,401 Americas2,350 South Eastern Asia2,227 Eastern Europe1,714 Western Asia1,651 Latin America1,210 Central America1,095 South Central Asia959 Eastern Asia946 Oceania902 Africa750 Northern America703 Eastern Africa556 China504 Western Europe444 Northern Europe259 South America180 Caribbean169 Southern Europe88 Middle Africa68 Western Africa30 Northern Africa10 Australia and New Zealand Subregion1,101 Iraq1,044 Mexico783 Vietnam750 Canada720 Ukraine635 Philippines613 Russia583 Marshall Islands439 China407 Germany376 Thailand338 India326 Syria285 Ethiopia277 Burma (Myanmar)248 Moldova247 Korea238 Afghanistan196 Micronesia180 England180 Saudi Arabia150 Japan145 Uganda135 Tanzania128 Cuba126 Kazakhstan109 Albania101 Belarus100 Laos92 Taiwan91 Italy86 Scotland85 Latvia83 Bosnia and Herzegovina83 Cambodia83 Malaysia77 Nepal75 Venezuela69 Spain67 Guatemala66 Brazil65 Eritrea60 Turkey60 United Kingdom58 Ireland58 Congo49 Poland48 Netherlands47 Colombia46 Iran44 Nigeria42 El Salvador40 Panama39 Pakistan38 Azerbaijan36 France33 Trinidad and Tobago30 Democratic Republic of Congo (Zaire)29 Sudan27 Ecuador25 Norway24 Kenya23 Hong Kong23 Hungary19 Croatia16 Ghana16 Guyana14 Romania14 Peru14 Uzbekistan12 Costa Rica11 Austria11 Indonesia11 Argentina9 Denmark9 Zimbabwe9 Bahamas9 Jamaica8 Greece7 Armenia7 Liberia5 Australia5 New Zealand4 Sweden3 Honduras1 Egypt
Grandparents responsible for own grandchildren in Spokane
Grandparents (30 to 59 years) White / Caucasian 279 37.2% Responsible for grandchildren471 62.8% Not responsible for grandchildrenBlack or African American 19 21.7% Responsible for grandchildren70 78.3% Not responsible for grandchildrenAmerican Indian / Alaska Native 9 92.8% Responsible for grandchildren1 7.2% Not responsible for grandchildrenAsian 70 100.0% Not responsible for grandchildrenNative Hawaiian / Pacific Islander 33 100.0% Not responsible for grandchildrenOther race 19 100.0% Responsible for grandchildrenTwo or more races 52 25.6% Responsible for grandchildren152 74.4% Not responsible for grandchildrenWhite alone, not Hispanic / Latino 279 37.2% Responsible for grandchildren471 62.8% Not responsible for grandchildrenHispanic or Latino 113 84.2% Responsible for grandchildren21 15.8% Not responsible for grandchildrenGrandparents (60 years and over) White / Caucasian 215 14.7% Responsible for grandchildren1,248 85.3% Not responsible for grandchildrenBlack or African American 56 51.6% Responsible for grandchildren53 48.4% Not responsible for grandchildrenAsian 64 100.0% Not responsible for grandchildrenNative Hawaiian / Pacific Islander 8 4.4% Responsible for grandchildren181 95.6% Not responsible for grandchildrenOther race 11 9.6% Responsible for grandchildren104 90.4% Not responsible for grandchildrenTwo or more races 43 42.6% Responsible for grandchildren58 57.4% Not responsible for grandchildrenWhite alone, not Hispanic / Latino 215 15.7% Responsible for grandchildren1,154 84.3% Not responsible for grandchildrenHispanic or Latino 24 12.6% Responsible for grandchildren167 87.4% Not responsible for grandchildren