Races in Sparks, Nevada (NV) Detailed Stats
Data:
Races - White alone (%)
Races - White alone (% change since 2000)
Races - Black alone (%)
Races - Black alone (% change since 2000)
Races - American Indian alone (%)
Races - American Indian alone (% change since 2000)
Races - Asian alone (%)
Races - Asian alone (% change since 2000)
Races - Hispanic (%)
Races - Hispanic (% change since 2000)
Races - Native Hawaiian and Other Pacific Islander alone (%)
Races - Native Hawaiian and Other Pacific Islander alone (% change since 2000)
Races - Two or more races(%)
Races - Two or more races(% change since 2000)
Races - Other race alone (%)
Races - Other race alone (% change since 2000)
Racial diversity
Place of birth - Born in state of residence (%)
Place of birth - Born in state of residence (%) - White
Place of birth - Born in state of residence (%) - Black or African American
Place of birth - Born in state of residence (%) - Asian
Place of birth - Born in state of residence (%) - Hispanic or Latino
Place of birth - Born in state of residence (%) - American Indian and Alaska Native
Place of birth - Born in state of residence (%) - Multirace
Place of birth - Born in state of residence (%) - Other Race
Place of birth - Born in other state (%)
Place of birth - Born in other state (%) - White
Place of birth - Born in other state (%) - Black or African American
Place of birth - Born in other state (%) - Asian
Place of birth - Born in other state (%) - Hispanic or Latino
Place of birth - Born in other state (%) - American Indian and Alaska Native
Place of birth - Born in other state (%) - Multirace
Place of birth - Born in other state (%) - Other Race
Place of birth - Native, outside of US (%)
Place of birth - Native, outside of US (%) - White
Place of birth - Native, outside of US (%) - Black or African American
Place of birth - Native, outside of US (%) - Asian
Place of birth - Native, outside of US (%) - Hispanic or Latino
Place of birth - Native, outside of US (%) - American Indian and Alaska Native
Place of birth - Native, outside of US (%) - Multirace
Place of birth - Native, outside of US (%) - Other Race
Place of birth - Foreign born (%)
Place of birth - Foreign born (%) - White
Place of birth - Foreign born (%) - Black or African American
Place of birth - Foreign born (%) - Asian
Place of birth - Foreign born (%) - Hispanic or Latino
Place of birth - Foreign born (%) - American Indian and Alaska Native
Place of birth - Foreign born (%) - Multirace
Place of birth - Foreign born (%) - Other Race
Residents speaking English at home (%)
Residents speaking English at home - Born in the United States (%)
Residents speaking English at home - Native, born elsewhere (%)
Residents speaking English at home - Foreign born (%)
Residents speaking Spanish at home (%)
Residents speaking Spanish at home - Born in the United States (%)
Residents speaking Spanish at home - Native, born elsewhere (%)
Residents speaking Spanish at home - Foreign born (%)
Residents speaking other language at home (%)
Residents speaking other language at home - Born in the United States (%)
Residents speaking other language at home - Native, born elsewhere (%)
Residents speaking other language at home - Foreign born (%)
Marital status - Never married (%)
Marital status - Now married (%)
Marital status - Separated (%)
Marital status - Widowed (%)
Marital status - Divorced (%)
Ancestries Reported - Arab (%)
Ancestries Reported - Czech (%)
Ancestries Reported - Danish (%)
Ancestries Reported - Dutch (%)
Ancestries Reported - English (%)
Ancestries Reported - French (%)
Ancestries Reported - French Canadian (%)
Ancestries Reported - German (%)
Ancestries Reported - Greek (%)
Ancestries Reported - Hungarian (%)
Ancestries Reported - Irish (%)
Ancestries Reported - Italian (%)
Ancestries Reported - Lithuanian (%)
Ancestries Reported - Norwegian (%)
Ancestries Reported - Polish (%)
Ancestries Reported - Portuguese (%)
Ancestries Reported - Russian (%)
Ancestries Reported - Scotch-Irish (%)
Ancestries Reported - Scottish (%)
Ancestries Reported - Slovak (%)
Ancestries Reported - Subsaharan African (%)
Ancestries Reported - Swedish (%)
Ancestries Reported - Swiss (%)
Ancestries Reported - Ukrainian (%)
Ancestries Reported - United States (%)
Ancestries Reported - Welsh (%)
Ancestries Reported - West Indian (%)
Ancestries Reported - Other (%)
Geographical mobility - Same house 1 year ago (%)
Geographical mobility - Same house 1 year ago (%) - White
Geographical mobility - Same house 1 year ago (%) - Black or African American
Geographical mobility - Same house 1 year ago (%) - Asian
Geographical mobility - Same house 1 year ago (%) - Hispanic or Latino
Geographical mobility - Same house 1 year ago (%) - American Indian and Alaska Native
Geographical mobility - Same house 1 year ago (%) - Multirace
Geographical mobility - Same house 1 year ago (%) - Other Race
Geographical mobility - Moved within same county (%)
Geographical mobility - Moved within same county (%) - White
Geographical mobility - Moved within same county (%) - Black or African American
Geographical mobility - Moved within same county (%) - Asian
Geographical mobility - Moved within same county (%) - Hispanic or Latino
Geographical mobility - Moved within same county (%) - American Indian and Alaska Native
Geographical mobility - Moved within same county (%) - Multirace
Geographical mobility - Moved within same county (%) - Other Race
Geographical mobility - Moved from different county within same state (%)
Geographical mobility - Moved from different county within same state (%) - White
Geographical mobility - Moved from different county within same state (%) - Black or African American
Geographical mobility - Moved from different county within same state (%) - Asian
Geographical mobility - Moved from different county within same state (%) - Hispanic or Latino
Geographical mobility - Moved from different county within same state (%) - American Indian and Alaska Native
Geographical mobility - Moved from different county within same state (%) - Multirace
Geographical mobility - Moved from different county within same state (%) - Other Race
Geographical mobility - Moved from different state (%)
Geographical mobility - Moved from different state (%) - White
Geographical mobility - Moved from different state (%) - Black or African American
Geographical mobility - Moved from different state (%) - Asian
Geographical mobility - Moved from different state (%) - Hispanic or Latino
Geographical mobility - Moved from different state (%) - American Indian and Alaska Native
Geographical mobility - Moved from different state (%) - Multirace
Geographical mobility - Moved from different state (%) - Other Race
Geographical mobility - Moved from abroad (%)
Geographical mobility - Moved from abroad (%) - White
Geographical mobility - Moved from abroad (%) - Black or African American
Geographical mobility - Moved from abroad (%) - Asian
Geographical mobility - Moved from abroad (%) - Hispanic or Latino
Geographical mobility - Moved from abroad (%) - American Indian and Alaska Native
Geographical mobility - Moved from abroad (%) - Multirace
Geographical mobility - Moved from abroad (%) - Other Race
Place of birth for the foreign-born population - Ireland (%)
Place of birth for the foreign-born population - Denmark (%)
Place of birth for the foreign-born population - Norway (%)
Place of birth for the foreign-born population - Sweden (%)
Place of birth for the foreign-born population - United Kingdom (%)
Place of birth for the foreign-born population - England (%)
Place of birth for the foreign-born population - Scotland (%)
Place of birth for the foreign-born population - Other Northern Europe (%)
Place of birth for the foreign-born population - Austria (%)
Place of birth for the foreign-born population - Belgium (%)
Place of birth for the foreign-born population - France (%)
Place of birth for the foreign-born population - Germany (%)
Place of birth for the foreign-born population - Netherlands (%)
Place of birth for the foreign-born population - Switzerland (%)
Place of birth for the foreign-born population - Other Western Europe (%)
Place of birth for the foreign-born population - Greece (%)
Place of birth for the foreign-born population - Italy (%)
Place of birth for the foreign-born population - Portugal (%)
Place of birth for the foreign-born population - Spain (%)
Place of birth for the foreign-born population - Other Southern Europe (%)
Place of birth for the foreign-born population - Albania (%)
Place of birth for the foreign-born population - Belarus (%)
Place of birth for the foreign-born population - Bosnia and Herzegovina (%)
Place of birth for the foreign-born population - Bulgaria (%)
Place of birth for the foreign-born population - Croatia (%)
Place of birth for the foreign-born population - Czechoslovakia (%)
Place of birth for the foreign-born population - Hungary (%)
Place of birth for the foreign-born population - Latvia (%)
Place of birth for the foreign-born population - Lithuania (%)
Place of birth for the foreign-born population - North Macedonia (Macedonia) (%)
Place of birth for the foreign-born population - Moldova (%)
Place of birth for the foreign-born population - Poland (%)
Place of birth for the foreign-born population - Romania (%)
Place of birth for the foreign-born population - Russia (%)
Place of birth for the foreign-born population - Serbia (%)
Place of birth for the foreign-born population - Ukraine (%)
Place of birth for the foreign-born population - Other Eastern Europe (%)
Place of birth for the foreign-born population - China (%)
Place of birth for the foreign-born population - Hong Kong (%)
Place of birth for the foreign-born population - Taiwan (%)
Place of birth for the foreign-born population - Japan (%)
Place of birth for the foreign-born population - Korea (%)
Place of birth for the foreign-born population - Other Eastern Asia (%)
Place of birth for the foreign-born population - Afghanistan (%)
Place of birth for the foreign-born population - Bangladesh (%)
Place of birth for the foreign-born population - India (%)
Place of birth for the foreign-born population - Iran (%)
Place of birth for the foreign-born population - Kazakhstan (%)
Place of birth for the foreign-born population - Nepal (%)
Place of birth for the foreign-born population - Pakistan (%)
Place of birth for the foreign-born population - Sri Lanka (%)
Place of birth for the foreign-born population - Uzbekistan (%)
Place of birth for the foreign-born population - Other South Central Asia (%)
Place of birth for the foreign-born population - Burma (%)
Place of birth for the foreign-born population - Cambodia (%)
Place of birth for the foreign-born population - Indonesia (%)
Place of birth for the foreign-born population - Laos (%)
Place of birth for the foreign-born population - Malaysia (%)
Place of birth for the foreign-born population - Philippines (%)
Place of birth for the foreign-born population - Singapore (%)
Place of birth for the foreign-born population - Thailand (%)
Place of birth for the foreign-born population - Vietnam (%)
Place of birth for the foreign-born population - Other South Eastern Asia (%)
Place of birth for the foreign-born population - Armenia (%)
Place of birth for the foreign-born population - Iraq (%)
Place of birth for the foreign-born population - Israel (%)
Place of birth for the foreign-born population - Jordan (%)
Place of birth for the foreign-born population - Kuwait (%)
Place of birth for the foreign-born population - Lebanon (%)
Place of birth for the foreign-born population - Saudi Arabia (%)
Place of birth for the foreign-born population - Syria (%)
Place of birth for the foreign-born population - Turkey (%)
Place of birth for the foreign-born population - Yemen (%)
Place of birth for the foreign-born population - Other Western Asia (%)
Place of birth for the foreign-born population - Eritrea (%)
Place of birth for the foreign-born population - Ethiopia (%)
Place of birth for the foreign-born population - Kenya (%)
Place of birth for the foreign-born population - Somalia (%)
Place of birth for the foreign-born population - Uganda (%)
Place of birth for the foreign-born population - Zimbabwe (%)
Place of birth for the foreign-born population - Other Eastern Africa (%)
Place of birth for the foreign-born population - Cameroon (%)
Place of birth for the foreign-born population - Congo (%)
Place of birth for the foreign-born population - Democratic Republic of Congo (Zaire) (%)
Place of birth for the foreign-born population - Other Middle Africa (%)
Place of birth for the foreign-born population - Egypt (%)
Place of birth for the foreign-born population - Morocco (%)
Place of birth for the foreign-born population - Sudan (%)
Place of birth for the foreign-born population - Other Northern Africa (%)
Place of birth for the foreign-born population - South Africa (%)
Place of birth for the foreign-born population - Other Southern Africa (%)
Place of birth for the foreign-born population - Cabo Verde (%)
Place of birth for the foreign-born population - Ghana (%)
Place of birth for the foreign-born population - Liberia (%)
Place of birth for the foreign-born population - Nigeria (%)
Place of birth for the foreign-born population - Senegal (%)
Place of birth for the foreign-born population - Sierra Leone (%)
Place of birth for the foreign-born population - Other Western Africa (%)
Place of birth for the foreign-born population - Australia (%)
Place of birth for the foreign-born population - New Zealand (%)
Place of birth for the foreign-born population - Fiji (%)
Place of birth for the foreign-born population - Micronesia (%)
Place of birth for the foreign-born population - Bahamas (%)
Place of birth for the foreign-born population - Barbados (%)
Place of birth for the foreign-born population - Cuba (%)
Place of birth for the foreign-born population - Dominica (%)
Place of birth for the foreign-born population - Dominican Republic (%)
Place of birth for the foreign-born population - Grenada (%)
Place of birth for the foreign-born population - Haiti (%)
Place of birth for the foreign-born population - Jamaica (%)
Place of birth for the foreign-born population - St. Vincent and the Grenadines (%)
Place of birth for the foreign-born population - Trinidad and Tobago (%)
Place of birth for the foreign-born population - West Indies (%)
Place of birth for the foreign-born population - Other Caribbean (%)
Place of birth for the foreign-born population - Belize (%)
Place of birth for the foreign-born population - Costa Rica (%)
Place of birth for the foreign-born population - El Salvador (%)
Place of birth for the foreign-born population - Guatemala (%)
Place of birth for the foreign-born population - Honduras (%)
Place of birth for the foreign-born population - Mexico (%)
Place of birth for the foreign-born population - Nicaragua (%)
Place of birth for the foreign-born population - Panama (%)
Place of birth for the foreign-born population - Other Central America (%)
Place of birth for the foreign-born population - Argentina (%)
Place of birth for the foreign-born population - Bolivia (%)
Place of birth for the foreign-born population - Brazil (%)
Place of birth for the foreign-born population - Chile (%)
Place of birth for the foreign-born population - Colombia (%)
Place of birth for the foreign-born population - Ecuador (%)
Place of birth for the foreign-born population - Guyana (%)
Place of birth for the foreign-born population - Peru (%)
Place of birth for the foreign-born population - Uruguay (%)
Place of birth for the foreign-born population - Venezuela (%)
Place of birth for the foreign-born population - Other South America (%)
Place of birth for the foreign-born population - Canada (%)
Place of birth for the foreign-born population - Other Northern America (%)
Place of birth for the foreign-born population - Other (%)
Latest news about races in Sparks, NV collected exclusively by city-data.com from local newspapers, TV, and radio stations
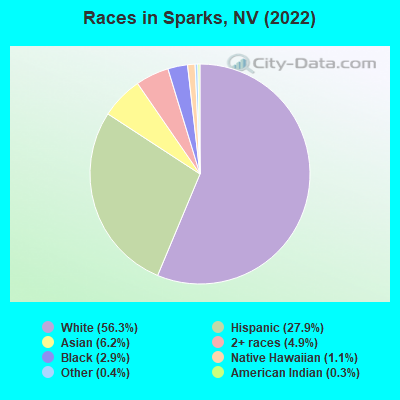
According to 2022 data, the most numerous races in Sparks, NV are White alone (61,511 residents), Hispanic (30,524 residents), and Black alone (3,136 residents). 77.0% of Sparks residents speak English at home. 15.9% of Sparks, NV residents are foreign-born (11.1% born in Latin America, 3.6% born in Asia), which is 13.0% less than the foreign-born rate of 18.0% across the entire state of Nevada.
Race distribution in Sparks
2000 2022
46,122 69.5% White alone 13,068 19.7% Hispanic 3,266 4.9% Asian alone 1,507 2.3% Black alone 1,376 2.1% Two or more races 607 0.9% American Indian alone 316 0.5% Native Hawaiian and Other 84 0.1% Other race alone
61,511 56.3% White alone 30,524 27.9% Hispanic 6,718 6.2% Asian alone 5,360 4.9% Two or more races 3,136 2.9% Black alone 1,201 1.1% Native Hawaiian and Other 458 0.4% Other race alone 319 0.3% American Indian alone
2000 2022
1,303,001 65.2% White alone 393,970 19.7% Hispanic 131,509 6.6% Black alone 88,593 4.4% Asian alone 49,231 2.5% Two or more races 21,397 1.1% American Indian alone 7,769 0.4% Native Hawaiian and Other 2,787 0.1% Other race alone
1,410,145 44.4% White alone 961,357 30.3% Hispanic 286,471 9.0% Black alone 281,149 8.8% Asian alone 182,151 5.7% Two or more races 20,102 0.6% Native Hawaiian and Other 18,781 0.6% Other race alone 17,616 0.6% American Indian alone
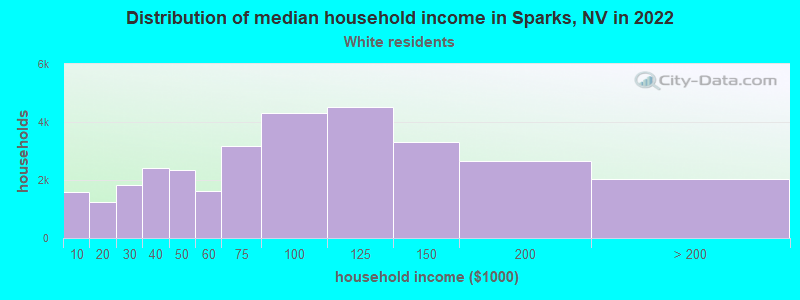
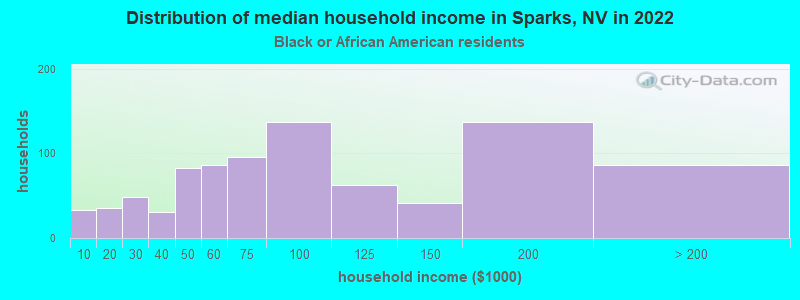
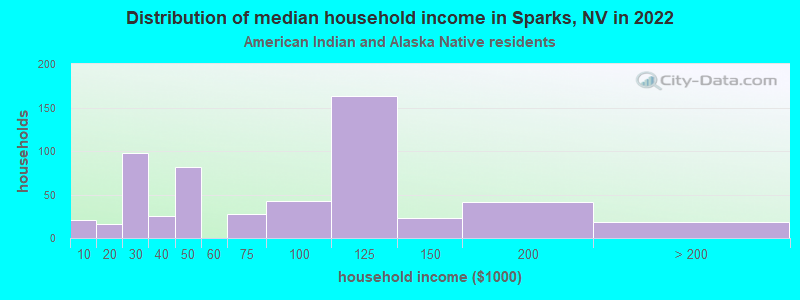
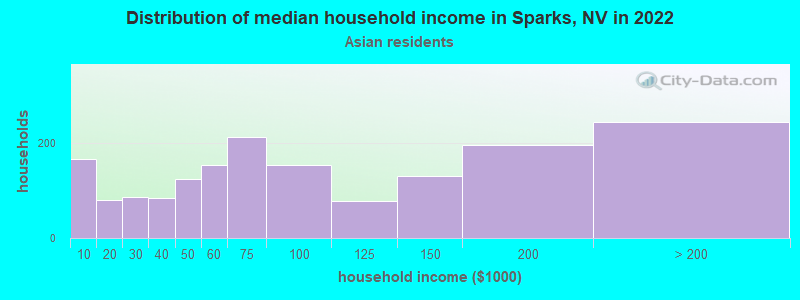
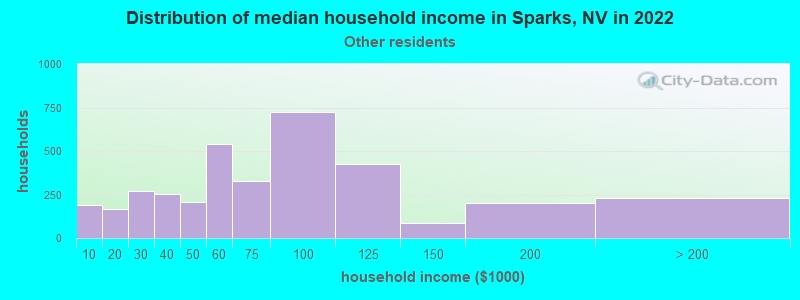
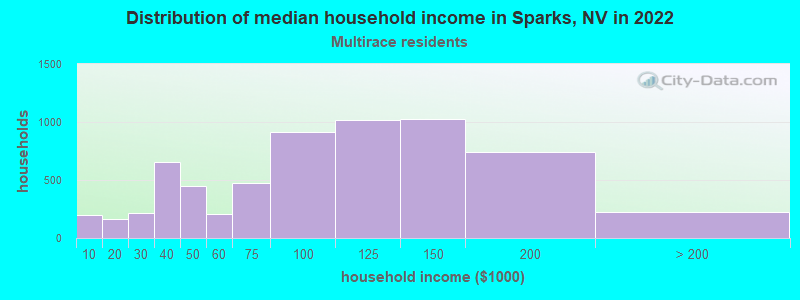
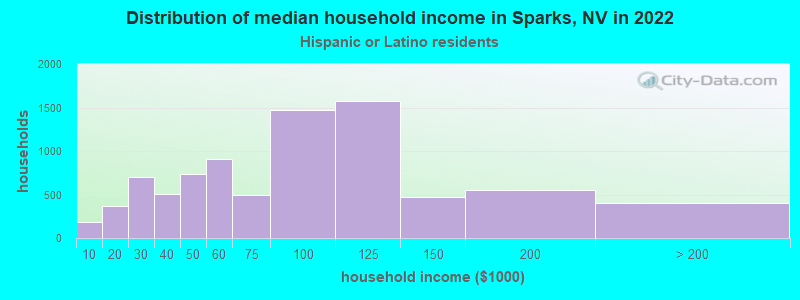
Income and house value in Sparks Median household income in 2022 $83,935 White non-Hispanic householders$90,750 Black householders$82,838 American Indian and Alaska Native householders$74,093 Asian householders$49,713 Native Hawaiian and other Pacific Islander householders$59,107 Some other race householders$89,282 Two or more races householders$79,742 Hispanic or Latino race householdersMedian 2022 house value $508,546 White Non-Hispanic householders$498,699 Black or African American householders$474,784 American Indian or Alaska Native householders $500,457 Asian householders$553,914 Native Hawaiian and other Pacific Islander householders$445,593 Some other race householders$507,491 Two or more races householders$478,652 Hispanic or Latino householders
Median age by race in Sparks
41.2 Median age for White residents39.1 44.0 30.9 Median age for Black or African American residents21.9 39.9 39.6 Median age for American Indian / Alaska Native residents48.1 32.3 41.9 Median age for Asian residents41.6 45.8 25.1 Median age for Native Hawaiian / Pacific Islander residents15.9 32.0 28.7 Median age for Other race residents26.8 32.4 25.7 Median age for Two or more races residents22.7 25.8 43.1 Median age for White alone residents41.0 45.5 28.2 Median age for Hispanic or Latino residents26.4 30.3
Owner/renter occupied households by race in Sparks
House owners and renters - White residents 20,490 66.1% Owner occupied10,527 33.9% Renter occupiedHouse owners and renters - Black or African American residents 615 46.2% Owner occupied715 53.8% Renter occupiedHouse owners and renters - American Indian / Alaska Native residents 269 50.9% Owner occupied259 49.1% Renter occupiedHouse owners and renters - Asian residents 1,327 61.8% Owner occupied819 38.2% Renter occupiedHouse owners and renters - Native Hawaiian / Pacific Islander residents 87 48.4% Owner occupied92 51.6% Renter occupiedHouse owners and renters - Other race residents 1,387 45.5% Owner occupied1,661 54.5% Renter occupiedHouse owners and renters - Two or more races residents 2,692 58.5% Owner occupied1,907 41.5% Renter occupiedHouse owners and renters - White alone residents 19,413 67.0% Owner occupied9,578 33.0% Renter occupiedHouse owners and renters - Hispanic or Latino residents 4,091 48.9% Owner occupied4,278 51.1% Renter occupied
Language usage in Sparks
English speakers - Total 77.0% of residents of Sparks speak English at home.
16.5% of residents speak Spanish at home 11,189 67.2% Speak English very well5,468 32.8% Speak English less than very well6.5% of residents speak other language at home 4,697 71.6% Speak English very well1,864 28.4% Speak English less than very well
English speakers - Born in the United States 90.9% of residents of Sparks speak English at home.
8.4% of residents speak Spanish at home 3,845 88.3% Speak English very well509 11.7% Speak English less than very well0.7% of residents speak other language at home 375 100.0% Speak English very well
English speakers - Native, born elsewhere 37.6% of residents of Sparks speak English at home.
54.2% of residents speak Spanish at home 746 72.5% Speak English very well283 27.5% Speak English less than very well8.3% of residents speak other language at home 73 46.5% Speak English very well84 53.5% Speak English less than very well
English speakers - Foreign-born 14.9% of residents of Sparks speak English at home.
51.3% of residents speak Spanish at home 3,199 41.1% Speak English very well4,587 58.9% Speak English less than very well33.9% of residents speak other language at home 3,459 67.3% Speak English very well1,683 32.7% Speak English less than very well
White (Caucasian) - Speak only English Native:
95.7% (59,469)Foreign-born:
51.4% (778)
White (Caucasian) - Speak another language Native:
4.3% (2,661)Foreign-born:
48.6% (736)
Black or African American - Speak only English Native:
86.3% (1,721)Foreign-born:
7.1% (16)
Black or African American - Speak another language Native:
11.6% (231)Foreign-born:
93.4% (215)
American Indian / Alaska Native - Speak only English Native:
80.2% (610)Foreign-born:
5.5% (59)
American Indian / Alaska Native - Speak another language Native:
17.0% (129)Foreign-born:
54.7% (580)
Asian - Speak only English Native:
78.4% (1,572)Foreign-born:
5.8% (268)
Asian - Speak another language Native:
21.6% (432)Foreign-born:
94.2% (4,332)
Native Hawaiian / Pacific Islander - Speak only English Native:
62.7% (303)Foreign-born:
16.7% (25)
Native Hawaiian / Pacific Islander - Speak another language Native:
38.5% (186)Foreign-born:
75.8% (114)
Other race - Speak only English Native:
32.6% (1,649)Foreign-born:
21.3% (1,024)
Other race - Speak another language Native:
67.4% (3,410)Foreign-born:
78.7% (3,779)
Two or more races - Speak only English Native:
70.7% (8,813)Foreign-born:
5.7% (185)
Two or more races - Speak another language Native:
29.3% (3,655)Foreign-born:
94.3% (3,043)
White alone - Speak only English Native:
97.3% (55,991)Foreign-born:
60.2% (691)
White alone - Speak another language Native:
2.7% (1,551)Foreign-born:
39.8% (456)
Hispanic or Latino - Speak only English Native:
56.0% (10,101)Foreign-born:
13.9% (1,255)
Hispanic or Latino - Speak another language Native:
44.0% (7,939)Foreign-born:
86.1% (7,772)
Foreign-born residents in Sparks 17,564 residents are foreign born (11.1% Latin America , 3.6% Asia ).
This city:
15.9%Nevada:
19.1%
Marital status for residents in Sparks Marital status - White (Caucasian) population 15 years and over
Males 36.7% Never married47.7% Now married0.7% Separated2.5% Widowed12.5% DivorcedFemales 26.2% Never married44.0% Now married1.3% Separated8.4% Widowed20.2% DivorcedWomen who gave birth in the past 12 months Now married:
56.7% (393)Unmarried:
43.3% (300)
Women who did not give birth in the past 12 months Now married:
39.2% (5,868)Unmarried:
60.8% (9,088)
Marital status - Black or African American population 15 years and over
Males 32.6% Never married37.5% Now married1.5% Separated3.2% Widowed25.2% DivorcedFemales 28.8% Never married49.2% Now married2.9% Separated8.8% Widowed10.3% DivorcedWomen who gave birth in the past 12 months Now married:
31.0% (8)Unmarried:
69.0% (17)
Women who did not give birth in the past 12 months Now married:
48.6% (184)Unmarried:
51.4% (194)
Marital status - American Indian / Alaska Native population 15 years and over
Males 32.8% Never married53.1% Now married2.6% Separated7.4% Widowed4.1% DivorcedFemales 31.8% Never married50.2% Now married0.0% Separated4.2% Widowed13.9% DivorcedWomen who gave birth in the past 12 months Now married:
0.0% (0)Unmarried:
100.0% (9)
Women who did not give birth in the past 12 months Now married:
58.7% (300)Unmarried:
41.3% (211)
Marital status - Asian population 15 years and over
Males 39.2% Never married47.5% Now married0.0% Separated0.0% Widowed13.3% DivorcedFemales 13.0% Never married54.4% Now married8.1% Separated8.1% Widowed16.5% DivorcedWomen who gave birth in the past 12 months Now married:
100.0% (21)Unmarried:
0.0% (0)
Women who did not give birth in the past 12 months Now married:
51.3% (727)Unmarried:
48.7% (691)
Marital status - Native Hawaiian / Pacific Islander population 15 years and over
Males 31.6% Never married68.4% Now married0.0% Separated0.0% Widowed0.0% DivorcedFemales 44.7% Never married35.2% Now married0.0% Separated20.1% Widowed0.0% DivorcedWomen who gave birth in the past 12 months Now married:
0.0% (0)Unmarried:
100.0% (56)
Women who did not give birth in the past 12 months Now married:
37.8% (48)Unmarried:
62.2% (79)
Marital status - Other race population 15 years and over
Males 46.7% Never married44.8% Now married2.9% Separated0.5% Widowed5.1% DivorcedFemales 37.2% Never married50.3% Now married3.4% Separated4.4% Widowed4.7% DivorcedWomen who gave birth in the past 12 months Now married:
100.0% (123)Unmarried:
0.0% (0)
Women who did not give birth in the past 12 months Now married:
46.6% (1,297)Unmarried:
53.4% (1,486)
Marital status - Two or more races population 15 years and over
Males 43.9% Never married39.2% Now married3.1% Separated1.2% Widowed12.7% DivorcedFemales 40.4% Never married40.8% Now married0.7% Separated5.7% Widowed12.4% DivorcedWomen who gave birth in the past 12 months Now married:
56.8% (461)Unmarried:
43.2% (350)
Women who did not give birth in the past 12 months Now married:
36.1% (1,567)Unmarried:
63.9% (2,769)
Marital status - White alone, not Hispanic / Latino population 15 years and over
Males 35.7% Never married48.1% Now married0.7% Separated2.6% Widowed12.9% DivorcedFemales 24.8% Never married44.4% Now married1.1% Separated9.3% Widowed20.4% DivorcedWomen who gave birth in the past 12 months Now married:
56.8% (313)Unmarried:
43.2% (238)
Women who did not give birth in the past 12 months Now married:
41.8% (5,439)Unmarried:
58.2% (7,568)
Marital status - Hispanic or Latino population 15 years and over
Males 46.7% Never married42.9% Now married2.2% Separated1.3% Widowed6.9% DivorcedFemales 39.4% Never married41.1% Now married2.8% Separated5.8% Widowed11.0% DivorcedWomen who gave birth in the past 12 months Now married:
48.3% (269)Unmarried:
51.7% (288)
Women who did not give birth in the past 12 months Now married:
33.9% (2,649)Unmarried:
66.1% (5,175)
Ancestries in Sparks
4,575 7.9% English3,261 5.6% German2,712 4.7% American2,569 4.4% European2,300 4.0% Italian2,165 3.7% Irish954 1.7% Norwegian669 1.2% French475 0.8% Scottish447 0.8% Polish300 0.5% Nigerian275 0.5% Dutch250 0.4% Danish245 0.4% Northern European237 0.4% Scotch-Irish159 0.3% Scandinavian157 0.3% French Canadian154 0.3% Swedish150 0.3% Ukrainian149 0.3% British129 0.2% Canadian127 0.2% Russian112 0.2% Greek105 0.2% Portuguese102 0.2% Eastern European76 0.1% Finnish72 0.1% Basque72 0.1% Iranian64 0.1% Haitian59 0.1% Welsh58 0.1% African47 0.08% Austrian46 0.08% Hungarian43 0.07% Ghanaian37 0.06% Romanian37 0.06% Swiss31 0.05% Yugoslavian23 0.04% Czech23 0.04% South African21 0.04% Lithuanian18 0.03% Slovak16 0.03% Assyrian14 0.02% Armenian14 0.02% Serbian14 0.02% Latvian13 0.02% Slavic12 0.02% Lebanese11 0.02% Czechoslovakian11 0.02% Turkish10 0.02% Belgian9 0.02% Ethiopian6 0.01% Brazilian4 0.01% Arab
Geographical mobility in Sparks Same house 1 year ago 57,153 85.9% White (Caucasian)1,855 92.6% Black or African American1,302 88.5% American Indian / Alaska Native6,179 92.0% Asian577 83.2% Native Hawaiian / Pacific Islander11,764 93.7% Other race15,470 85.5% Two or more races52,342 85.8% White alone, not Hispanic / Latino34,017 89.0% Hispanic or LatinoMoved within same county 7,612 11.4% White / Caucasian163 8.1% Black or African American135 9.2% American Indian / Alaska Native280 4.2% Asian81 11.7% Native Hawaiian / Pacific Islander659 5.2% Other race2,024 11.2% Two or more races7,015 11.5% White alone, not Hispanic / Latino3,454 9.0% Hispanic or LatinoMoved within same state 283 0.4% White / Caucasian53 2.7% Black or African American19 1.3% American Indian / Alaska Native4 0.1% Asian85 0.7% Other race283 0.5% White alone, not Hispanic / Latino200 0.5% Hispanic or LatinoMoved from different state 1,484 2.2% White / Caucasian15 0.7% Black or African American8 0.5% American Indian / Alaska Native18 2.6% Native Hawaiian / Pacific Islander187 1.5% Other race600 3.3% Two or more races1,392 2.3% White alone, not Hispanic / Latino1,130 3.0% Hispanic or LatinoMoved from abroad 255 3.8% Asian6 0.9% Native Hawaiian / Pacific Islander37 0.1% Hispanic or Latino
Children Nativity (place of birth) in Sparks
Children under 6 years - Living with two parents Both parents native 4,726 100.0% NativeBoth parents foreign-born 70 35.5% Native127 64.5% Foreign-bornOne native, one foreign-born parent 1,302 100.0% NativeChildren under 6 years - Living with one parent Native parent 2,174 100.0% NativeForeign-born parent 384 68.7% Native175 31.3% Foreign-bornChildren 6 to 17 years - Living with two parents Both parents native 5,424 100.0% NativeBoth parents foreign-born 1,717 70.5% Native717 29.5% Foreign-bornOne native, one foreign-born parent 1,410 100.0% NativeChildren 6 to 17 years - Living with one parent Native parent 3,149 100.0% NativeForeign-born parent 1,185 57.5% Native876 42.5% Foreign-born
Grandparents responsible for own grandchildren in Sparks
Grandparents (30 to 59 years) White / Caucasian 146 31.6% Responsible for grandchildren315 68.4% Not responsible for grandchildrenAmerican Indian / Alaska Native 12 100.0% Responsible for grandchildrenAsian 13 55.9% Responsible for grandchildren10 44.1% Not responsible for grandchildrenNative Hawaiian / Pacific Islander 10 100.0% Not responsible for grandchildrenOther race 156 83.0% Responsible for grandchildren32 17.0% Not responsible for grandchildrenTwo or more races 107 31.3% Responsible for grandchildren234 68.7% Not responsible for grandchildrenWhite alone, not Hispanic / Latino 125 58.8% Responsible for grandchildren87 41.2% Not responsible for grandchildrenHispanic or Latino 186 25.3% Responsible for grandchildren549 74.7% Not responsible for grandchildrenGrandparents (60 years and over) White / Caucasian 278 25.9% Responsible for grandchildren795 74.1% Not responsible for grandchildrenAmerican Indian / Alaska Native 15 40.1% Responsible for grandchildren23 59.9% Not responsible for grandchildrenAsian 34 12.0% Responsible for grandchildren252 88.0% Not responsible for grandchildrenNative Hawaiian / Pacific Islander 31 100.0% Responsible for grandchildrenOther race 40 13.6% Responsible for grandchildren256 86.4% Not responsible for grandchildrenTwo or more races 33 29.3% Responsible for grandchildren79 70.7% Not responsible for grandchildrenWhite alone, not Hispanic / Latino 287 31.3% Responsible for grandchildren631 68.7% Not responsible for grandchildrenHispanic or Latino 25 6.3% Responsible for grandchildren369 93.7% Not responsible for grandchildren