Races in Southwest Ranches, Florida (FL) Detailed Stats
Data:
Races - White alone (%)
Races - White alone (% change since 2000)
Races - Black alone (%)
Races - Black alone (% change since 2000)
Races - American Indian alone (%)
Races - American Indian alone (% change since 2000)
Races - Asian alone (%)
Races - Asian alone (% change since 2000)
Races - Hispanic (%)
Races - Hispanic (% change since 2000)
Races - Native Hawaiian and Other Pacific Islander alone (%)
Races - Native Hawaiian and Other Pacific Islander alone (% change since 2000)
Races - Two or more races(%)
Races - Two or more races(% change since 2000)
Races - Other race alone (%)
Races - Other race alone (% change since 2000)
Racial diversity
Place of birth - Born in state of residence (%)
Place of birth - Born in state of residence (%) - White
Place of birth - Born in state of residence (%) - Black or African American
Place of birth - Born in state of residence (%) - Asian
Place of birth - Born in state of residence (%) - Hispanic or Latino
Place of birth - Born in state of residence (%) - American Indian and Alaska Native
Place of birth - Born in state of residence (%) - Multirace
Place of birth - Born in state of residence (%) - Other Race
Place of birth - Born in other state (%)
Place of birth - Born in other state (%) - White
Place of birth - Born in other state (%) - Black or African American
Place of birth - Born in other state (%) - Asian
Place of birth - Born in other state (%) - Hispanic or Latino
Place of birth - Born in other state (%) - American Indian and Alaska Native
Place of birth - Born in other state (%) - Multirace
Place of birth - Born in other state (%) - Other Race
Place of birth - Native, outside of US (%)
Place of birth - Native, outside of US (%) - White
Place of birth - Native, outside of US (%) - Black or African American
Place of birth - Native, outside of US (%) - Asian
Place of birth - Native, outside of US (%) - Hispanic or Latino
Place of birth - Native, outside of US (%) - American Indian and Alaska Native
Place of birth - Native, outside of US (%) - Multirace
Place of birth - Native, outside of US (%) - Other Race
Place of birth - Foreign born (%)
Place of birth - Foreign born (%) - White
Place of birth - Foreign born (%) - Black or African American
Place of birth - Foreign born (%) - Asian
Place of birth - Foreign born (%) - Hispanic or Latino
Place of birth - Foreign born (%) - American Indian and Alaska Native
Place of birth - Foreign born (%) - Multirace
Place of birth - Foreign born (%) - Other Race
Residents speaking English at home (%)
Residents speaking English at home - Born in the United States (%)
Residents speaking English at home - Native, born elsewhere (%)
Residents speaking English at home - Foreign born (%)
Residents speaking Spanish at home (%)
Residents speaking Spanish at home - Born in the United States (%)
Residents speaking Spanish at home - Native, born elsewhere (%)
Residents speaking Spanish at home - Foreign born (%)
Residents speaking other language at home (%)
Residents speaking other language at home - Born in the United States (%)
Residents speaking other language at home - Native, born elsewhere (%)
Residents speaking other language at home - Foreign born (%)
Marital status - Never married (%)
Marital status - Now married (%)
Marital status - Separated (%)
Marital status - Widowed (%)
Marital status - Divorced (%)
Ancestries Reported - Arab (%)
Ancestries Reported - Czech (%)
Ancestries Reported - Danish (%)
Ancestries Reported - Dutch (%)
Ancestries Reported - English (%)
Ancestries Reported - French (%)
Ancestries Reported - French Canadian (%)
Ancestries Reported - German (%)
Ancestries Reported - Greek (%)
Ancestries Reported - Hungarian (%)
Ancestries Reported - Irish (%)
Ancestries Reported - Italian (%)
Ancestries Reported - Lithuanian (%)
Ancestries Reported - Norwegian (%)
Ancestries Reported - Polish (%)
Ancestries Reported - Portuguese (%)
Ancestries Reported - Russian (%)
Ancestries Reported - Scotch-Irish (%)
Ancestries Reported - Scottish (%)
Ancestries Reported - Slovak (%)
Ancestries Reported - Subsaharan African (%)
Ancestries Reported - Swedish (%)
Ancestries Reported - Swiss (%)
Ancestries Reported - Ukrainian (%)
Ancestries Reported - United States (%)
Ancestries Reported - Welsh (%)
Ancestries Reported - West Indian (%)
Ancestries Reported - Other (%)
Geographical mobility - Same house 1 year ago (%)
Geographical mobility - Same house 1 year ago (%) - White
Geographical mobility - Same house 1 year ago (%) - Black or African American
Geographical mobility - Same house 1 year ago (%) - Asian
Geographical mobility - Same house 1 year ago (%) - Hispanic or Latino
Geographical mobility - Same house 1 year ago (%) - American Indian and Alaska Native
Geographical mobility - Same house 1 year ago (%) - Multirace
Geographical mobility - Same house 1 year ago (%) - Other Race
Geographical mobility - Moved within same county (%)
Geographical mobility - Moved within same county (%) - White
Geographical mobility - Moved within same county (%) - Black or African American
Geographical mobility - Moved within same county (%) - Asian
Geographical mobility - Moved within same county (%) - Hispanic or Latino
Geographical mobility - Moved within same county (%) - American Indian and Alaska Native
Geographical mobility - Moved within same county (%) - Multirace
Geographical mobility - Moved within same county (%) - Other Race
Geographical mobility - Moved from different county within same state (%)
Geographical mobility - Moved from different county within same state (%) - White
Geographical mobility - Moved from different county within same state (%) - Black or African American
Geographical mobility - Moved from different county within same state (%) - Asian
Geographical mobility - Moved from different county within same state (%) - Hispanic or Latino
Geographical mobility - Moved from different county within same state (%) - American Indian and Alaska Native
Geographical mobility - Moved from different county within same state (%) - Multirace
Geographical mobility - Moved from different county within same state (%) - Other Race
Geographical mobility - Moved from different state (%)
Geographical mobility - Moved from different state (%) - White
Geographical mobility - Moved from different state (%) - Black or African American
Geographical mobility - Moved from different state (%) - Asian
Geographical mobility - Moved from different state (%) - Hispanic or Latino
Geographical mobility - Moved from different state (%) - American Indian and Alaska Native
Geographical mobility - Moved from different state (%) - Multirace
Geographical mobility - Moved from different state (%) - Other Race
Geographical mobility - Moved from abroad (%)
Geographical mobility - Moved from abroad (%) - White
Geographical mobility - Moved from abroad (%) - Black or African American
Geographical mobility - Moved from abroad (%) - Asian
Geographical mobility - Moved from abroad (%) - Hispanic or Latino
Geographical mobility - Moved from abroad (%) - American Indian and Alaska Native
Geographical mobility - Moved from abroad (%) - Multirace
Geographical mobility - Moved from abroad (%) - Other Race
Place of birth for the foreign-born population - Ireland (%)
Place of birth for the foreign-born population - Denmark (%)
Place of birth for the foreign-born population - Norway (%)
Place of birth for the foreign-born population - Sweden (%)
Place of birth for the foreign-born population - United Kingdom (%)
Place of birth for the foreign-born population - England (%)
Place of birth for the foreign-born population - Scotland (%)
Place of birth for the foreign-born population - Other Northern Europe (%)
Place of birth for the foreign-born population - Austria (%)
Place of birth for the foreign-born population - Belgium (%)
Place of birth for the foreign-born population - France (%)
Place of birth for the foreign-born population - Germany (%)
Place of birth for the foreign-born population - Netherlands (%)
Place of birth for the foreign-born population - Switzerland (%)
Place of birth for the foreign-born population - Other Western Europe (%)
Place of birth for the foreign-born population - Greece (%)
Place of birth for the foreign-born population - Italy (%)
Place of birth for the foreign-born population - Portugal (%)
Place of birth for the foreign-born population - Spain (%)
Place of birth for the foreign-born population - Other Southern Europe (%)
Place of birth for the foreign-born population - Albania (%)
Place of birth for the foreign-born population - Belarus (%)
Place of birth for the foreign-born population - Bosnia and Herzegovina (%)
Place of birth for the foreign-born population - Bulgaria (%)
Place of birth for the foreign-born population - Croatia (%)
Place of birth for the foreign-born population - Czechoslovakia (%)
Place of birth for the foreign-born population - Hungary (%)
Place of birth for the foreign-born population - Latvia (%)
Place of birth for the foreign-born population - Lithuania (%)
Place of birth for the foreign-born population - North Macedonia (Macedonia) (%)
Place of birth for the foreign-born population - Moldova (%)
Place of birth for the foreign-born population - Poland (%)
Place of birth for the foreign-born population - Romania (%)
Place of birth for the foreign-born population - Russia (%)
Place of birth for the foreign-born population - Serbia (%)
Place of birth for the foreign-born population - Ukraine (%)
Place of birth for the foreign-born population - Other Eastern Europe (%)
Place of birth for the foreign-born population - China (%)
Place of birth for the foreign-born population - Hong Kong (%)
Place of birth for the foreign-born population - Taiwan (%)
Place of birth for the foreign-born population - Japan (%)
Place of birth for the foreign-born population - Korea (%)
Place of birth for the foreign-born population - Other Eastern Asia (%)
Place of birth for the foreign-born population - Afghanistan (%)
Place of birth for the foreign-born population - Bangladesh (%)
Place of birth for the foreign-born population - India (%)
Place of birth for the foreign-born population - Iran (%)
Place of birth for the foreign-born population - Kazakhstan (%)
Place of birth for the foreign-born population - Nepal (%)
Place of birth for the foreign-born population - Pakistan (%)
Place of birth for the foreign-born population - Sri Lanka (%)
Place of birth for the foreign-born population - Uzbekistan (%)
Place of birth for the foreign-born population - Other South Central Asia (%)
Place of birth for the foreign-born population - Burma (%)
Place of birth for the foreign-born population - Cambodia (%)
Place of birth for the foreign-born population - Indonesia (%)
Place of birth for the foreign-born population - Laos (%)
Place of birth for the foreign-born population - Malaysia (%)
Place of birth for the foreign-born population - Philippines (%)
Place of birth for the foreign-born population - Singapore (%)
Place of birth for the foreign-born population - Thailand (%)
Place of birth for the foreign-born population - Vietnam (%)
Place of birth for the foreign-born population - Other South Eastern Asia (%)
Place of birth for the foreign-born population - Armenia (%)
Place of birth for the foreign-born population - Iraq (%)
Place of birth for the foreign-born population - Israel (%)
Place of birth for the foreign-born population - Jordan (%)
Place of birth for the foreign-born population - Kuwait (%)
Place of birth for the foreign-born population - Lebanon (%)
Place of birth for the foreign-born population - Saudi Arabia (%)
Place of birth for the foreign-born population - Syria (%)
Place of birth for the foreign-born population - Turkey (%)
Place of birth for the foreign-born population - Yemen (%)
Place of birth for the foreign-born population - Other Western Asia (%)
Place of birth for the foreign-born population - Eritrea (%)
Place of birth for the foreign-born population - Ethiopia (%)
Place of birth for the foreign-born population - Kenya (%)
Place of birth for the foreign-born population - Somalia (%)
Place of birth for the foreign-born population - Uganda (%)
Place of birth for the foreign-born population - Zimbabwe (%)
Place of birth for the foreign-born population - Other Eastern Africa (%)
Place of birth for the foreign-born population - Cameroon (%)
Place of birth for the foreign-born population - Congo (%)
Place of birth for the foreign-born population - Democratic Republic of Congo (Zaire) (%)
Place of birth for the foreign-born population - Other Middle Africa (%)
Place of birth for the foreign-born population - Egypt (%)
Place of birth for the foreign-born population - Morocco (%)
Place of birth for the foreign-born population - Sudan (%)
Place of birth for the foreign-born population - Other Northern Africa (%)
Place of birth for the foreign-born population - South Africa (%)
Place of birth for the foreign-born population - Other Southern Africa (%)
Place of birth for the foreign-born population - Cabo Verde (%)
Place of birth for the foreign-born population - Ghana (%)
Place of birth for the foreign-born population - Liberia (%)
Place of birth for the foreign-born population - Nigeria (%)
Place of birth for the foreign-born population - Senegal (%)
Place of birth for the foreign-born population - Sierra Leone (%)
Place of birth for the foreign-born population - Other Western Africa (%)
Place of birth for the foreign-born population - Australia (%)
Place of birth for the foreign-born population - New Zealand (%)
Place of birth for the foreign-born population - Fiji (%)
Place of birth for the foreign-born population - Micronesia (%)
Place of birth for the foreign-born population - Bahamas (%)
Place of birth for the foreign-born population - Barbados (%)
Place of birth for the foreign-born population - Cuba (%)
Place of birth for the foreign-born population - Dominica (%)
Place of birth for the foreign-born population - Dominican Republic (%)
Place of birth for the foreign-born population - Grenada (%)
Place of birth for the foreign-born population - Haiti (%)
Place of birth for the foreign-born population - Jamaica (%)
Place of birth for the foreign-born population - St. Vincent and the Grenadines (%)
Place of birth for the foreign-born population - Trinidad and Tobago (%)
Place of birth for the foreign-born population - West Indies (%)
Place of birth for the foreign-born population - Other Caribbean (%)
Place of birth for the foreign-born population - Belize (%)
Place of birth for the foreign-born population - Costa Rica (%)
Place of birth for the foreign-born population - El Salvador (%)
Place of birth for the foreign-born population - Guatemala (%)
Place of birth for the foreign-born population - Honduras (%)
Place of birth for the foreign-born population - Mexico (%)
Place of birth for the foreign-born population - Nicaragua (%)
Place of birth for the foreign-born population - Panama (%)
Place of birth for the foreign-born population - Other Central America (%)
Place of birth for the foreign-born population - Argentina (%)
Place of birth for the foreign-born population - Bolivia (%)
Place of birth for the foreign-born population - Brazil (%)
Place of birth for the foreign-born population - Chile (%)
Place of birth for the foreign-born population - Colombia (%)
Place of birth for the foreign-born population - Ecuador (%)
Place of birth for the foreign-born population - Guyana (%)
Place of birth for the foreign-born population - Peru (%)
Place of birth for the foreign-born population - Uruguay (%)
Place of birth for the foreign-born population - Venezuela (%)
Place of birth for the foreign-born population - Other South America (%)
Place of birth for the foreign-born population - Canada (%)
Place of birth for the foreign-born population - Other Northern America (%)
Place of birth for the foreign-born population - Other (%)
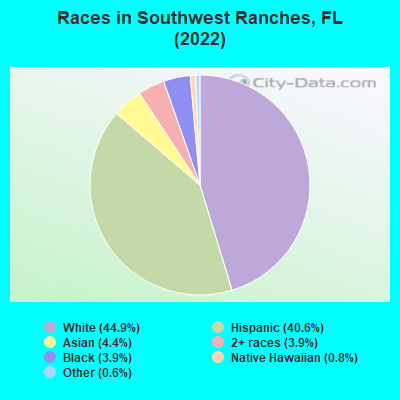
According to 2022 data, the most numerous races in Southwest Ranches, FL are White alone (3,420 residents), Hispanic (3,088 residents), and Black alone (294 residents). 57.9% of Southwest Ranches residents speak English at home.
Race distribution in Southwest Ranches 3,420 44.9% White alone 3,088 40.6% Hispanic 334 4.4% Asian alone 294 3.9% Black alone 300 3.9% Two or more races 60 0.8% Native Hawaiian and Other 44 0.6% Other race alone
2000 2022
10,458,509 65.4% White alone 2,682,715 16.8% Hispanic 2,264,268 14.2% Black alone 261,693 1.6% Asian alone 236,954 1.5% Two or more races 42,358 0.3% American Indian alone 28,994 0.2% Other race alone 6,887 0.04% Native Hawaiian and Other
11,309,403 50.8% White alone 6,025,039 27.1% Hispanic 3,241,015 14.6% Black alone 861,630 3.9% Two or more races 623,692 2.8% Asian alone 152,054 0.7% Other race alone 22,504 0.1% American Indian alone 9,486 0.04% Native Hawaiian and Other
Income and house value in Southwest Ranches Median household income in 2022 $154,525 White non-Hispanic householdersover $200,000 Black householdersover $200,000 Two or more races householdersover $200,000 Hispanic or Latino race householders
Median age by race in Southwest Ranches
45.0 Median age for White residents50.5 42.0 50.7 Median age for Black or African American residents51.0 46.0 -660,098,521.5 Median age for American Indian / Alaska Native residents-518,333,332.8 -735,362,996.9 20.2 Median age for Asian residents19.0 48.7 -437,357,630.5 Median age for Native Hawaiian / Pacific Islander residents-454,756,380.1 -666,666,666.0 52.4 Median age for Other race residents51.3 53.5 43.1 Median age for Two or more races residents42.8 44.1 46.1 Median age for White alone residents54.7 42.9 41.2 Median age for Hispanic or Latino residents41.1 41.8
Owner/renter occupied households by race in Southwest Ranches
House owners and renters - White residents 1,216 98.4% Owner occupied20 1.6% Renter occupiedHouse owners and renters - Black or African American residents 100 100.0% Owner occupiedHouse owners and renters - Asian residents 77 100.0% Owner occupiedHouse owners and renters - Native Hawaiian / Pacific Islander residents 52 100.0% Owner occupiedHouse owners and renters - Other race residents 58 100.0% Owner occupiedHouse owners and renters - Two or more races residents 479 90.4% Owner occupied51 9.6% Renter occupiedHouse owners and renters - White alone residents 1,026 97.8% Owner occupied23 2.2% Renter occupiedHouse owners and renters - Hispanic or Latino residents 653 100.0% Owner occupied
Language usage in Southwest Ranches
English speakers - Total 57.9% of residents of Southwest Ranches speak English at home.
33.9% of residents speak Spanish at home 1,790 71.3% Speak English very well722 28.7% Speak English less than very well7.6% of residents speak other language at home 476 84.2% Speak English very well89 15.8% Speak English less than very well
English speakers - Born in the United States 88.5% of residents of Southwest Ranches speak English at home.
9.0% of residents speak Spanish at home 155 93.4% Speak English very well11 6.6% Speak English less than very well1.9% of residents speak other language at home 35 100.0% Speak English very well
English speakers - Native, born elsewhere 51.6% of residents of Southwest Ranches speak English at home.
44.4% of residents speak Spanish at home 104 94.5% Speak English very well6 5.5% Speak English less than very well4.4% of residents speak other language at home 11 100.0% Speak English very well
English speakers - Foreign-born 15.6% of residents of Southwest Ranches speak English at home.
65.1% of residents speak Spanish at home 627 50.0% Speak English very well626 50.0% Speak English less than very well20.4% of residents speak other language at home 302 77.0% Speak English very well90 23.0% Speak English less than very well
White (Caucasian) - Speak only English Native:
85.3% (3,062)Foreign-born:
29.3% (142)
White (Caucasian) - Speak another language Native:
14.6% (526)Foreign-born:
73.9% (360)
Black or African American - Speak only English Native:
100.0% (218)Foreign-born:
47.1% (36)
Asian - Speak only English Native:
62.8% (51)Foreign-born:
23.8% (54)
Asian - Speak another language Native:
36.0% (29)Foreign-born:
76.0% (173)
Other race - Speak only English Native:
66.2% (82)Foreign-born:
37.3% (33)
Other race - Speak another language Native:
36.9% (46)Foreign-born:
63.6% (57)
Two or more races - Speak only English Native:
32.5% (413)Foreign-born:
2.4% (28)
Two or more races - Speak another language Native:
68.4% (871)Foreign-born:
98.4% (1,140)
White alone - Speak only English Native:
91.4% (2,819)Foreign-born:
49.6% (132)
White alone - Speak another language Native:
8.6% (265)Foreign-born:
51.8% (137)
Hispanic or Latino - Speak only English Native:
36.7% (629)Foreign-born:
3.0% (37)
Hispanic or Latino - Speak another language Native:
63.3% (1,085)Foreign-born:
96.8% (1,185)
Foreign-born residents in Southwest Ranches
Marital status for residents in Southwest Ranches Marital status - White (Caucasian) population 15 years and over
Males 28.4% Never married59.9% Now married0.5% Separated5.7% Widowed5.5% DivorcedFemales 29.7% Never married54.7% Now married2.6% Separated6.7% Widowed6.3% DivorcedWomen who gave birth in the past 12 months Now married:
100.0% (7)Unmarried:
0.0% (0)
Women who did not give birth in the past 12 months Now married:
43.5% (343)Unmarried:
56.5% (445)
Marital status - Black or African American population 15 years and over
Males 23.9% Never married53.6% Now married0.0% Separated0.0% Widowed22.5% DivorcedFemales 55.3% Never married23.9% Now married0.0% Separated8.2% Widowed12.6% DivorcedWomen who did not give birth in the past 12 months Now married:
28.8% (33)Unmarried:
71.2% (80)
Marital status - Asian population 15 years and over
Males 59.7% Never married31.8% Now married0.0% Separated8.4% Widowed0.0% DivorcedFemales 28.8% Never married49.2% Now married0.0% Separated22.0% Widowed0.0% DivorcedWomen who did not give birth in the past 12 months Now married:
50.0% (39)Unmarried:
50.0% (39)
Marital status - Other race population 15 years and over
Males 0.0% Never married100.0% Now married0.0% Separated0.0% Widowed0.0% DivorcedFemales 11.0% Never married74.0% Now married0.0% Separated0.0% Widowed15.1% DivorcedWomen who did not give birth in the past 12 months Now married:
75.0% (31)Unmarried:
25.0% (10)
Marital status - Two or more races population 15 years and over
Males 37.0% Never married59.5% Now married3.5% Separated0.0% Widowed0.0% DivorcedFemales 26.6% Never married44.2% Now married9.0% Separated4.0% Widowed16.2% DivorcedWomen who did not give birth in the past 12 months Now married:
34.9% (192)Unmarried:
65.1% (358)
Marital status - White alone, not Hispanic / Latino population 15 years and over
Males 26.7% Never married58.0% Now married0.6% Separated7.6% Widowed7.0% DivorcedFemales 25.5% Never married58.7% Now married3.7% Separated8.6% Widowed3.5% DivorcedWomen who gave birth in the past 12 months Now married:
100.0% (9)Unmarried:
0.0% (0)
Women who did not give birth in the past 12 months Now married:
48.4% (309)Unmarried:
51.6% (329)
Marital status - Hispanic or Latino population 15 years and over
Males 35.7% Never married61.2% Now married1.8% Separated0.5% Widowed0.8% DivorcedFemales 31.4% Never married46.4% Now married4.8% Separated3.1% Widowed14.3% DivorcedWomen who did not give birth in the past 12 months Now married:
35.8% (252)Unmarried:
64.2% (453)
Ancestries in Southwest Ranches
1,001 23.1% American182 4.2% German147 3.4% Egyptian134 3.1% Greek122 2.8% European120 2.8% Irish95 2.2% Italian68 1.6% British60 1.4% English47 1.1% Brazilian45 1.0% Canadian38 0.9% Guyanese31 0.7% Scotch-Irish26 0.6% Jamaican25 0.6% Scandinavian24 0.6% French Canadian24 0.6% Haitian19 0.4% French14 0.3% Palestinian13 0.3% Norwegian7 0.2% Trinidadian and Tobagonian6 0.1% Danish6 0.1% Russian2 0.05% Scottish
Children Nativity (place of birth) in Southwest Ranches
Children under 6 years - Living with two parents Both parents native 102 100.0% NativeBoth parents foreign-born 64 100.0% NativeOne native, one foreign-born parent 73 100.0% NativeChildren under 6 years - Living with one parent Native parent 42 100.0% NativeChildren 6 to 17 years - Living with two parents Both parents native 528 99.0% Native5 1.0% Foreign-bornBoth parents foreign-born 172 69.9% Native74 30.1% Foreign-bornOne native, one foreign-born parent 276 94.0% Native18 6.0% Foreign-bornChildren 6 to 17 years - Living with one parent Native parent 344 91.1% Native34 8.9% Foreign-bornForeign-born parent 31 100.0% Native
Grandparents responsible for own grandchildren in Southwest Ranches
Grandparents (30 to 59 years) White / Caucasian 4 100.0% Not responsible for grandchildrenTwo or more races 84 100.0% Not responsible for grandchildrenWhite alone, not Hispanic / Latino 3 100.0% Not responsible for grandchildrenHispanic or Latino 50 100.0% Not responsible for grandchildren
Grandparents (60 years and over) White / Caucasian 1 0.6% Responsible for grandchildren118 99.4% Not responsible for grandchildrenTwo or more races 198 100.0% Not responsible for grandchildrenWhite alone, not Hispanic / Latino 1 0.6% Responsible for grandchildren143 99.4% Not responsible for grandchildrenHispanic or Latino 137 100.0% Not responsible for grandchildren