Races in Southwest Glades, Florida (FL) Detailed Stats
Ancestries, Foreign-born residents, place of birth
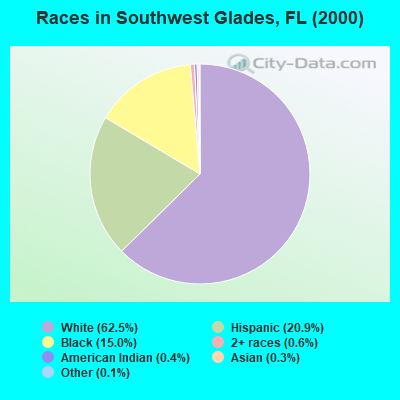
Race distribution in Southwest Glades

- 4,54462.5%White alone
- 1,51820.9%Hispanic
- 1,09315.0%Black alone
- 460.6%Two or more races
- 310.4%American Indian alone
- 240.3%Asian alone
- 90.1%Other race alone
- 20.03%Native Hawaiian and Other
Pacific Islander alone
2000
2022
-
- 10,458,50965.4%White alone
- 2,682,71516.8%Hispanic
- 2,264,26814.2%Black alone
- 261,6931.6%Asian alone
- 236,9541.5%Two or more races
- 42,3580.3%American Indian alone
- 28,9940.2%Other race alone
- 6,8870.04%Native Hawaiian and Other
Pacific Islander alone

-
- 11,309,40350.8%White alone
- 6,025,03927.1%Hispanic
- 3,241,01514.6%Black alone
- 861,6303.9%Two or more races
- 623,6922.8%Asian alone
- 152,0540.7%Other race alone
- 22,5040.1%American Indian alone
- 9,4860.04%Native Hawaiian and Other
Pacific Islander alone

Income and house value in Southwest Glades
- Median household income in 2022
- $59,395White non-Hispanic householders
- $38,299Black householders
- $44,419American Indian and Alaska Native householders
- $6,672Asian householders
- $56,091Some other race householders
- $42,557Two or more races householders
- $58,993Hispanic or Latino race householders
- Median 2022 house value
- $129,571White Non-Hispanic householders
- $123,873Black or African American householders
- $298,657American Indian or Alaska Native householders
- $137,841Asian householders
- $135,636Some other race householders
- $97,592Hispanic or Latino householders
Household income for White non-Hispanic householders

Household income for Black householders

Household income for American Indian and Alaska Native householders

Household income for Asian householders

Household income for Two or more races householders

Household income for Hispanic or Latino race householders

Zip code: 33471