Races in Southwest Chaves, New Mexico (NM) Detailed Stats
Ancestries, Foreign-born residents, place of birth
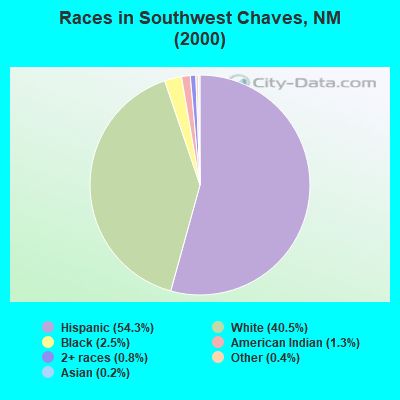
Race distribution in Southwest Chaves

- 3,32554.3%Hispanic
- 2,48140.5%White alone
- 1562.5%Black alone
- 821.3%American Indian alone
- 490.8%Two or more races
- 220.4%Other race alone
- 120.2%Asian alone
2000
2022
-
- 813,49544.7%White alone
- 765,38642.1%Hispanic
- 161,4608.9%American Indian alone
- 30,6541.7%Black alone
- 25,7931.4%Two or more races
- 18,2571.0%Asian alone
- 3,0090.2%Other race alone
- 9920.05%Native Hawaiian and Other
Pacific Islander alone

-
- 1,059,86750.2%Hispanic
- 735,47834.8%White alone
- 171,8088.1%American Indian alone
- 65,0843.1%Two or more races
- 36,8701.7%Black alone
- 35,8701.7%Asian alone
- 7,5820.4%Other race alone
- 7850.04%Native Hawaiian and Other
Pacific Islander alone

Income and house value in Southwest Chaves
- Median household income in 2022
- $57,753White non-Hispanic householders
- $30,254Black householders
- $29,813American Indian and Alaska Native householders
- $46,818Some other race householders
- $54,845Two or more races householders
- $41,050Hispanic or Latino race householders
- Median 2022 house value
- $122,679White Non-Hispanic householders
- $165,246Black or African American householders
- $145,416American Indian or Alaska Native householders
- $171,856Native Hawaiian and other Pacific Islander householders
- $103,113Some other race householders
- $74,823Two or more races householders
- $99,676Hispanic or Latino householders
Household income for White non-Hispanic householders

Household income for Black householders

Household income for American Indian and Alaska Native householders

Household income for Native Hawaiian and other Pacific Islander householders

Household income for Two or more races householders

Household income for Hispanic or Latino race householders

Zip code: 88232