Races in Southern Slopes, Washington (WA) Detailed Stats
Ancestries, Foreign-born residents, place of birth
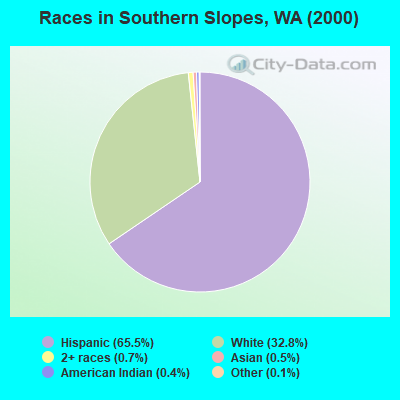
Race distribution in Southern Slopes

- 7,28065.5%Hispanic
- 3,64432.8%White alone
- 760.7%Two or more races
- 600.5%Asian alone
- 390.4%American Indian alone
- 150.1%Other race alone
- 60.05%Black alone
- 10.01%Native Hawaiian and Other
Pacific Islander alone
2000
2022
-
- 4,652,49078.9%White alone
- 441,5097.5%Hispanic
- 319,4015.4%Asian alone
- 184,6313.1%Black alone
- 175,9263.0%Two or more races
- 85,3961.4%American Indian alone
- 22,7790.4%Native Hawaiian and Other
Pacific Islander alone - 11,9890.2%Other race alone

-
- 4,941,45663.5%White alone
- 1,093,31314.0%Hispanic
- 755,8329.7%Asian alone
- 523,4486.7%Two or more races
- 299,5373.8%Black alone
- 69,0240.9%American Indian alone
- 52,2310.7%Native Hawaiian and Other
Pacific Islander alone - 50,9450.7%Other race alone

Income and house value in Southern Slopes
- Median household income in 2022
- $65,565White non-Hispanic householders
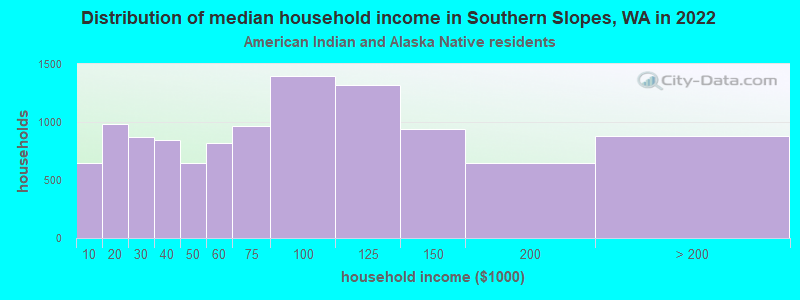
- $96,923American Indian and Alaska Native householders
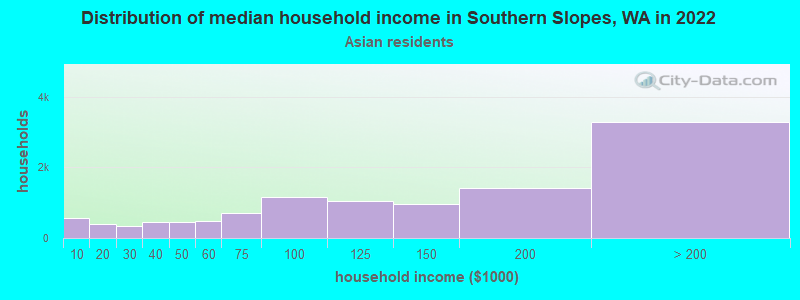
- $6,088Asian householders
- $65,430Some other race householders
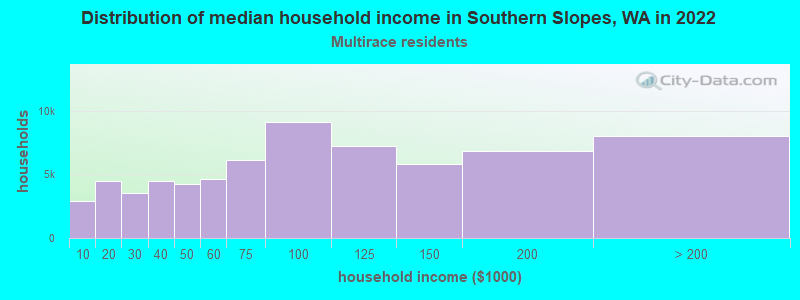
- $39,630Two or more races householders
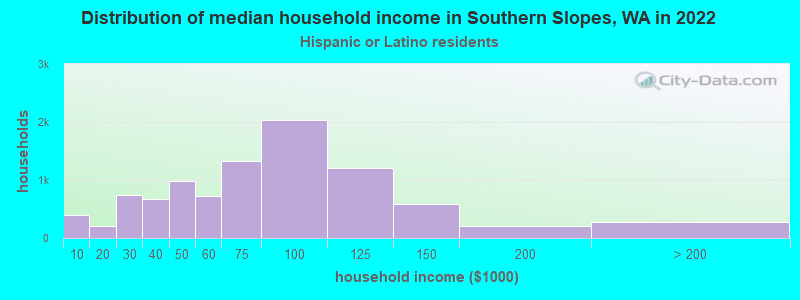
- $65,800Hispanic or Latino race householders
- Median 2022 house value
- $335,000White Non-Hispanic householders
- $214,595Some other race householders
- $228,617Two or more races householders
- $234,713Hispanic or Latino householders
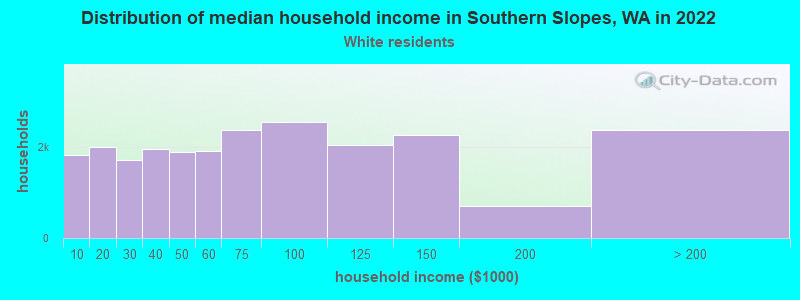
Household income for White non-Hispanic householders
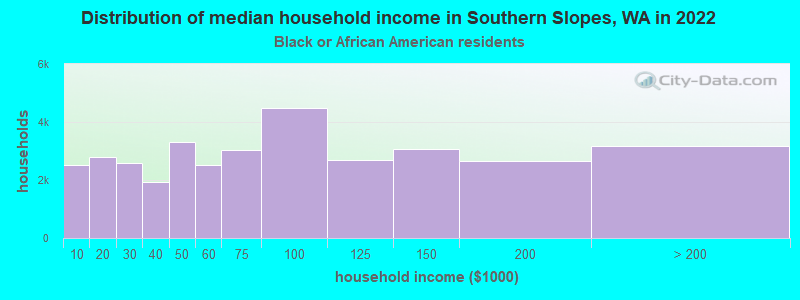
Household income for Black householders
Household income for American Indian and Alaska Native householders
Household income for Asian householders
Household income for Two or more races householders
Household income for Hispanic or Latino race householders
Zip code: 99349