Races in Southchase, Florida (FL) Detailed Stats
Data:
Races - White alone (%)
Races - White alone (% change since 2000)
Races - Black alone (%)
Races - Black alone (% change since 2000)
Races - American Indian alone (%)
Races - American Indian alone (% change since 2000)
Races - Asian alone (%)
Races - Asian alone (% change since 2000)
Races - Hispanic (%)
Races - Hispanic (% change since 2000)
Races - Native Hawaiian and Other Pacific Islander alone (%)
Races - Native Hawaiian and Other Pacific Islander alone (% change since 2000)
Races - Two or more races(%)
Races - Two or more races(% change since 2000)
Races - Other race alone (%)
Races - Other race alone (% change since 2000)
Racial diversity
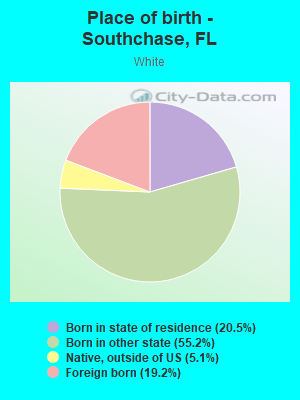
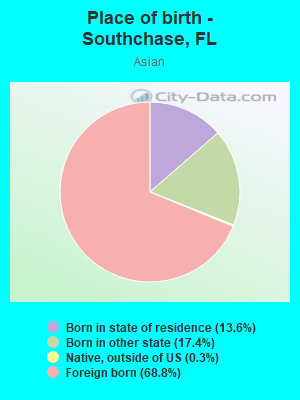
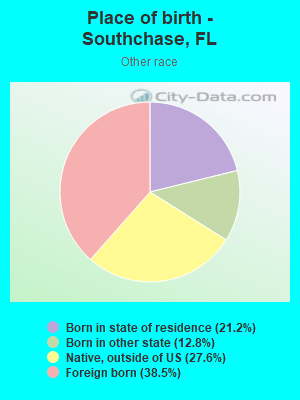
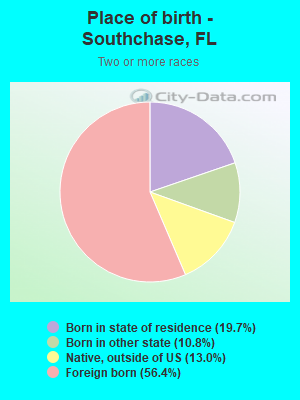
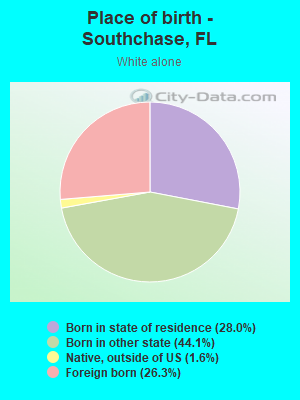
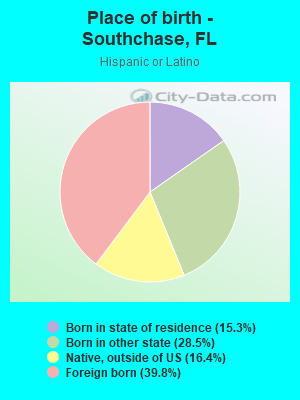
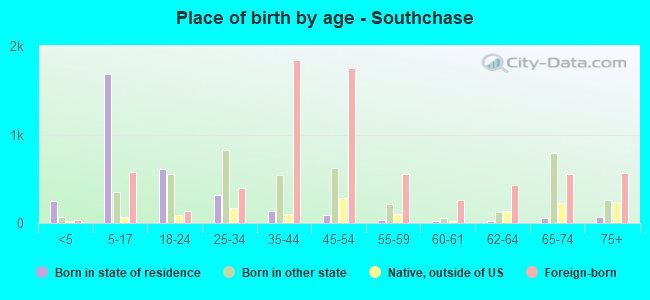
Place of birth - Born in state of residence (%)
Place of birth - Born in state of residence (%) - White
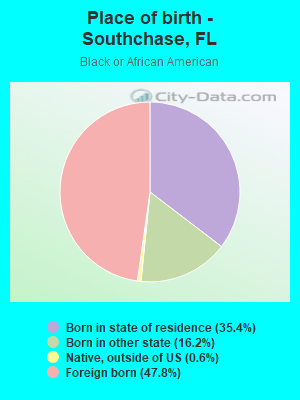
Place of birth - Born in state of residence (%) - Black or African American
Place of birth - Born in state of residence (%) - Asian
Place of birth - Born in state of residence (%) - Hispanic or Latino
Place of birth - Born in state of residence (%) - American Indian and Alaska Native
Place of birth - Born in state of residence (%) - Multirace
Place of birth - Born in state of residence (%) - Other Race
Place of birth - Born in other state (%)
Place of birth - Born in other state (%) - White
Place of birth - Born in other state (%) - Black or African American
Place of birth - Born in other state (%) - Asian
Place of birth - Born in other state (%) - Hispanic or Latino
Place of birth - Born in other state (%) - American Indian and Alaska Native
Place of birth - Born in other state (%) - Multirace
Place of birth - Born in other state (%) - Other Race
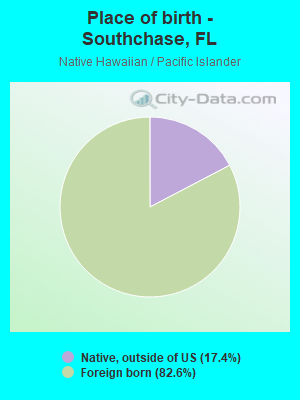
Place of birth - Native, outside of US (%)
Place of birth - Native, outside of US (%) - White
Place of birth - Native, outside of US (%) - Black or African American
Place of birth - Native, outside of US (%) - Asian
Place of birth - Native, outside of US (%) - Hispanic or Latino
Place of birth - Native, outside of US (%) - American Indian and Alaska Native
Place of birth - Native, outside of US (%) - Multirace
Place of birth - Native, outside of US (%) - Other Race
Place of birth - Foreign born (%)
Place of birth - Foreign born (%) - White
Place of birth - Foreign born (%) - Black or African American
Place of birth - Foreign born (%) - Asian
Place of birth - Foreign born (%) - Hispanic or Latino
Place of birth - Foreign born (%) - American Indian and Alaska Native
Place of birth - Foreign born (%) - Multirace
Place of birth - Foreign born (%) - Other Race
Residents speaking English at home (%)
Residents speaking English at home - Born in the United States (%)
Residents speaking English at home - Native, born elsewhere (%)
Residents speaking English at home - Foreign born (%)
Residents speaking Spanish at home (%)
Residents speaking Spanish at home - Born in the United States (%)
Residents speaking Spanish at home - Native, born elsewhere (%)
Residents speaking Spanish at home - Foreign born (%)
Residents speaking other language at home (%)
Residents speaking other language at home - Born in the United States (%)
Residents speaking other language at home - Native, born elsewhere (%)
Residents speaking other language at home - Foreign born (%)
Marital status - Never married (%)
Marital status - Now married (%)
Marital status - Separated (%)
Marital status - Widowed (%)
Marital status - Divorced (%)
Ancestries Reported - Arab (%)
Ancestries Reported - Czech (%)
Ancestries Reported - Danish (%)
Ancestries Reported - Dutch (%)
Ancestries Reported - English (%)
Ancestries Reported - French (%)
Ancestries Reported - French Canadian (%)
Ancestries Reported - German (%)
Ancestries Reported - Greek (%)
Ancestries Reported - Hungarian (%)
Ancestries Reported - Irish (%)
Ancestries Reported - Italian (%)
Ancestries Reported - Lithuanian (%)
Ancestries Reported - Norwegian (%)
Ancestries Reported - Polish (%)
Ancestries Reported - Portuguese (%)
Ancestries Reported - Russian (%)
Ancestries Reported - Scotch-Irish (%)
Ancestries Reported - Scottish (%)
Ancestries Reported - Slovak (%)
Ancestries Reported - Subsaharan African (%)
Ancestries Reported - Swedish (%)
Ancestries Reported - Swiss (%)
Ancestries Reported - Ukrainian (%)
Ancestries Reported - United States (%)
Ancestries Reported - Welsh (%)
Ancestries Reported - West Indian (%)
Ancestries Reported - Other (%)
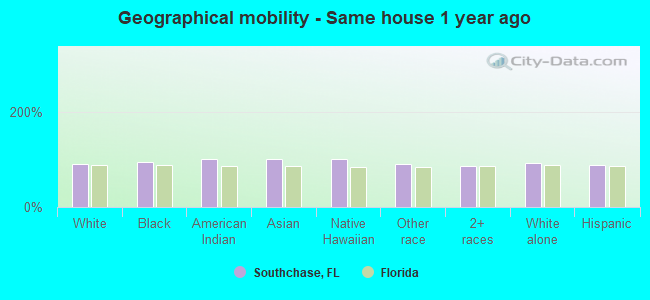
Geographical mobility - Same house 1 year ago (%)
Geographical mobility - Same house 1 year ago (%) - White
Geographical mobility - Same house 1 year ago (%) - Black or African American
Geographical mobility - Same house 1 year ago (%) - Asian
Geographical mobility - Same house 1 year ago (%) - Hispanic or Latino
Geographical mobility - Same house 1 year ago (%) - American Indian and Alaska Native
Geographical mobility - Same house 1 year ago (%) - Multirace
Geographical mobility - Same house 1 year ago (%) - Other Race
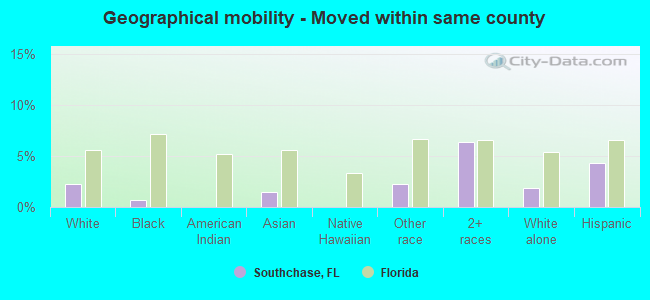
Geographical mobility - Moved within same county (%)
Geographical mobility - Moved within same county (%) - White
Geographical mobility - Moved within same county (%) - Black or African American
Geographical mobility - Moved within same county (%) - Asian
Geographical mobility - Moved within same county (%) - Hispanic or Latino
Geographical mobility - Moved within same county (%) - American Indian and Alaska Native
Geographical mobility - Moved within same county (%) - Multirace
Geographical mobility - Moved within same county (%) - Other Race
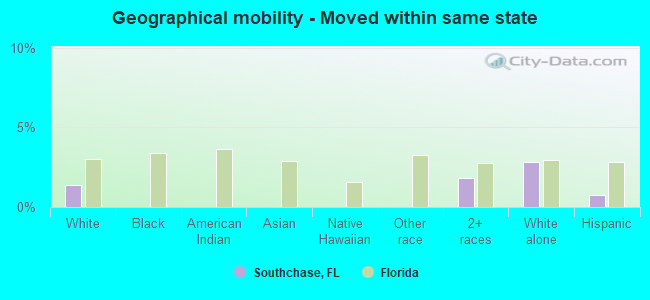
Geographical mobility - Moved from different county within same state (%)
Geographical mobility - Moved from different county within same state (%) - White
Geographical mobility - Moved from different county within same state (%) - Black or African American
Geographical mobility - Moved from different county within same state (%) - Asian
Geographical mobility - Moved from different county within same state (%) - Hispanic or Latino
Geographical mobility - Moved from different county within same state (%) - American Indian and Alaska Native
Geographical mobility - Moved from different county within same state (%) - Multirace
Geographical mobility - Moved from different county within same state (%) - Other Race
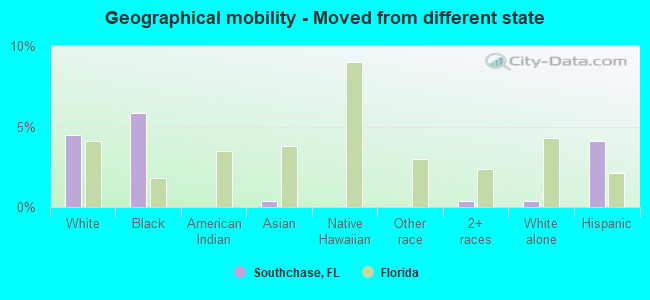
Geographical mobility - Moved from different state (%)
Geographical mobility - Moved from different state (%) - White
Geographical mobility - Moved from different state (%) - Black or African American
Geographical mobility - Moved from different state (%) - Asian
Geographical mobility - Moved from different state (%) - Hispanic or Latino
Geographical mobility - Moved from different state (%) - American Indian and Alaska Native
Geographical mobility - Moved from different state (%) - Multirace
Geographical mobility - Moved from different state (%) - Other Race
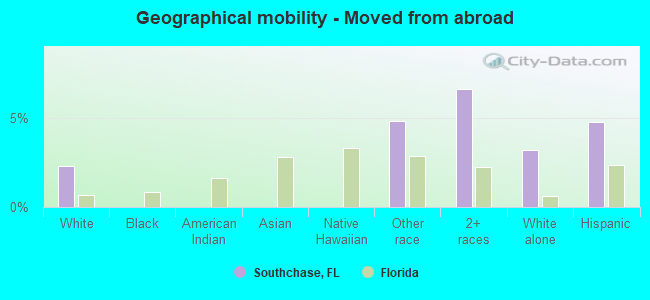
Geographical mobility - Moved from abroad (%)
Geographical mobility - Moved from abroad (%) - White
Geographical mobility - Moved from abroad (%) - Black or African American
Geographical mobility - Moved from abroad (%) - Asian
Geographical mobility - Moved from abroad (%) - Hispanic or Latino
Geographical mobility - Moved from abroad (%) - American Indian and Alaska Native
Geographical mobility - Moved from abroad (%) - Multirace
Geographical mobility - Moved from abroad (%) - Other Race
Place of birth for the foreign-born population - Ireland (%)
Place of birth for the foreign-born population - Denmark (%)
Place of birth for the foreign-born population - Norway (%)
Place of birth for the foreign-born population - Sweden (%)
Place of birth for the foreign-born population - United Kingdom (%)
Place of birth for the foreign-born population - England (%)
Place of birth for the foreign-born population - Scotland (%)
Place of birth for the foreign-born population - Other Northern Europe (%)
Place of birth for the foreign-born population - Austria (%)
Place of birth for the foreign-born population - Belgium (%)
Place of birth for the foreign-born population - France (%)
Place of birth for the foreign-born population - Germany (%)
Place of birth for the foreign-born population - Netherlands (%)
Place of birth for the foreign-born population - Switzerland (%)
Place of birth for the foreign-born population - Other Western Europe (%)
Place of birth for the foreign-born population - Greece (%)
Place of birth for the foreign-born population - Italy (%)
Place of birth for the foreign-born population - Portugal (%)
Place of birth for the foreign-born population - Spain (%)
Place of birth for the foreign-born population - Other Southern Europe (%)
Place of birth for the foreign-born population - Albania (%)
Place of birth for the foreign-born population - Belarus (%)
Place of birth for the foreign-born population - Bosnia and Herzegovina (%)
Place of birth for the foreign-born population - Bulgaria (%)
Place of birth for the foreign-born population - Croatia (%)
Place of birth for the foreign-born population - Czechoslovakia (%)
Place of birth for the foreign-born population - Hungary (%)
Place of birth for the foreign-born population - Latvia (%)
Place of birth for the foreign-born population - Lithuania (%)
Place of birth for the foreign-born population - North Macedonia (Macedonia) (%)
Place of birth for the foreign-born population - Moldova (%)
Place of birth for the foreign-born population - Poland (%)
Place of birth for the foreign-born population - Romania (%)
Place of birth for the foreign-born population - Russia (%)
Place of birth for the foreign-born population - Serbia (%)
Place of birth for the foreign-born population - Ukraine (%)
Place of birth for the foreign-born population - Other Eastern Europe (%)
Place of birth for the foreign-born population - China (%)
Place of birth for the foreign-born population - Hong Kong (%)
Place of birth for the foreign-born population - Taiwan (%)
Place of birth for the foreign-born population - Japan (%)
Place of birth for the foreign-born population - Korea (%)
Place of birth for the foreign-born population - Other Eastern Asia (%)
Place of birth for the foreign-born population - Afghanistan (%)
Place of birth for the foreign-born population - Bangladesh (%)
Place of birth for the foreign-born population - India (%)
Place of birth for the foreign-born population - Iran (%)
Place of birth for the foreign-born population - Kazakhstan (%)
Place of birth for the foreign-born population - Nepal (%)
Place of birth for the foreign-born population - Pakistan (%)
Place of birth for the foreign-born population - Sri Lanka (%)
Place of birth for the foreign-born population - Uzbekistan (%)
Place of birth for the foreign-born population - Other South Central Asia (%)
Place of birth for the foreign-born population - Burma (%)
Place of birth for the foreign-born population - Cambodia (%)
Place of birth for the foreign-born population - Indonesia (%)
Place of birth for the foreign-born population - Laos (%)
Place of birth for the foreign-born population - Malaysia (%)
Place of birth for the foreign-born population - Philippines (%)
Place of birth for the foreign-born population - Singapore (%)
Place of birth for the foreign-born population - Thailand (%)
Place of birth for the foreign-born population - Vietnam (%)
Place of birth for the foreign-born population - Other South Eastern Asia (%)
Place of birth for the foreign-born population - Armenia (%)
Place of birth for the foreign-born population - Iraq (%)
Place of birth for the foreign-born population - Israel (%)
Place of birth for the foreign-born population - Jordan (%)
Place of birth for the foreign-born population - Kuwait (%)
Place of birth for the foreign-born population - Lebanon (%)
Place of birth for the foreign-born population - Saudi Arabia (%)
Place of birth for the foreign-born population - Syria (%)
Place of birth for the foreign-born population - Turkey (%)
Place of birth for the foreign-born population - Yemen (%)
Place of birth for the foreign-born population - Other Western Asia (%)
Place of birth for the foreign-born population - Eritrea (%)
Place of birth for the foreign-born population - Ethiopia (%)
Place of birth for the foreign-born population - Kenya (%)
Place of birth for the foreign-born population - Somalia (%)
Place of birth for the foreign-born population - Uganda (%)
Place of birth for the foreign-born population - Zimbabwe (%)
Place of birth for the foreign-born population - Other Eastern Africa (%)
Place of birth for the foreign-born population - Cameroon (%)
Place of birth for the foreign-born population - Congo (%)
Place of birth for the foreign-born population - Democratic Republic of Congo (Zaire) (%)
Place of birth for the foreign-born population - Other Middle Africa (%)
Place of birth for the foreign-born population - Egypt (%)
Place of birth for the foreign-born population - Morocco (%)
Place of birth for the foreign-born population - Sudan (%)
Place of birth for the foreign-born population - Other Northern Africa (%)
Place of birth for the foreign-born population - South Africa (%)
Place of birth for the foreign-born population - Other Southern Africa (%)
Place of birth for the foreign-born population - Cabo Verde (%)
Place of birth for the foreign-born population - Ghana (%)
Place of birth for the foreign-born population - Liberia (%)
Place of birth for the foreign-born population - Nigeria (%)
Place of birth for the foreign-born population - Senegal (%)
Place of birth for the foreign-born population - Sierra Leone (%)
Place of birth for the foreign-born population - Other Western Africa (%)
Place of birth for the foreign-born population - Australia (%)
Place of birth for the foreign-born population - New Zealand (%)
Place of birth for the foreign-born population - Fiji (%)
Place of birth for the foreign-born population - Micronesia (%)
Place of birth for the foreign-born population - Bahamas (%)
Place of birth for the foreign-born population - Barbados (%)
Place of birth for the foreign-born population - Cuba (%)
Place of birth for the foreign-born population - Dominica (%)
Place of birth for the foreign-born population - Dominican Republic (%)
Place of birth for the foreign-born population - Grenada (%)
Place of birth for the foreign-born population - Haiti (%)
Place of birth for the foreign-born population - Jamaica (%)
Place of birth for the foreign-born population - St. Vincent and the Grenadines (%)
Place of birth for the foreign-born population - Trinidad and Tobago (%)
Place of birth for the foreign-born population - West Indies (%)
Place of birth for the foreign-born population - Other Caribbean (%)
Place of birth for the foreign-born population - Belize (%)
Place of birth for the foreign-born population - Costa Rica (%)
Place of birth for the foreign-born population - El Salvador (%)
Place of birth for the foreign-born population - Guatemala (%)
Place of birth for the foreign-born population - Honduras (%)
Place of birth for the foreign-born population - Mexico (%)
Place of birth for the foreign-born population - Nicaragua (%)
Place of birth for the foreign-born population - Panama (%)
Place of birth for the foreign-born population - Other Central America (%)
Place of birth for the foreign-born population - Argentina (%)
Place of birth for the foreign-born population - Bolivia (%)
Place of birth for the foreign-born population - Brazil (%)
Place of birth for the foreign-born population - Chile (%)
Place of birth for the foreign-born population - Colombia (%)
Place of birth for the foreign-born population - Ecuador (%)
Place of birth for the foreign-born population - Guyana (%)
Place of birth for the foreign-born population - Peru (%)
Place of birth for the foreign-born population - Uruguay (%)
Place of birth for the foreign-born population - Venezuela (%)
Place of birth for the foreign-born population - Other South America (%)
Place of birth for the foreign-born population - Canada (%)
Place of birth for the foreign-born population - Other Northern America (%)
Place of birth for the foreign-born population - Other (%)
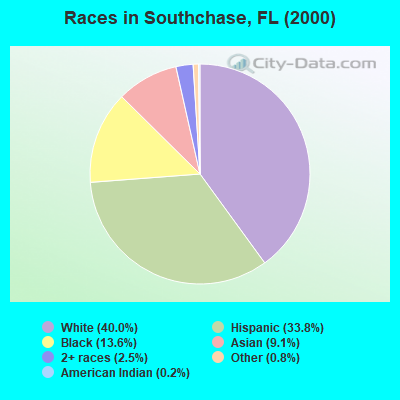
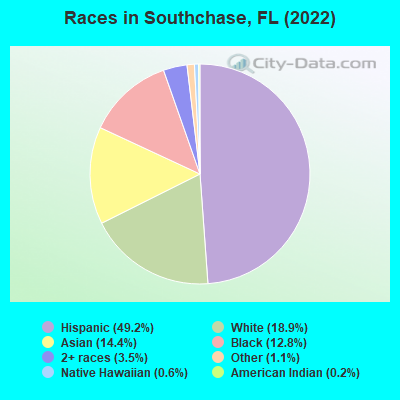
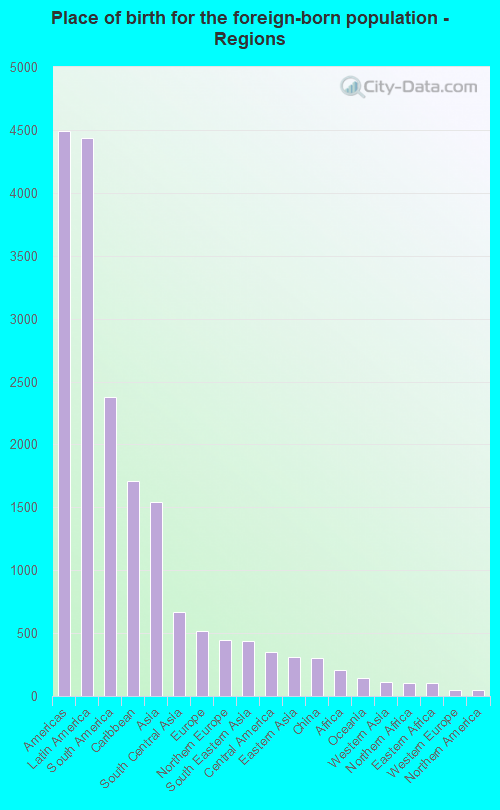
According to 2022 data, the most numerous races in Southchase, FL are White alone (3,001 residents), Hispanic (7,793 residents), and Black alone (2,033 residents). 41.1% of Southchase residents speak English at home. 43.5% of Southchase, FL residents are foreign-born (27.1% born in Latin America, 9.4% born in Asia), which is 51.8% greater than the foreign-born rate of 21.0% across the entire state of Florida.
Race distribution in Southchase
2000 2022
10,458,509 65.4% White alone 2,682,715 16.8% Hispanic 2,264,268 14.2% Black alone 261,693 1.6% Asian alone 236,954 1.5% Two or more races 42,358 0.3% American Indian alone 28,994 0.2% Other race alone 6,887 0.04% Native Hawaiian and Other
11,309,403 50.8% White alone 6,025,039 27.1% Hispanic 3,241,015 14.6% Black alone 861,630 3.9% Two or more races 623,692 2.8% Asian alone 152,054 0.7% Other race alone 22,504 0.1% American Indian alone 9,486 0.04% Native Hawaiian and Other
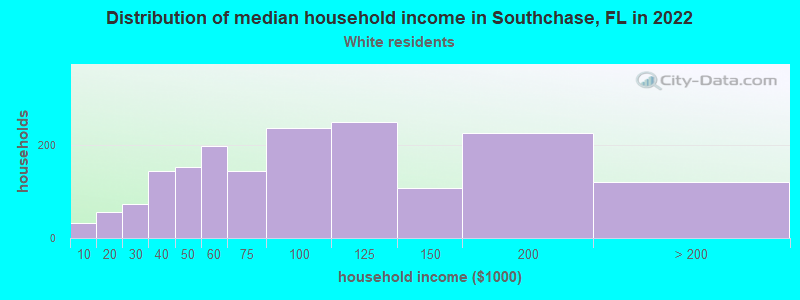
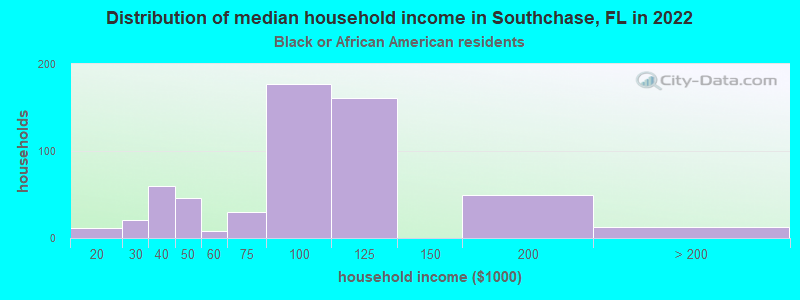
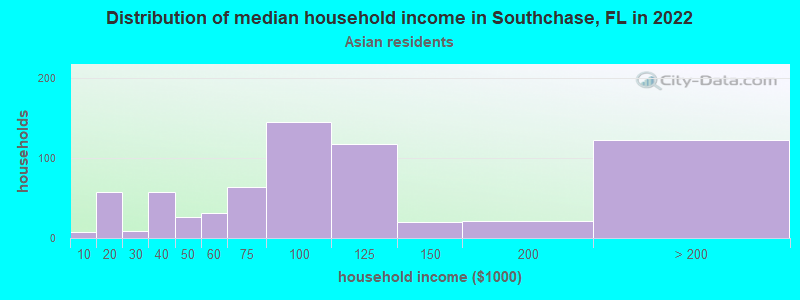
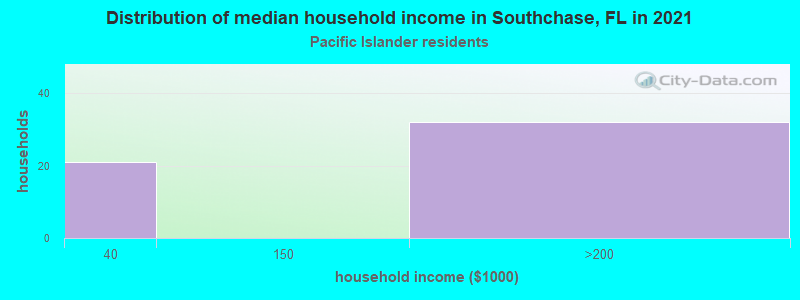
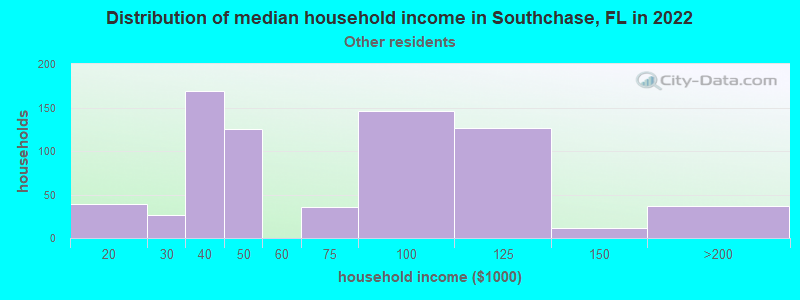
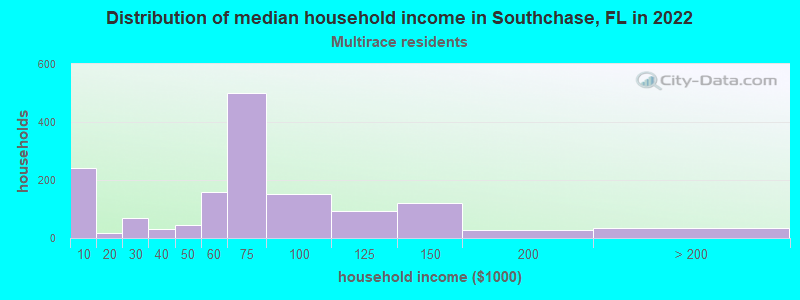
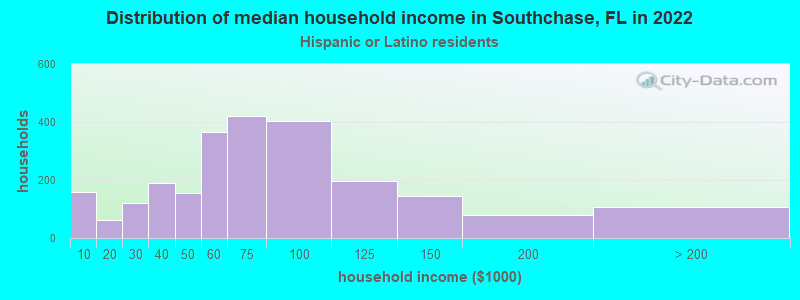
Income and house value in Southchase Median household income in 2022 $95,661 White non-Hispanic householders$89,078 Black householders$86,946 Asian householders$63,675 Two or more races householders$65,307 Hispanic or Latino race householdersMedian 2022 house value $376,150 White Non-Hispanic householders$380,473 Black or African American householders $300,758 Asian householders$347,236 Some other race householders$333,995 Two or more races householders$354,262 Hispanic or Latino householders
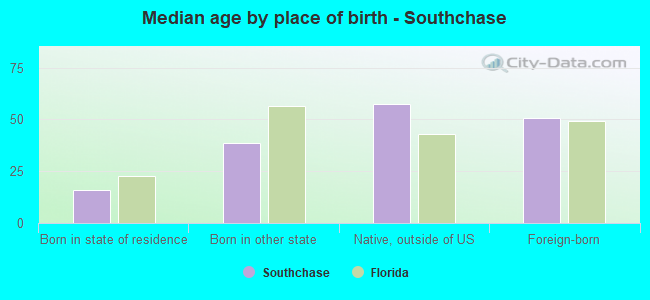
Median age by race in Southchase
45.3 Median age for White residents40.3 50.7 45.0 Median age for Black or African American residents47.1 44.8 -614,300,100.1 Median age for American Indian / Alaska Native residents-735,632,183.2 -529,680,364.8 45.3 Median age for Asian residents45.5 42.2 36.2 Median age for Native Hawaiian / Pacific Islander residents-1,327,635,326.3 29.7 41.4 Median age for Other race residents38.7 41.6 43.6 Median age for Two or more races residents42.0 45.1 47.3 Median age for White alone residents42.7 52.1 41.4 Median age for Hispanic or Latino residents39.2 41.9
Owner/renter occupied households by race in Southchase
House owners and renters - White residents 1,327 75.5% Owner occupied430 24.5% Renter occupiedHouse owners and renters - Black or African American residents 522 88.0% Owner occupied71 12.0% Renter occupiedHouse owners and renters - American Indian / Alaska Native residents 62 100.0% Renter occupiedHouse owners and renters - Asian residents 676 93.0% Owner occupied51 7.0% Renter occupiedHouse owners and renters - Native Hawaiian / Pacific Islander residents 52 100.0% Owner occupiedHouse owners and renters - Other race residents 373 49.4% Owner occupied383 50.6% Renter occupiedHouse owners and renters - Two or more races residents 1,146 75.6% Owner occupied369 24.4% Renter occupiedHouse owners and renters - White alone residents 890 83.7% Owner occupied173 16.3% Renter occupiedHouse owners and renters - Hispanic or Latino residents 1,545 64.1% Owner occupied866 35.9% Renter occupied
Language usage in Southchase
English speakers - Total 41.1% of residents of Southchase speak English at home.
40.0% of residents speak Spanish at home 3,775 60.9% Speak English very well2,427 39.1% Speak English less than very well19.0% of residents speak other language at home 1,690 57.3% Speak English very well1,260 42.7% Speak English less than very well
English speakers - Born in the United States 62.2% of residents of Southchase speak English at home.
34.5% of residents speak Spanish at home 1,398 93.6% Speak English very well96 6.4% Speak English less than very well3.6% of residents speak other language at home 158 100.0% Speak English very well
English speakers - Native, born elsewhere 9.0% of residents of Southchase speak English at home.
90.5% of residents speak Spanish at home 852 68.5% Speak English very well391 31.5% Speak English less than very well0.4% of residents speak other language at home 5 100.0% Speak English very well
English speakers - Foreign-born 20.6% of residents of Southchase speak English at home.
43.6% of residents speak Spanish at home 1,153 38.0% Speak English very well1,885 62.0% Speak English less than very well35.9% of residents speak other language at home 1,300 52.0% Speak English very well1,199 48.0% Speak English less than very well
White (Caucasian) - Speak only English Native:
67.7% (2,834)Foreign-born:
34.5% (347)
White (Caucasian) - Speak another language Native:
21.1% (883)Foreign-born:
68.5% (688)
Black or African American - Speak only English Native:
93.5% (991)Foreign-born:
34.8% (349)
Black or African American - Speak another language Native:
5.8% (62)Foreign-born:
63.6% (637)
Asian - Speak only English Native:
52.0% (330)Foreign-born:
15.9% (251)
Asian - Speak another language Native:
46.2% (293)Foreign-born:
83.1% (1,314)
Native Hawaiian / Pacific Islander - Speak only English Native:
87.6% (22)Foreign-born:
100.0% (77)
Other race - Speak only English Native:
7.1% (81)Foreign-born:
9.5% (68)
Other race - Speak another language Native:
89.6% (1,020)Foreign-born:
89.7% (641)
Two or more races - Speak only English Native:
42.1% (832)Foreign-born:
7.2% (191)
Two or more races - Speak another language Native:
58.2% (1,151)Foreign-born:
92.9% (2,455)
White alone - Speak only English Native:
90.9% (1,963)Foreign-born:
50.6% (404)
White alone - Speak another language Native:
8.7% (187)Foreign-born:
41.5% (331)
Hispanic or Latino - Speak only English Native:
33.6% (1,541)Foreign-born:
1.6% (50)
Hispanic or Latino - Speak another language Native:
65.9% (3,022)Foreign-born:
98.9% (3,036)
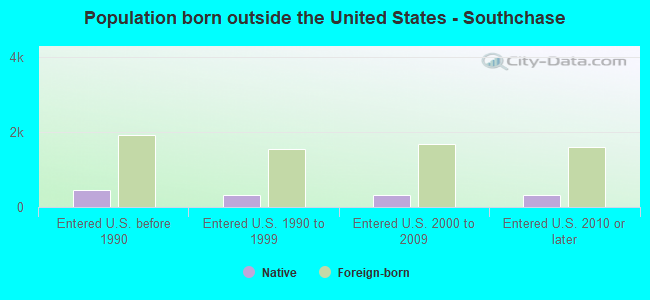
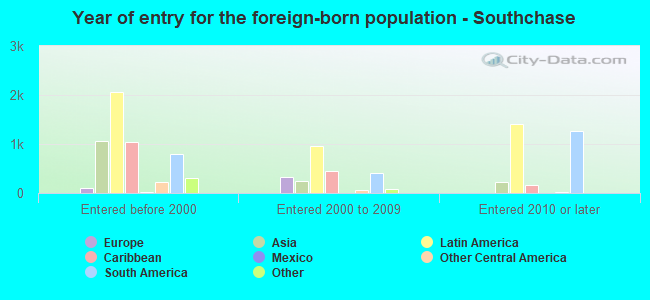
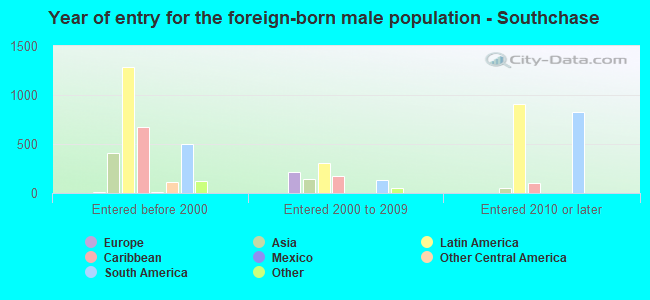
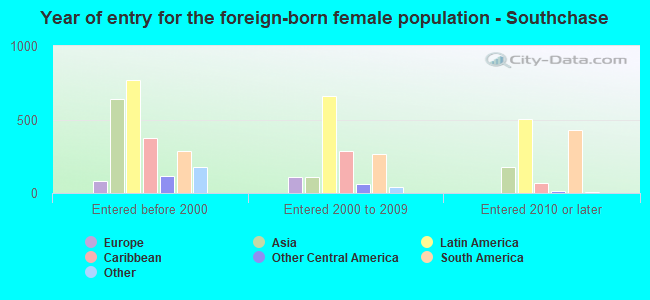
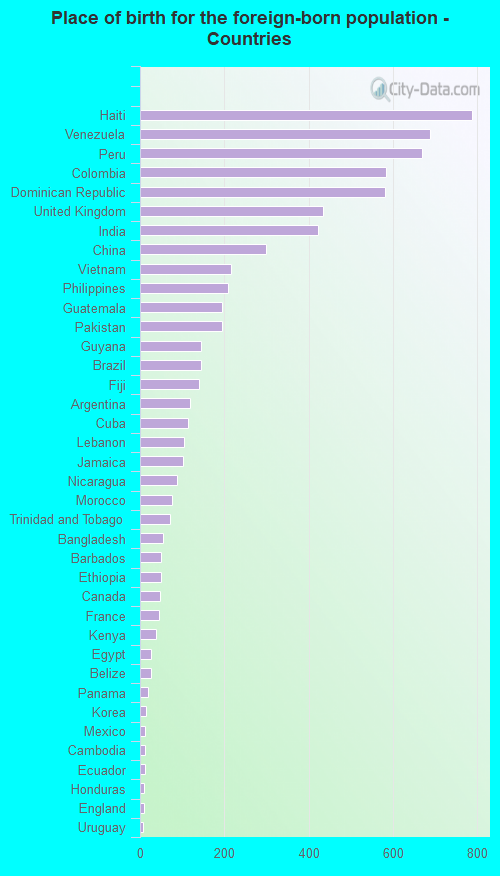
Foreign-born residents in Southchase 6,899 residents are foreign born (27.1% Latin America , 9.4% Asia ).
This city:
43.5%Florida:
21.1%
Marital status for residents in Southchase Marital status - White (Caucasian) population 15 years and over
Males 36.9% Never married52.9% Now married4.8% Separated0.0% Widowed5.4% DivorcedFemales 23.9% Never married55.9% Now married5.7% Separated6.7% Widowed7.8% DivorcedWomen who gave birth in the past 12 months Now married:
100.0% (14)Unmarried:
0.0% (0)
Women who did not give birth in the past 12 months Now married:
52.8% (589)Unmarried:
47.2% (526)
Marital status - Black or African American population 15 years and over
Males 38.4% Never married42.7% Now married16.4% Separated2.4% Widowed0.0% DivorcedFemales 31.9% Never married54.1% Now married0.0% Separated5.3% Widowed8.7% DivorcedWomen who did not give birth in the past 12 months Now married:
47.8% (198)Unmarried:
52.2% (216)
Marital status - Asian population 15 years and over
Males 14.3% Never married82.8% Now married0.0% Separated0.0% Widowed2.9% DivorcedFemales 20.8% Never married57.7% Now married0.6% Separated15.3% Widowed5.6% DivorcedWomen who gave birth in the past 12 months Now married:
100.0% (39)Unmarried:
0.0% (0)
Women who did not give birth in the past 12 months Now married:
54.2% (317)Unmarried:
45.8% (269)
Marital status - Native Hawaiian / Pacific Islander population 15 years and over
Males 0.0% Never married100.0% Now married0.0% Separated0.0% Widowed0.0% DivorcedFemales 61.5% Never married18.3% Now married0.0% Separated0.0% Widowed20.2% DivorcedWomen who did not give birth in the past 12 months Now married:
0.0% (0)Unmarried:
100.0% (67)
Marital status - Other race population 15 years and over
Males 38.9% Never married55.3% Now married0.0% Separated0.0% Widowed5.9% DivorcedFemales 37.2% Never married33.2% Now married20.3% Separated2.9% Widowed6.5% DivorcedWomen who gave birth in the past 12 months Now married:
100.0% (10)Unmarried:
0.0% (0)
Women who did not give birth in the past 12 months Now married:
38.3% (178)Unmarried:
61.7% (287)
Marital status - Two or more races population 15 years and over
Males 31.5% Never married62.4% Now married0.7% Separated2.1% Widowed3.3% DivorcedFemales 24.0% Never married59.7% Now married0.0% Separated5.1% Widowed11.2% DivorcedWomen who gave birth in the past 12 months Now married:
100.0% (29)Unmarried:
0.0% (0)
Women who did not give birth in the past 12 months Now married:
53.6% (640)Unmarried:
46.4% (554)
Marital status - White alone, not Hispanic / Latino population 15 years and over
Males 36.6% Never married57.2% Now married0.0% Separated0.0% Widowed6.2% DivorcedFemales 20.7% Never married58.4% Now married0.0% Separated11.4% Widowed9.5% DivorcedWomen who gave birth in the past 12 months Now married:
100.0% (16)Unmarried:
0.0% (0)
Women who did not give birth in the past 12 months Now married:
59.3% (324)Unmarried:
40.7% (222)
Marital status - Hispanic or Latino population 15 years and over
Males 36.3% Never married54.8% Now married5.0% Separated0.0% Widowed4.0% DivorcedFemales 26.0% Never married54.1% Now married8.7% Separated3.6% Widowed7.6% DivorcedWomen who gave birth in the past 12 months Now married:
100.0% (20)Unmarried:
0.0% (0)
Women who did not give birth in the past 12 months Now married:
51.2% (951)Unmarried:
48.8% (906)
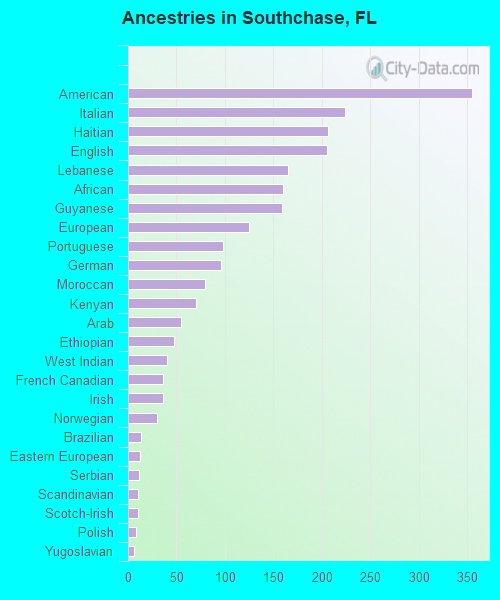
Ancestries in Southchase
355 3.7% American224 2.3% Italian206 2.1% Haitian205 2.1% English165 1.7% Lebanese160 1.7% African159 1.7% Guyanese125 1.3% European98 1.0% Portuguese96 1.0% German80 0.8% Moroccan70 0.7% Kenyan55 0.6% Arab48 0.5% Ethiopian40 0.4% West Indian36 0.4% French Canadian36 0.4% Irish30 0.3% Norwegian13 0.1% Brazilian12 0.1% Eastern European11 0.1% Serbian10 0.1% Scandinavian10 0.1% Scotch-Irish8 0.08% Polish6 0.06% Yugoslavian5 0.05% Egyptian5 0.05% Austrian4 0.04% Dutch4 0.04% French3 0.03% Hungarian
Geographical mobility in Southchase Same house 1 year ago 4,915 90.0% White (Caucasian)1,932 94.5% Black or African American66 100.0% American Indian / Alaska Native2,334 100.0% Asian152 100.0% Native Hawaiian / Pacific Islander1,698 90.8% Other race4,043 85.9% Two or more races2,759 92.1% White alone, not Hispanic / Latino6,744 86.9% Hispanic or LatinoMoved within same county 121 2.2% White / Caucasian15 0.7% Black or African American35 1.5% Asian41 2.2% Other race298 6.3% Two or more races54 1.8% White alone, not Hispanic / Latino335 4.3% Hispanic or LatinoMoved within same state 75 1.4% White / Caucasian85 1.8% Two or more races84 2.8% White alone, not Hispanic / Latino58 0.7% Hispanic or LatinoMoved from different state 243 4.4% White / Caucasian120 5.9% Black or African American9 0.4% Asian17 0.4% Two or more races11 0.4% White alone, not Hispanic / Latino318 4.1% Hispanic or LatinoMoved from abroad 125 2.3% White90 4.8% Other race312 6.6% Two or more races95 3.2% White alone, not Hispanic / Latino370 4.8% Hispanic or Latino
Children Nativity (place of birth) in Southchase
Children under 6 years - Living with two parents Both parents native 62 100.0% NativeBoth parents foreign-born 161 64.8% Native87 35.2% Foreign-bornOne native, one foreign-born parent 51 100.0% NativeChildren under 6 years - Living with one parent Native parent 95 100.0% NativeForeign-born parent 40 100.0% NativeChildren 6 to 17 years - Living with two parents Both parents native 335 99.4% Native2 0.6% Foreign-bornBoth parents foreign-born 210 36.4% Native367 63.6% Foreign-bornOne native, one foreign-born parent 90 95.3% Native4 4.7% Foreign-bornChildren 6 to 17 years - Living with one parent Native parent 374 100.0% NativeForeign-born parent 606 55.3% Native490 44.7% Foreign-born
Grandparents responsible for own grandchildren in Southchase
Grandparents (30 to 59 years) White / Caucasian 51 100.0% Not responsible for grandchildrenAsian 85 100.0% Not responsible for grandchildrenNative Hawaiian / Pacific Islander 41 100.0% Not responsible for grandchildrenOther race 13 100.0% Not responsible for grandchildrenTwo or more races 128 100.0% Not responsible for grandchildrenWhite alone, not Hispanic / Latino 21 100.0% Not responsible for grandchildrenHispanic or Latino 128 100.0% Not responsible for grandchildrenGrandparents (60 years and over) White / Caucasian 7 2.8% Responsible for grandchildren230 97.2% Not responsible for grandchildrenAsian 44 100.0% Not responsible for grandchildrenOther race 62 100.0% Responsible for grandchildrenTwo or more races 123 100.0% Not responsible for grandchildrenWhite alone, not Hispanic / Latino 10 24.4% Responsible for grandchildren30 75.6% Not responsible for grandchildrenHispanic or Latino 28 6.5% Responsible for grandchildren396 93.5% Not responsible for grandchildren