Races in South and East Osceola, Florida (FL) Detailed Stats
Ancestries, Foreign-born residents, place of birth
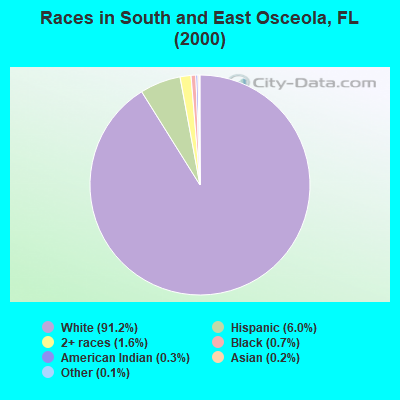
Race distribution in South and East Osceola

- 4,51591.2%White alone
- 2956.0%Hispanic
- 781.6%Two or more races
- 330.7%Black alone
- 150.3%American Indian alone
- 80.2%Asian alone
- 60.1%Other race alone
2000
2022
-
- 10,458,50965.4%White alone
- 2,682,71516.8%Hispanic
- 2,264,26814.2%Black alone
- 261,6931.6%Asian alone
- 236,9541.5%Two or more races
- 42,3580.3%American Indian alone
- 28,9940.2%Other race alone
- 6,8870.04%Native Hawaiian and Other
Pacific Islander alone

-
- 11,309,40350.8%White alone
- 6,025,03927.1%Hispanic
- 3,241,01514.6%Black alone
- 861,6303.9%Two or more races
- 623,6922.8%Asian alone
- 152,0540.7%Other race alone
- 22,5040.1%American Indian alone
- 9,4860.04%Native Hawaiian and Other
Pacific Islander alone

Income and house value in South and East Osceola
- Median household income in 2022
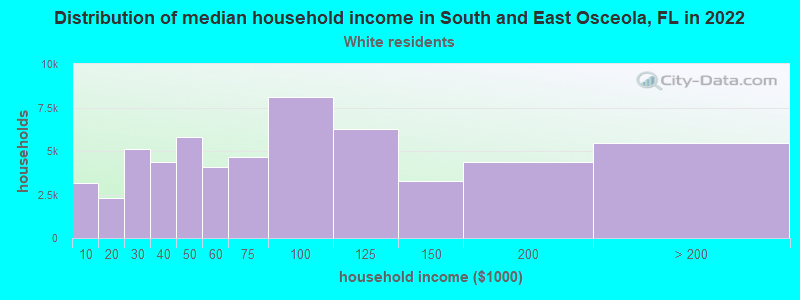
- $70,882White non-Hispanic householders
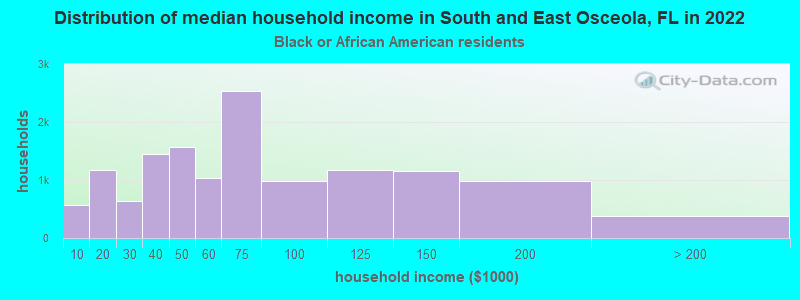
- $47,869Black householders
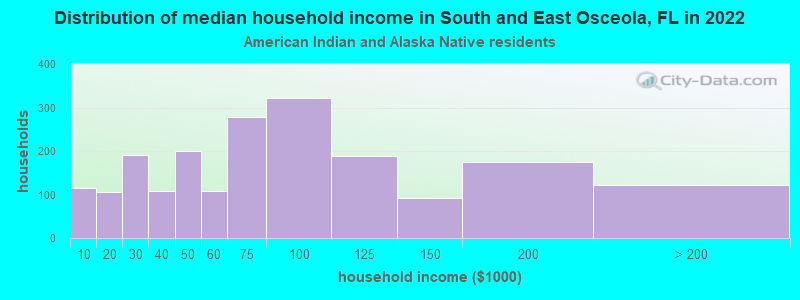
- $15,684American Indian and Alaska Native householders
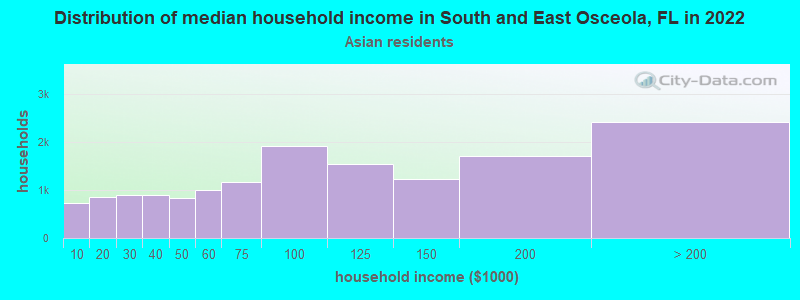
- $14,160Asian householders
- $134,743Some other race householders
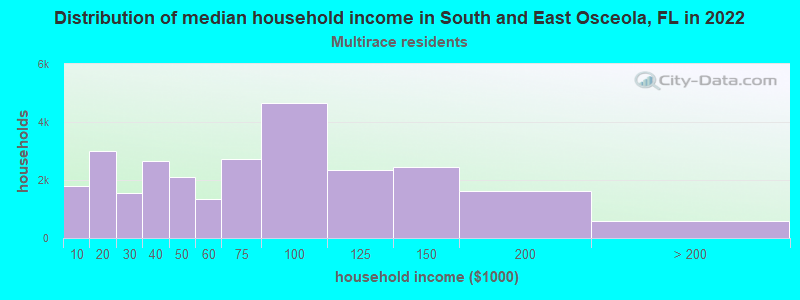
- $56,813Two or more races householders
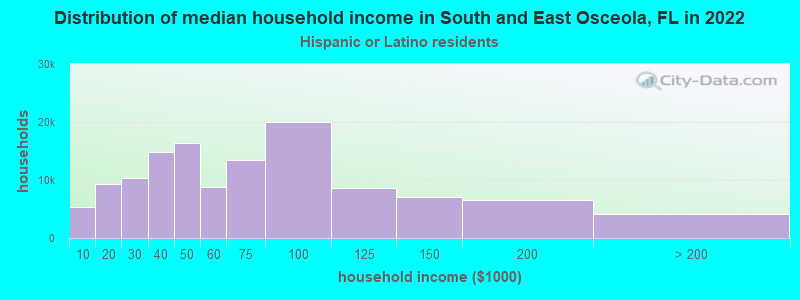
- $85,926Hispanic or Latino race householders
- Median 2022 house value
- $491,285White Non-Hispanic householders
- $421,905American Indian or Alaska Native householders
- $206,264Asian householders
- $586,167Two or more races householders
- $550,164Hispanic or Latino householders
Household income for White non-Hispanic householders
Household income for Black householders
Household income for American Indian and Alaska Native householders
Household income for Asian householders
Household income for Two or more races householders
Household income for Hispanic or Latino race householders
Zip code: 34773