Races in South Windsor, Connecticut (CT) Detailed Stats
Ancestries, Foreign-born residents, place of birth

Discuss South Windsor, Connecticut races on our local forum with over 2,400,000 registered users
9.9% of South Windsor, CT residents are foreign-born (3.6% born in Europe, 2.7% born in Asia, 1.6% born in North America, 1.6% born in Latin America), which is 51.5% less than the foreign-born rate of 15.0% across the entire state of Connecticut.
Race distribution in South Windsor

- 21,98790.1%White alone
- 8983.7%Asian alone
- 7052.9%Black alone
- 5542.3%Hispanic
- 2050.8%Two or more races
- 390.2%American Indian alone
- 170.07%Other race alone
- 70.03%Native Hawaiian and Other
Pacific Islander alone

2000
2022
-
- 2,638,84577.5%White alone
- 320,3239.4%Hispanic
- 295,5718.7%Black alone
- 81,5642.4%Asian alone
- 52,8961.6%Two or more races
- 8,1410.2%Other race alone
- 7,2670.2%American Indian alone
- 9580.03%Native Hawaiian and Other
Pacific Islander alone

-
- 2,246,91362.0%White alone
- 658,97818.2%Hispanic
- 353,9739.8%Black alone
- 172,9294.8%Asian alone
- 159,6314.4%Two or more races
- 29,7610.8%Other race alone
- 3,4280.09%American Indian alone
- 5920.02%Native Hawaiian and Other
Pacific Islander alone

Income and house value in South Windsor
- Median household income in 2022
- $124,103White non-Hispanic householders
- $126,579Black householders
- $95,334American Indian and Alaska Native householders
- $130,925Asian householders
- $115,419Some other race householders
- $133,364Two or more races householders
- $116,256Hispanic or Latino race householders
- Median 2022 house value
- $361,036White Non-Hispanic householders
- $368,386Black or African American householders
- $324,283American Indian or Alaska Native householders
- $505,666Asian householders
- $305,043Some other race householders
- $243,212Two or more races householders
- $352,820Hispanic or Latino householders
Household income for White non-Hispanic householders

Household income for Black householders

Household income for American Indian and Alaska Native householders

Household income for Asian householders

Household income for Two or more races householders

Household income for Hispanic or Latino race householders

Foreign-born residents in South Windsor
2,417 residents are foreign born (3.6% Europe, 2.7% Asia, 1.6% North America, 1.6% Latin America).
| This city: | 9.9% |
| Connecticut: | 10.9% |
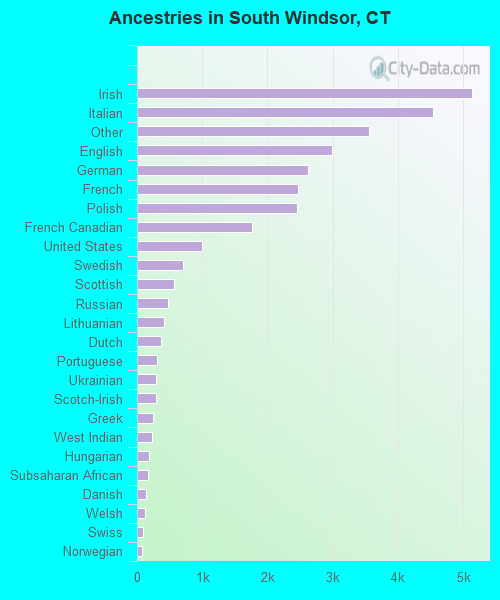
Ancestries in South Windsor

- 5,13816.4%Irish
- 4,53614.5%Italian
- 3,56311.4%Other
- 2,9929.5%English
- 2,6208.3%German
- 2,4647.9%French
- 2,4457.8%Polish
- 1,7685.6%French Canadian
- 9923.2%United States
- 7052.2%Swedish
- 5611.8%Scottish
- 4811.5%Russian
- 4131.3%Lithuanian
- 3751.2%Dutch
- 3011.0%Portuguese
- 2950.9%Ukrainian
- 2860.9%Scotch-Irish
- 2480.8%Greek
- 2340.7%West Indian
- 1890.6%Hungarian
- 1670.5%Subsaharan African
- 1380.4%Danish
- 1300.4%Welsh
- 990.3%Swiss
- 770.2%Norwegian
- 590.2%Czech
- 540.2%Arab
- 520.2%Slovak
Zip codes: 06074.