Races in South St. Paul, Minnesota (MN) Detailed Stats
Data:
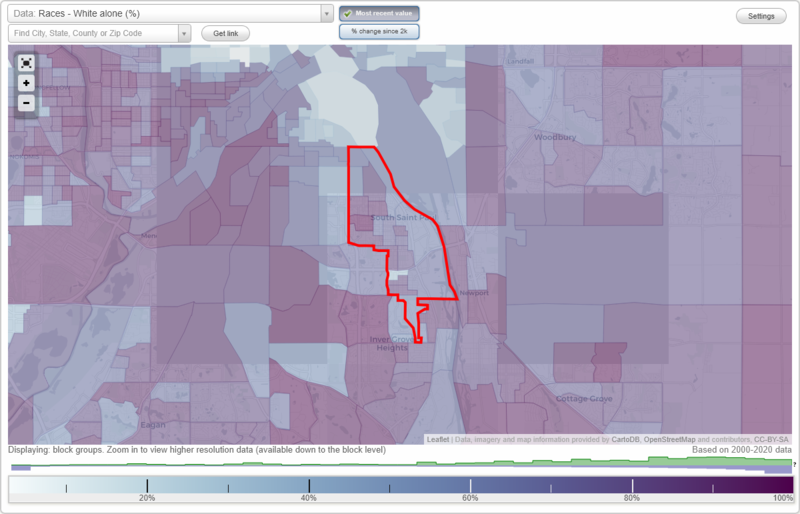
Races - White alone (%)
Races - White alone (% change since 2000)
Races - Black alone (%)
Races - Black alone (% change since 2000)
Races - American Indian alone (%)
Races - American Indian alone (% change since 2000)
Races - Asian alone (%)
Races - Asian alone (% change since 2000)
Races - Hispanic (%)
Races - Hispanic (% change since 2000)
Races - Native Hawaiian and Other Pacific Islander alone (%)
Races - Native Hawaiian and Other Pacific Islander alone (% change since 2000)
Races - Two or more races(%)
Races - Two or more races(% change since 2000)
Races - Other race alone (%)
Races - Other race alone (% change since 2000)
Racial diversity
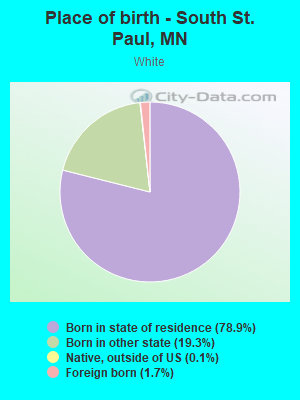
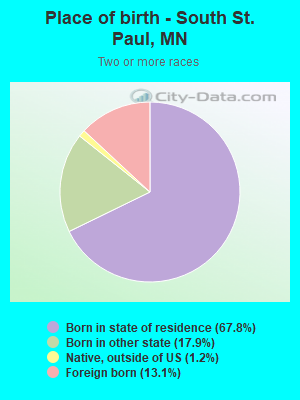
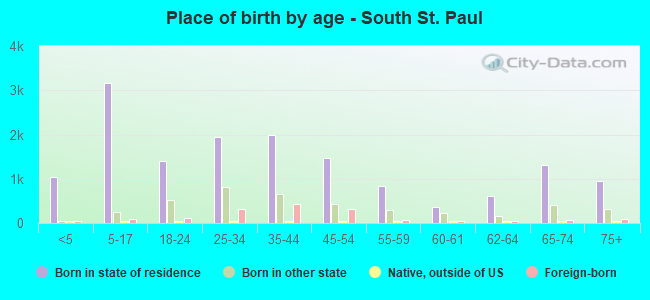
Place of birth - Born in state of residence (%)
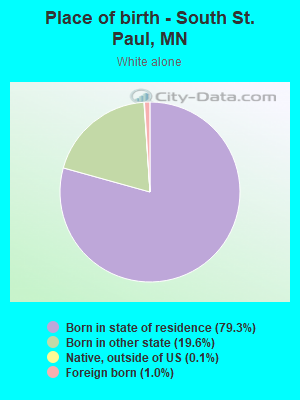
Place of birth - Born in state of residence (%) - White
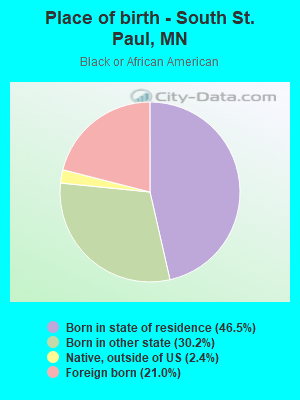
Place of birth - Born in state of residence (%) - Black or African American
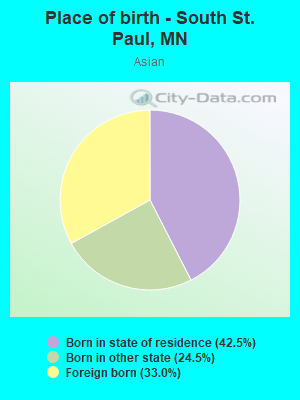
Place of birth - Born in state of residence (%) - Asian
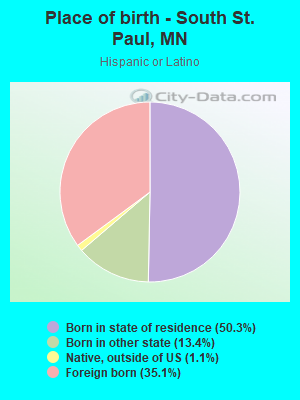
Place of birth - Born in state of residence (%) - Hispanic or Latino
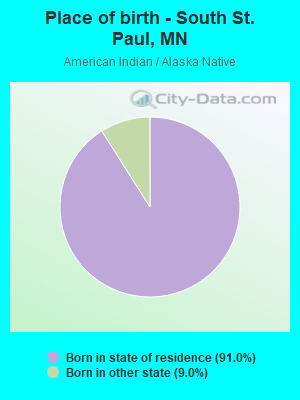
Place of birth - Born in state of residence (%) - American Indian and Alaska Native
Place of birth - Born in state of residence (%) - Multirace
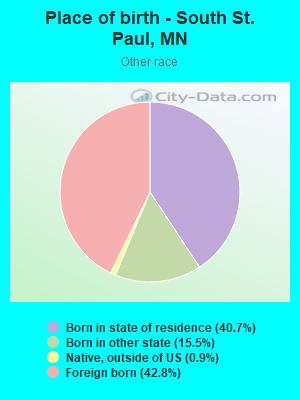
Place of birth - Born in state of residence (%) - Other Race
Place of birth - Born in other state (%)
Place of birth - Born in other state (%) - White
Place of birth - Born in other state (%) - Black or African American
Place of birth - Born in other state (%) - Asian
Place of birth - Born in other state (%) - Hispanic or Latino
Place of birth - Born in other state (%) - American Indian and Alaska Native
Place of birth - Born in other state (%) - Multirace
Place of birth - Born in other state (%) - Other Race
Place of birth - Native, outside of US (%)
Place of birth - Native, outside of US (%) - White
Place of birth - Native, outside of US (%) - Black or African American
Place of birth - Native, outside of US (%) - Asian
Place of birth - Native, outside of US (%) - Hispanic or Latino
Place of birth - Native, outside of US (%) - American Indian and Alaska Native
Place of birth - Native, outside of US (%) - Multirace
Place of birth - Native, outside of US (%) - Other Race
Place of birth - Foreign born (%)
Place of birth - Foreign born (%) - White
Place of birth - Foreign born (%) - Black or African American
Place of birth - Foreign born (%) - Asian
Place of birth - Foreign born (%) - Hispanic or Latino
Place of birth - Foreign born (%) - American Indian and Alaska Native
Place of birth - Foreign born (%) - Multirace
Place of birth - Foreign born (%) - Other Race
Residents speaking English at home (%)
Residents speaking English at home - Born in the United States (%)
Residents speaking English at home - Native, born elsewhere (%)
Residents speaking English at home - Foreign born (%)
Residents speaking Spanish at home (%)
Residents speaking Spanish at home - Born in the United States (%)
Residents speaking Spanish at home - Native, born elsewhere (%)
Residents speaking Spanish at home - Foreign born (%)
Residents speaking other language at home (%)
Residents speaking other language at home - Born in the United States (%)
Residents speaking other language at home - Native, born elsewhere (%)
Residents speaking other language at home - Foreign born (%)
Marital status - Never married (%)
Marital status - Now married (%)
Marital status - Separated (%)
Marital status - Widowed (%)
Marital status - Divorced (%)
Ancestries Reported - Arab (%)
Ancestries Reported - Czech (%)
Ancestries Reported - Danish (%)
Ancestries Reported - Dutch (%)
Ancestries Reported - English (%)
Ancestries Reported - French (%)
Ancestries Reported - French Canadian (%)
Ancestries Reported - German (%)
Ancestries Reported - Greek (%)
Ancestries Reported - Hungarian (%)
Ancestries Reported - Irish (%)
Ancestries Reported - Italian (%)
Ancestries Reported - Lithuanian (%)
Ancestries Reported - Norwegian (%)
Ancestries Reported - Polish (%)
Ancestries Reported - Portuguese (%)
Ancestries Reported - Russian (%)
Ancestries Reported - Scotch-Irish (%)
Ancestries Reported - Scottish (%)
Ancestries Reported - Slovak (%)
Ancestries Reported - Subsaharan African (%)
Ancestries Reported - Swedish (%)
Ancestries Reported - Swiss (%)
Ancestries Reported - Ukrainian (%)
Ancestries Reported - United States (%)
Ancestries Reported - Welsh (%)
Ancestries Reported - West Indian (%)
Ancestries Reported - Other (%)
Geographical mobility - Same house 1 year ago (%)
Geographical mobility - Same house 1 year ago (%) - White
Geographical mobility - Same house 1 year ago (%) - Black or African American
Geographical mobility - Same house 1 year ago (%) - Asian
Geographical mobility - Same house 1 year ago (%) - Hispanic or Latino
Geographical mobility - Same house 1 year ago (%) - American Indian and Alaska Native
Geographical mobility - Same house 1 year ago (%) - Multirace
Geographical mobility - Same house 1 year ago (%) - Other Race
Geographical mobility - Moved within same county (%)
Geographical mobility - Moved within same county (%) - White
Geographical mobility - Moved within same county (%) - Black or African American
Geographical mobility - Moved within same county (%) - Asian
Geographical mobility - Moved within same county (%) - Hispanic or Latino
Geographical mobility - Moved within same county (%) - American Indian and Alaska Native
Geographical mobility - Moved within same county (%) - Multirace
Geographical mobility - Moved within same county (%) - Other Race
Geographical mobility - Moved from different county within same state (%)
Geographical mobility - Moved from different county within same state (%) - White
Geographical mobility - Moved from different county within same state (%) - Black or African American
Geographical mobility - Moved from different county within same state (%) - Asian
Geographical mobility - Moved from different county within same state (%) - Hispanic or Latino
Geographical mobility - Moved from different county within same state (%) - American Indian and Alaska Native
Geographical mobility - Moved from different county within same state (%) - Multirace
Geographical mobility - Moved from different county within same state (%) - Other Race
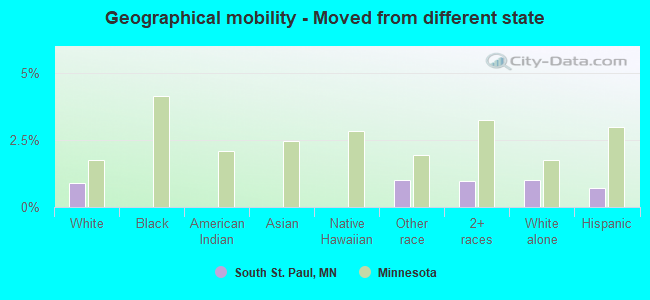
Geographical mobility - Moved from different state (%)
Geographical mobility - Moved from different state (%) - White
Geographical mobility - Moved from different state (%) - Black or African American
Geographical mobility - Moved from different state (%) - Asian
Geographical mobility - Moved from different state (%) - Hispanic or Latino
Geographical mobility - Moved from different state (%) - American Indian and Alaska Native
Geographical mobility - Moved from different state (%) - Multirace
Geographical mobility - Moved from different state (%) - Other Race
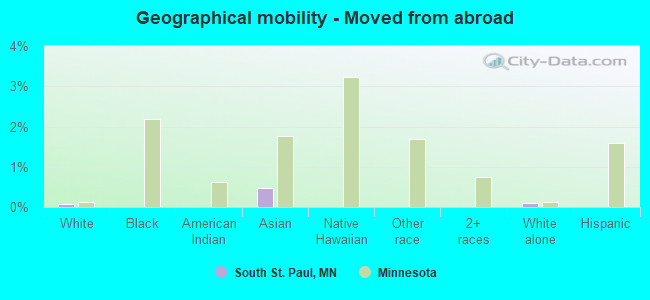
Geographical mobility - Moved from abroad (%)
Geographical mobility - Moved from abroad (%) - White
Geographical mobility - Moved from abroad (%) - Black or African American
Geographical mobility - Moved from abroad (%) - Asian
Geographical mobility - Moved from abroad (%) - Hispanic or Latino
Geographical mobility - Moved from abroad (%) - American Indian and Alaska Native
Geographical mobility - Moved from abroad (%) - Multirace
Geographical mobility - Moved from abroad (%) - Other Race
Place of birth for the foreign-born population - Ireland (%)
Place of birth for the foreign-born population - Denmark (%)
Place of birth for the foreign-born population - Norway (%)
Place of birth for the foreign-born population - Sweden (%)
Place of birth for the foreign-born population - United Kingdom (%)
Place of birth for the foreign-born population - England (%)
Place of birth for the foreign-born population - Scotland (%)
Place of birth for the foreign-born population - Other Northern Europe (%)
Place of birth for the foreign-born population - Austria (%)
Place of birth for the foreign-born population - Belgium (%)
Place of birth for the foreign-born population - France (%)
Place of birth for the foreign-born population - Germany (%)
Place of birth for the foreign-born population - Netherlands (%)
Place of birth for the foreign-born population - Switzerland (%)
Place of birth for the foreign-born population - Other Western Europe (%)
Place of birth for the foreign-born population - Greece (%)
Place of birth for the foreign-born population - Italy (%)
Place of birth for the foreign-born population - Portugal (%)
Place of birth for the foreign-born population - Spain (%)
Place of birth for the foreign-born population - Other Southern Europe (%)
Place of birth for the foreign-born population - Albania (%)
Place of birth for the foreign-born population - Belarus (%)
Place of birth for the foreign-born population - Bosnia and Herzegovina (%)
Place of birth for the foreign-born population - Bulgaria (%)
Place of birth for the foreign-born population - Croatia (%)
Place of birth for the foreign-born population - Czechoslovakia (%)
Place of birth for the foreign-born population - Hungary (%)
Place of birth for the foreign-born population - Latvia (%)
Place of birth for the foreign-born population - Lithuania (%)
Place of birth for the foreign-born population - North Macedonia (Macedonia) (%)
Place of birth for the foreign-born population - Moldova (%)
Place of birth for the foreign-born population - Poland (%)
Place of birth for the foreign-born population - Romania (%)
Place of birth for the foreign-born population - Russia (%)
Place of birth for the foreign-born population - Serbia (%)
Place of birth for the foreign-born population - Ukraine (%)
Place of birth for the foreign-born population - Other Eastern Europe (%)
Place of birth for the foreign-born population - China (%)
Place of birth for the foreign-born population - Hong Kong (%)
Place of birth for the foreign-born population - Taiwan (%)
Place of birth for the foreign-born population - Japan (%)
Place of birth for the foreign-born population - Korea (%)
Place of birth for the foreign-born population - Other Eastern Asia (%)
Place of birth for the foreign-born population - Afghanistan (%)
Place of birth for the foreign-born population - Bangladesh (%)
Place of birth for the foreign-born population - India (%)
Place of birth for the foreign-born population - Iran (%)
Place of birth for the foreign-born population - Kazakhstan (%)
Place of birth for the foreign-born population - Nepal (%)
Place of birth for the foreign-born population - Pakistan (%)
Place of birth for the foreign-born population - Sri Lanka (%)
Place of birth for the foreign-born population - Uzbekistan (%)
Place of birth for the foreign-born population - Other South Central Asia (%)
Place of birth for the foreign-born population - Burma (%)
Place of birth for the foreign-born population - Cambodia (%)
Place of birth for the foreign-born population - Indonesia (%)
Place of birth for the foreign-born population - Laos (%)
Place of birth for the foreign-born population - Malaysia (%)
Place of birth for the foreign-born population - Philippines (%)
Place of birth for the foreign-born population - Singapore (%)
Place of birth for the foreign-born population - Thailand (%)
Place of birth for the foreign-born population - Vietnam (%)
Place of birth for the foreign-born population - Other South Eastern Asia (%)
Place of birth for the foreign-born population - Armenia (%)
Place of birth for the foreign-born population - Iraq (%)
Place of birth for the foreign-born population - Israel (%)
Place of birth for the foreign-born population - Jordan (%)
Place of birth for the foreign-born population - Kuwait (%)
Place of birth for the foreign-born population - Lebanon (%)
Place of birth for the foreign-born population - Saudi Arabia (%)
Place of birth for the foreign-born population - Syria (%)
Place of birth for the foreign-born population - Turkey (%)
Place of birth for the foreign-born population - Yemen (%)
Place of birth for the foreign-born population - Other Western Asia (%)
Place of birth for the foreign-born population - Eritrea (%)
Place of birth for the foreign-born population - Ethiopia (%)
Place of birth for the foreign-born population - Kenya (%)
Place of birth for the foreign-born population - Somalia (%)
Place of birth for the foreign-born population - Uganda (%)
Place of birth for the foreign-born population - Zimbabwe (%)
Place of birth for the foreign-born population - Other Eastern Africa (%)
Place of birth for the foreign-born population - Cameroon (%)
Place of birth for the foreign-born population - Congo (%)
Place of birth for the foreign-born population - Democratic Republic of Congo (Zaire) (%)
Place of birth for the foreign-born population - Other Middle Africa (%)
Place of birth for the foreign-born population - Egypt (%)
Place of birth for the foreign-born population - Morocco (%)
Place of birth for the foreign-born population - Sudan (%)
Place of birth for the foreign-born population - Other Northern Africa (%)
Place of birth for the foreign-born population - South Africa (%)
Place of birth for the foreign-born population - Other Southern Africa (%)
Place of birth for the foreign-born population - Cabo Verde (%)
Place of birth for the foreign-born population - Ghana (%)
Place of birth for the foreign-born population - Liberia (%)
Place of birth for the foreign-born population - Nigeria (%)
Place of birth for the foreign-born population - Senegal (%)
Place of birth for the foreign-born population - Sierra Leone (%)
Place of birth for the foreign-born population - Other Western Africa (%)
Place of birth for the foreign-born population - Australia (%)
Place of birth for the foreign-born population - New Zealand (%)
Place of birth for the foreign-born population - Fiji (%)
Place of birth for the foreign-born population - Micronesia (%)
Place of birth for the foreign-born population - Bahamas (%)
Place of birth for the foreign-born population - Barbados (%)
Place of birth for the foreign-born population - Cuba (%)
Place of birth for the foreign-born population - Dominica (%)
Place of birth for the foreign-born population - Dominican Republic (%)
Place of birth for the foreign-born population - Grenada (%)
Place of birth for the foreign-born population - Haiti (%)
Place of birth for the foreign-born population - Jamaica (%)
Place of birth for the foreign-born population - St. Vincent and the Grenadines (%)
Place of birth for the foreign-born population - Trinidad and Tobago (%)
Place of birth for the foreign-born population - West Indies (%)
Place of birth for the foreign-born population - Other Caribbean (%)
Place of birth for the foreign-born population - Belize (%)
Place of birth for the foreign-born population - Costa Rica (%)
Place of birth for the foreign-born population - El Salvador (%)
Place of birth for the foreign-born population - Guatemala (%)
Place of birth for the foreign-born population - Honduras (%)
Place of birth for the foreign-born population - Mexico (%)
Place of birth for the foreign-born population - Nicaragua (%)
Place of birth for the foreign-born population - Panama (%)
Place of birth for the foreign-born population - Other Central America (%)
Place of birth for the foreign-born population - Argentina (%)
Place of birth for the foreign-born population - Bolivia (%)
Place of birth for the foreign-born population - Brazil (%)
Place of birth for the foreign-born population - Chile (%)
Place of birth for the foreign-born population - Colombia (%)
Place of birth for the foreign-born population - Ecuador (%)
Place of birth for the foreign-born population - Guyana (%)
Place of birth for the foreign-born population - Peru (%)
Place of birth for the foreign-born population - Uruguay (%)
Place of birth for the foreign-born population - Venezuela (%)
Place of birth for the foreign-born population - Other South America (%)
Place of birth for the foreign-born population - Canada (%)
Place of birth for the foreign-born population - Other Northern America (%)
Place of birth for the foreign-born population - Other (%)
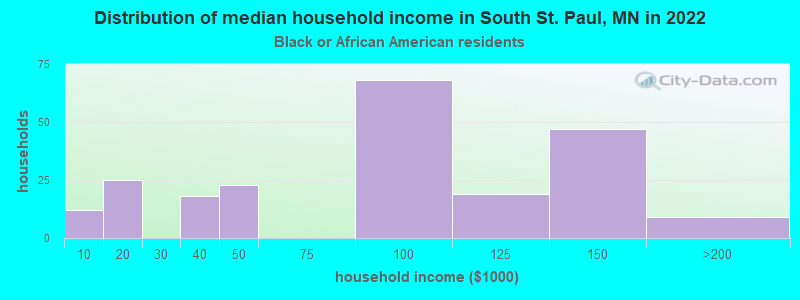
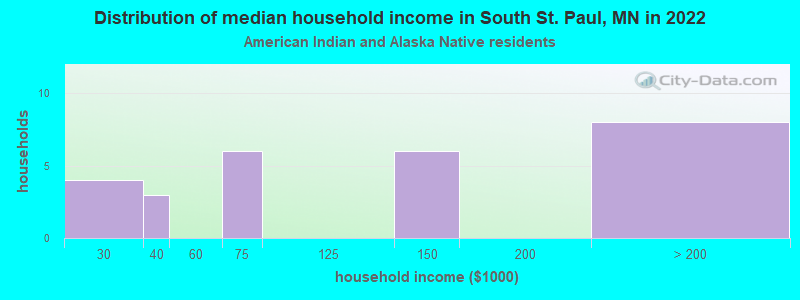
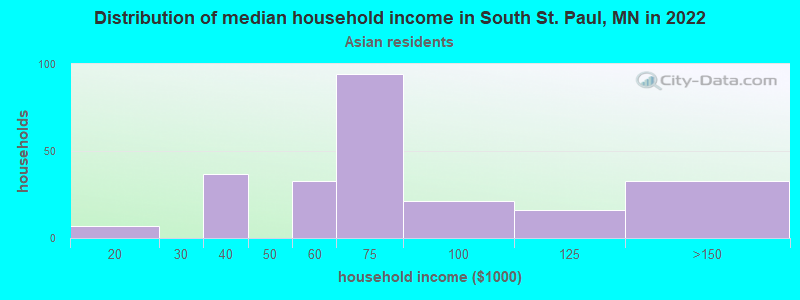
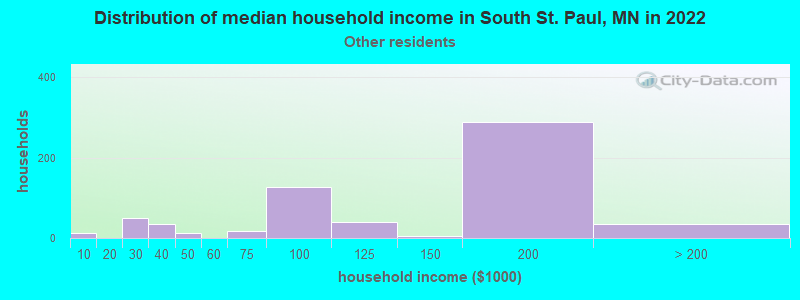
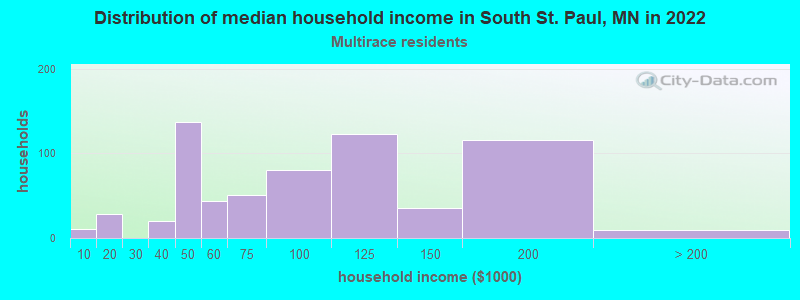
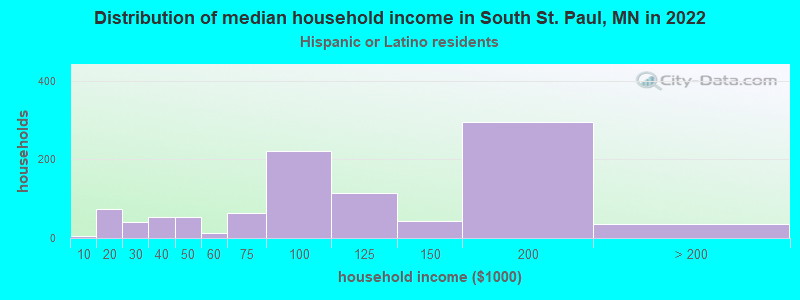
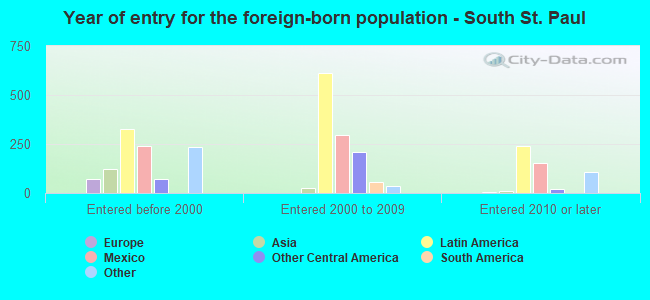
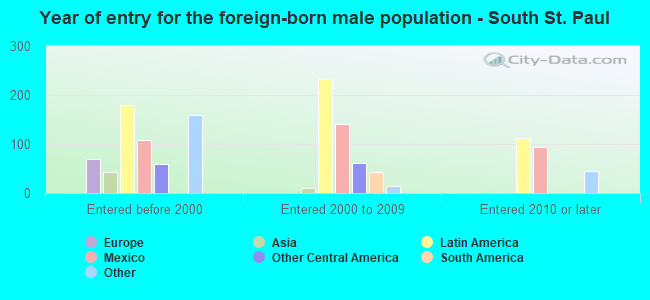
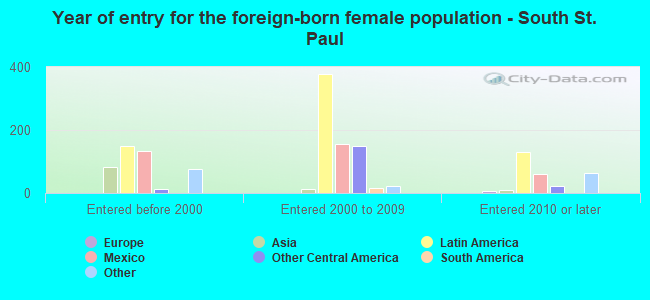
According to 2022 data, the most numerous races in South St. Paul, MN are White alone (14,296 residents), Black alone (1,052 residents), and Hispanic (3,574 residents). 85.3% of South St. Paul residents speak English at home. 7.4% of South St. Paul, MN residents are foreign-born (4.6% born in Latin America, 1.5% born in Africa, 0.8% born in Asia), which is 8.2% less than the foreign-born rate of 8.0% across the entire state of Minnesota.
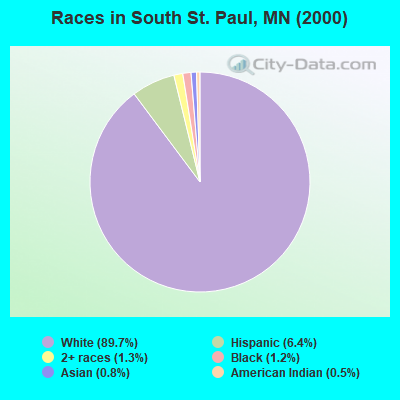
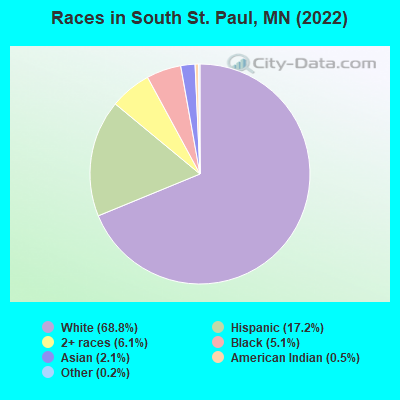
Race distribution in South St. Paul
2000 2022
4,337,143 88.2% White alone 168,813 3.4% Black alone 143,382 2.9% Hispanic 141,083 2.9% Asian alone 70,304 1.4% Two or more races 52,009 1.1% American Indian alone 5,031 0.1% Other race alone 1,714 0.03% Native Hawaiian and Other
4,356,347 76.2% White alone 395,179 6.9% Black alone 333,830 5.8% Hispanic 294,800 5.2% Asian alone 259,649 4.5% Two or more races 42,125 0.7% American Indian alone 32,976 0.6% Other race alone 2,278 0.04% Native Hawaiian and Other
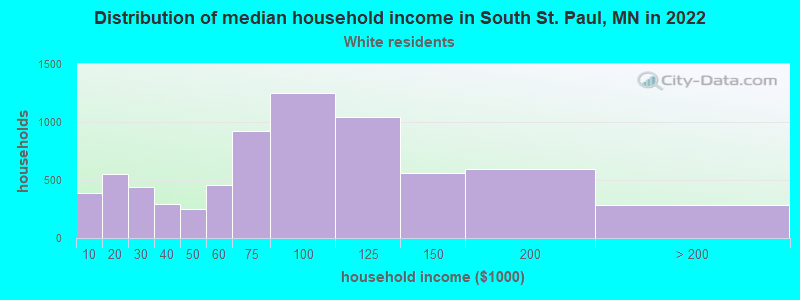
Income and house value in South St. Paul Median household income in 2022 $77,775 White non-Hispanic householders$90,750 Black householders$54,356 Asian householders$159,240 Some other race householders$89,792 Two or more races householders$111,330 Hispanic or Latino race householdersMedian 2022 house value $266,455 White Non-Hispanic householders$336,625 Black or African American householders $641,180 Asian householders$108,511 Native Hawaiian and other Pacific Islander householders$233,178 Some other race householders$229,079 Two or more races householders$241,135 Hispanic or Latino householders
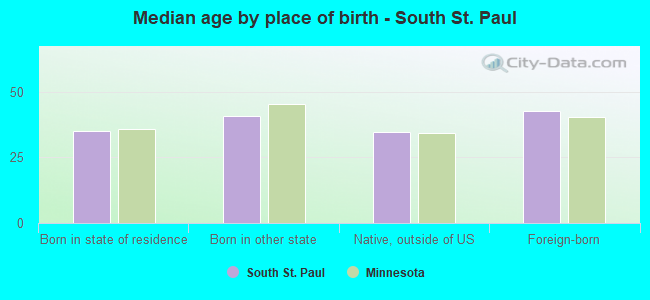
Median age by race in South St. Paul
42.0 Median age for White residents41.7 42.3 21.9 Median age for Black or African American residents22.3 21.6 28.8 Median age for American Indian / Alaska Native residents24.9 57.5 30.1 Median age for Asian residents28.8 32.6 -744,336,568.8 Median age for Native Hawaiian / Pacific Islander residents-856,799,036.4 -534,959,349.1 27.1 Median age for Other race residents31.4 30.1 25.0 Median age for Two or more races residents24.1 26.5 42.7 Median age for White alone residents42.4 42.9 25.4 Median age for Hispanic or Latino residents26.7 24.6
Owner/renter occupied households by race in South St. Paul
House owners and renters - White residents 4,856 69.2% Owner occupied2,161 30.8% Renter occupiedHouse owners and renters - Black or African American residents 108 51.2% Owner occupied103 48.8% Renter occupiedHouse owners and renters - American Indian / Alaska Native residents 19 73.0% Owner occupied7 27.0% Renter occupiedHouse owners and renters - Asian residents 111 48.8% Owner occupied117 51.2% Renter occupiedHouse owners and renters - Other race residents 499 82.7% Owner occupied105 17.3% Renter occupiedHouse owners and renters - Two or more races residents 526 75.5% Owner occupied171 24.5% Renter occupiedHouse owners and renters - White alone residents 4,755 69.5% Owner occupied2,082 30.5% Renter occupiedHouse owners and renters - Hispanic or Latino residents 737 77.9% Owner occupied209 22.1% Renter occupied
Language usage in South St. Paul
English speakers - Total 85.3% of residents of South St. Paul speak English at home.
11.1% of residents speak Spanish at home 927 42.5% Speak English very well1,255 57.5% Speak English less than very well4.5% of residents speak other language at home 719 80.8% Speak English very well171 19.2% Speak English less than very well
English speakers - Born in the United States 84.4% of residents of South St. Paul speak English at home.
8.1% of residents speak Spanish at home 211 64.1% Speak English very well118 35.9% Speak English less than very well6.9% of residents speak other language at home 266 94.7% Speak English very well15 5.3% Speak English less than very well
English speakers - Native, born elsewhere 55.3% of residents of South St. Paul speak English at home.
56.6% of residents speak Spanish at home 43 100.0% Speak English very well
English speakers - Foreign-born 16.5% of residents of South St. Paul speak English at home.
78.2% of residents speak Spanish at home 214 17.3% Speak English very well1,024 82.7% Speak English less than very well23.0% of residents speak other language at home 228 62.5% Speak English very well137 37.5% Speak English less than very well
White (Caucasian) - Speak only English Native:
96.8% (13,699)Foreign-born:
22.9% (59)
White (Caucasian) - Speak another language Native:
2.6% (367)Foreign-born:
70.8% (181)
Black or African American - Speak only English Native:
71.6% (486)Foreign-born:
37.4% (83)
Black or African American - Speak another language Native:
32.9% (224)Foreign-born:
61.8% (138)
Asian - Speak only English Native:
21.4% (65)Foreign-born:
31.7% (55)
Asian - Speak another language Native:
66.2% (200)Foreign-born:
68.4% (119)
Other race - Speak only English Native:
40.4% (486)Foreign-born:
6.2% (60)
Other race - Speak another language Native:
58.3% (702)Foreign-born:
92.3% (886)
Two or more races - Speak only English Native:
100.0% (1,694)Foreign-born:
6.0% (16)
Two or more races - Speak another language Native:
2.4% (41)Foreign-born:
98.3% (266)
White alone - Speak only English Native:
98.0% (13,409)Foreign-born:
39.1% (55)
White alone - Speak another language Native:
1.8% (248)Foreign-born:
59.7% (83)
Hispanic or Latino - Speak only English Native:
58.6% (1,165)Foreign-born:
6.6% (84)
Hispanic or Latino - Speak another language Native:
41.3% (822)Foreign-born:
93.9% (1,186)
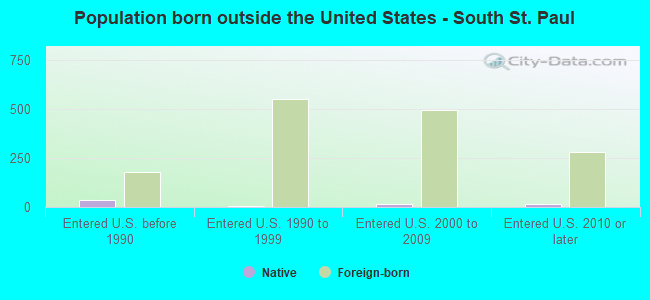
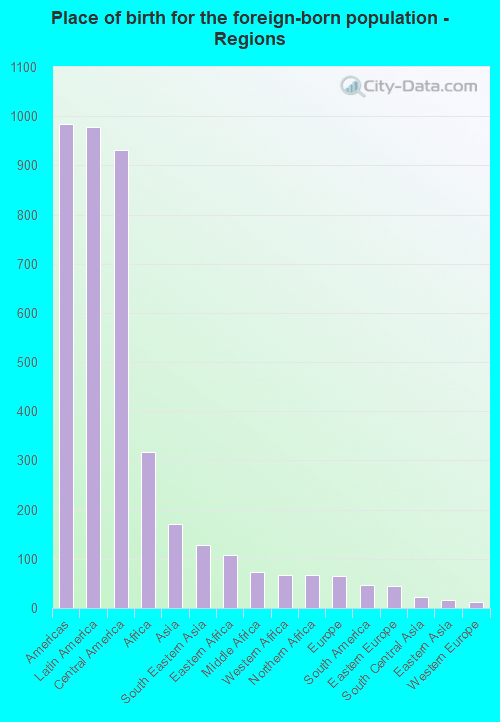
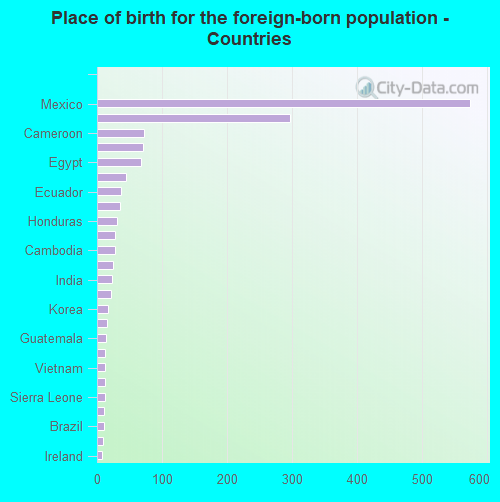
Foreign-born residents in South St. Paul 1,538 residents are foreign born (4.6% Latin America , 1.5% Africa , 0.8% Asia ).
This city:
7.4%Minnesota:
8.5%
Marital status for residents in South St. Paul Marital status - White (Caucasian) population 15 years and over
Males 34.3% Never married49.7% Now married1.3% Separated3.1% Widowed11.6% DivorcedFemales 29.9% Never married43.0% Now married0.9% Separated9.3% Widowed17.0% DivorcedWomen who gave birth in the past 12 months Now married:
68.5% (118)Unmarried:
31.5% (54)
Women who did not give birth in the past 12 months Now married:
35.9% (1,197)Unmarried:
64.1% (2,142)
Marital status - Black or African American population 15 years and over
Males 69.5% Never married29.1% Now married0.0% Separated0.0% Widowed1.3% DivorcedFemales 48.5% Never married22.6% Now married0.0% Separated0.0% Widowed28.8% DivorcedWomen who gave birth in the past 12 months Now married:
27.7% (16)Unmarried:
72.3% (41)
Women who did not give birth in the past 12 months Now married:
22.3% (54)Unmarried:
77.7% (187)
Marital status - American Indian / Alaska Native population 15 years and over
Males 84.0% Never married9.9% Now married0.0% Separated0.0% Widowed6.2% DivorcedFemales 50.0% Never married19.2% Now married0.0% Separated0.0% Widowed30.8% DivorcedWomen who did not give birth in the past 12 months Now married:
0.0% (0)Unmarried:
100.0% (2)
Marital status - Asian population 15 years and over
Males 56.1% Never married43.9% Now married0.0% Separated0.0% Widowed0.0% DivorcedFemales 50.2% Never married31.3% Now married0.0% Separated9.7% Widowed8.8% DivorcedWomen who gave birth in the past 12 months Now married:
100.0% (4)Unmarried:
0.0% (0)
Women who did not give birth in the past 12 months Now married:
29.5% (54)Unmarried:
70.5% (129)
Marital status - Other race population 15 years and over
Males 52.6% Never married34.5% Now married0.0% Separated0.0% Widowed12.9% DivorcedFemales 38.5% Never married46.5% Now married1.2% Separated7.3% Widowed6.5% DivorcedWomen who did not give birth in the past 12 months Now married:
48.4% (346)Unmarried:
51.6% (369)
Marital status - Two or more races population 15 years and over
Males 67.1% Never married29.1% Now married0.0% Separated0.0% Widowed3.8% DivorcedFemales 51.5% Never married39.3% Now married0.0% Separated0.0% Widowed9.3% DivorcedWomen who gave birth in the past 12 months Now married:
32.1% (12)Unmarried:
67.9% (24)
Women who did not give birth in the past 12 months Now married:
36.6% (213)Unmarried:
63.4% (370)
Marital status - White alone, not Hispanic / Latino population 15 years and over
Males 33.6% Never married49.6% Now married1.3% Separated3.3% Widowed12.2% DivorcedFemales 29.3% Never married42.9% Now married0.9% Separated9.6% Widowed17.2% DivorcedWomen who gave birth in the past 12 months Now married:
72.0% (104)Unmarried:
28.0% (40)
Women who did not give birth in the past 12 months Now married:
34.7% (1,121)Unmarried:
65.3% (2,106)
Marital status - Hispanic or Latino population 15 years and over
Males 52.4% Never married40.5% Now married0.0% Separated0.0% Widowed7.2% DivorcedFemales 42.5% Never married46.2% Now married0.6% Separated4.2% Widowed6.6% DivorcedWomen who gave birth in the past 12 months Now married:
47.4% (28)Unmarried:
52.6% (32)
Women who did not give birth in the past 12 months Now married:
47.9% (467)Unmarried:
52.1% (507)
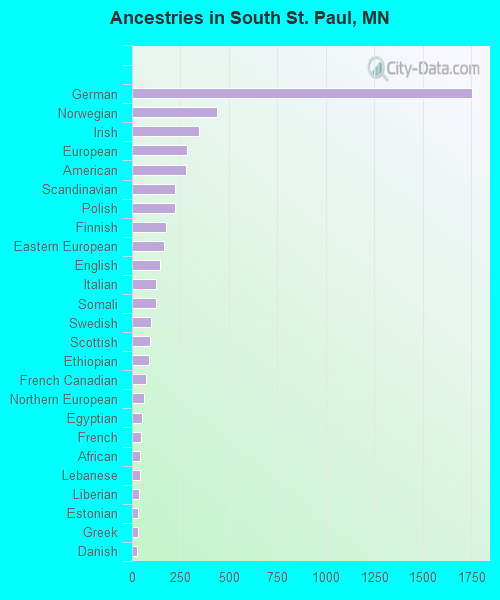
Ancestries in South St. Paul
1,753 22.1% German437 5.5% Norwegian348 4.4% Irish283 3.6% European279 3.5% American223 2.8% Scandinavian221 2.8% Polish175 2.2% Finnish163 2.1% Eastern European142 1.8% English126 1.6% Italian125 1.6% Somali99 1.2% Swedish92 1.2% Scottish89 1.1% Ethiopian71 0.9% French Canadian63 0.8% Northern European50 0.6% Egyptian45 0.6% French41 0.5% African39 0.5% Lebanese35 0.4% Liberian31 0.4% Estonian31 0.4% Greek28 0.4% Danish23 0.3% Croatian18 0.2% Czech15 0.2% Swiss13 0.2% Dutch13 0.2% Scotch-Irish12 0.2% Portuguese10 0.1% Sierra Leonean9 0.1% Austrian9 0.1% Romanian6 0.08% Serbian5 0.06% Welsh3 0.04% Czechoslovakian3 0.04% Slavic2 0.03% Russian
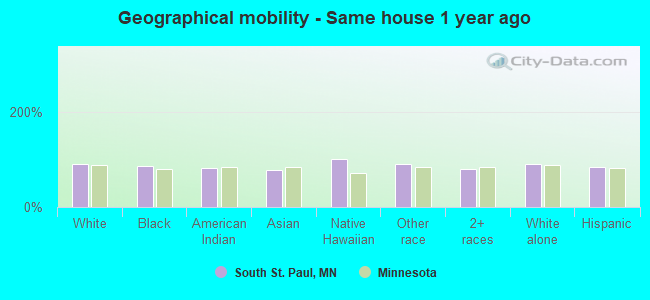
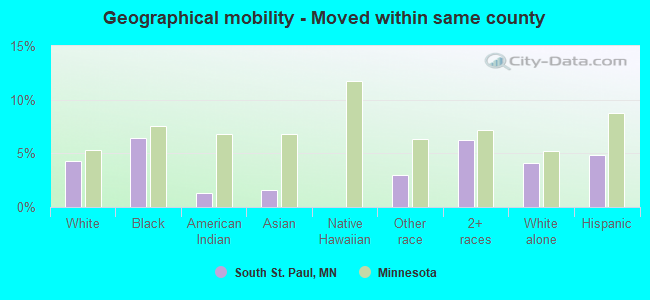
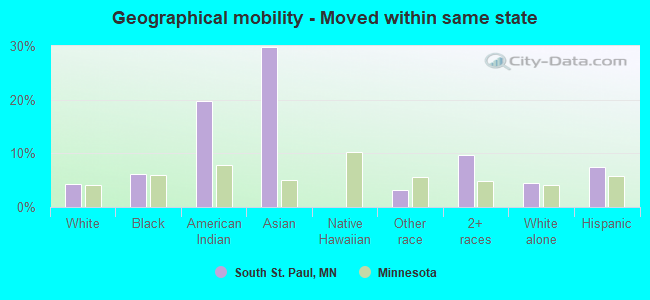
Geographical mobility in South St. Paul Same house 1 year ago 13,464 90.7% White (Caucasian)767 84.6% Black or African American102 81.4% American Indian / Alaska Native371 77.3% Asian24 100.0% Native Hawaiian / Pacific Islander2,117 91.2% Other race1,658 78.6% Two or more races12,824 90.5% White alone, not Hispanic / Latino2,973 83.6% Hispanic or LatinoMoved within same county 631 4.2% White / Caucasian58 6.4% Black or African American2 1.3% American Indian / Alaska Native7 1.6% Asian70 3.0% Other race132 6.3% Two or more races575 4.1% White alone, not Hispanic / Latino173 4.9% Hispanic or LatinoMoved within same state 624 4.2% White / Caucasian56 6.2% Black or African American25 19.7% American Indian / Alaska Native143 29.8% Asian73 3.2% Other race204 9.7% Two or more races623 4.4% White alone, not Hispanic / Latino265 7.4% Hispanic or LatinoMoved from different state 131 0.9% White / Caucasian23 1.0% Other race20 1.0% Two or more races141 1.0% White alone, not Hispanic / Latino26 0.7% Hispanic or LatinoMoved from abroad 11 0.1% White2 0.5% Asian13 0.1% White alone, not Hispanic / Latino
Children Nativity (place of birth) in South St. Paul
Children under 6 years - Living with two parents Both parents native 599 100.0% NativeBoth parents foreign-born 86 100.0% NativeOne native, one foreign-born parent 72 100.0% NativeChildren under 6 years - Living with one parent Native parent 448 100.0% NativeForeign-born parent 18 100.0% NativeChildren 6 to 17 years - Living with two parents Both parents native 1,211 100.0% NativeBoth parents foreign-born 223 86.3% Native35 13.7% Foreign-bornOne native, one foreign-born parent 224 100.0% NativeChildren 6 to 17 years - Living with one parent Native parent 970 100.0% NativeForeign-born parent 130 53.7% Native112 46.3% Foreign-born
Grandparents responsible for own grandchildren in South St. Paul
Grandparents (30 to 59 years) White / Caucasian 30 38.8% Responsible for grandchildren47 61.2% Not responsible for grandchildrenAsian 7 100.0% Not responsible for grandchildrenOther race 4 100.0% Not responsible for grandchildrenWhite alone, not Hispanic / Latino 31 37.8% Responsible for grandchildren51 62.2% Not responsible for grandchildrenHispanic or Latino 3 100.0% Not responsible for grandchildrenGrandparents (60 years and over) White / Caucasian 50 27.1% Responsible for grandchildren135 72.9% Not responsible for grandchildrenAsian 9 100.0% Not responsible for grandchildrenOther race 93 100.0% Not responsible for grandchildrenWhite alone, not Hispanic / Latino 50 26.5% Responsible for grandchildren139 73.5% Not responsible for grandchildrenHispanic or Latino 85 100.0% Not responsible for grandchildren