Races in South Miami Heights, Florida (FL) Detailed Stats
Data:
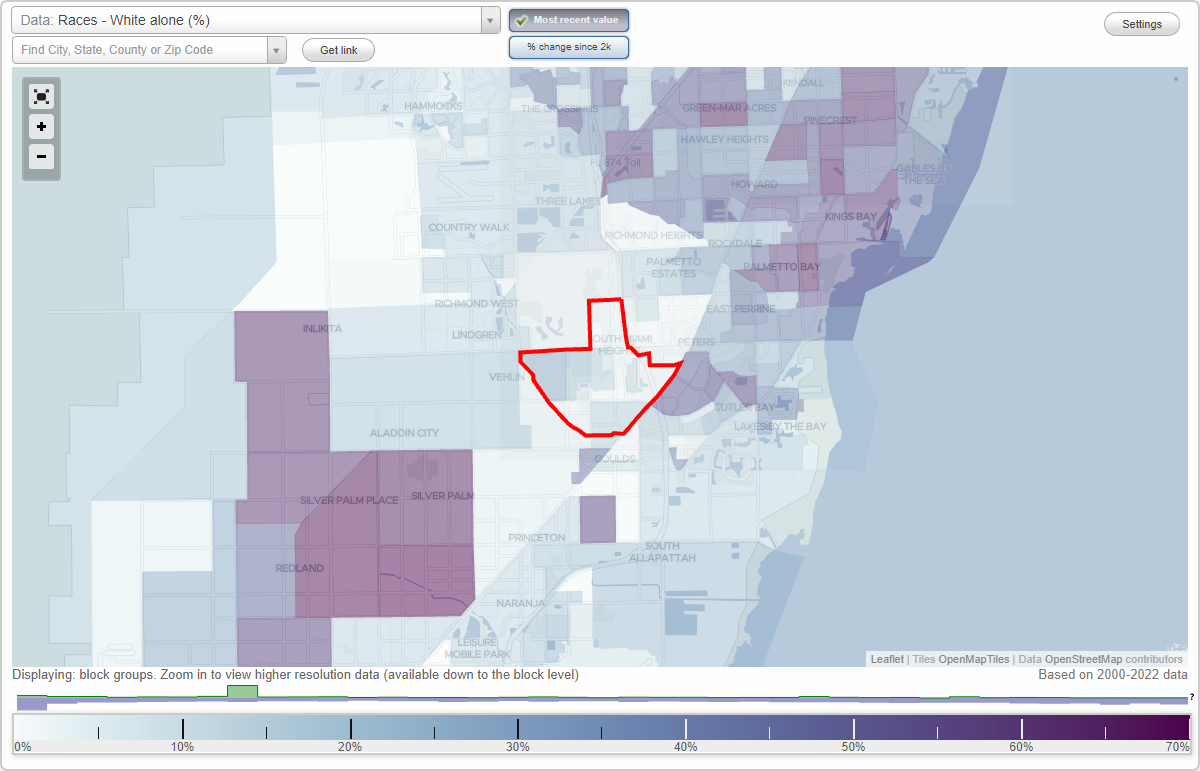
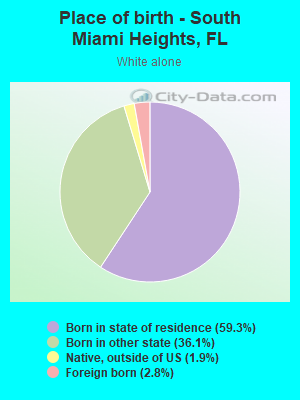
Races - White alone (%)
Races - White alone (% change since 2000)
Races - Black alone (%)
Races - Black alone (% change since 2000)
Races - American Indian alone (%)
Races - American Indian alone (% change since 2000)
Races - Asian alone (%)
Races - Asian alone (% change since 2000)
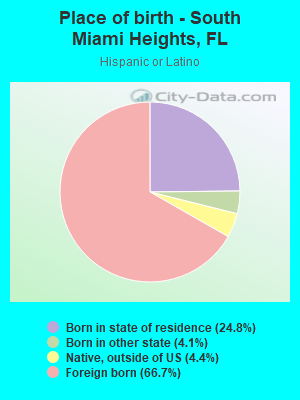
Races - Hispanic (%)
Races - Hispanic (% change since 2000)
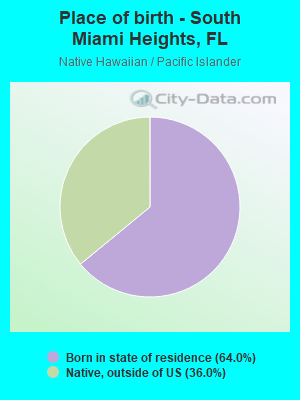
Races - Native Hawaiian and Other Pacific Islander alone (%)
Races - Native Hawaiian and Other Pacific Islander alone (% change since 2000)
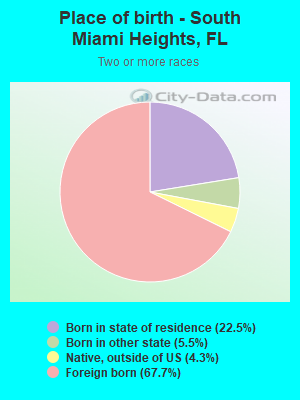
Races - Two or more races(%)
Races - Two or more races(% change since 2000)
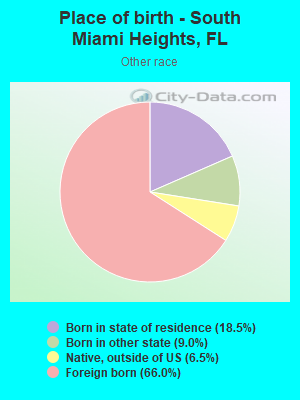
Races - Other race alone (%)
Races - Other race alone (% change since 2000)
Racial diversity
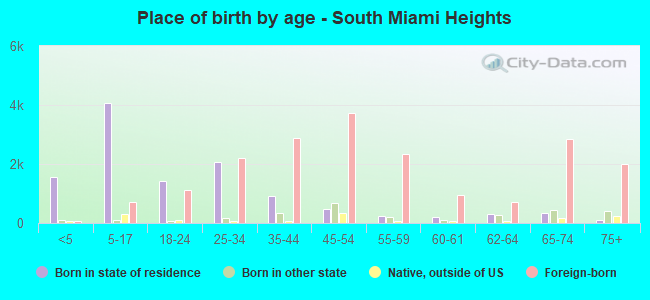
Place of birth - Born in state of residence (%)
Place of birth - Born in state of residence (%) - White
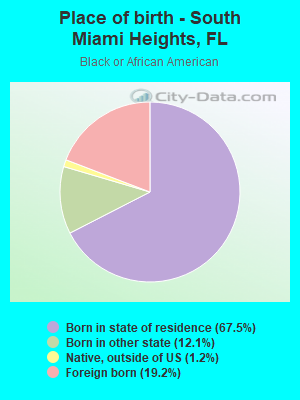
Place of birth - Born in state of residence (%) - Black or African American
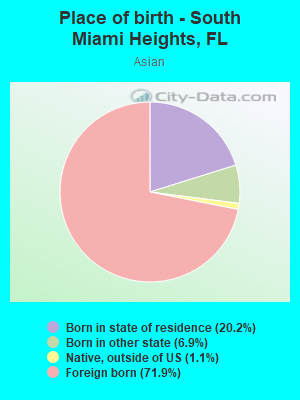
Place of birth - Born in state of residence (%) - Asian
Place of birth - Born in state of residence (%) - Hispanic or Latino
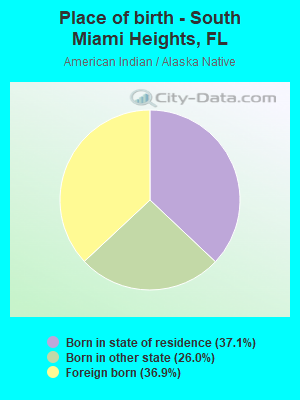
Place of birth - Born in state of residence (%) - American Indian and Alaska Native
Place of birth - Born in state of residence (%) - Multirace
Place of birth - Born in state of residence (%) - Other Race
Place of birth - Born in other state (%)
Place of birth - Born in other state (%) - White
Place of birth - Born in other state (%) - Black or African American
Place of birth - Born in other state (%) - Asian
Place of birth - Born in other state (%) - Hispanic or Latino
Place of birth - Born in other state (%) - American Indian and Alaska Native
Place of birth - Born in other state (%) - Multirace
Place of birth - Born in other state (%) - Other Race
Place of birth - Native, outside of US (%)
Place of birth - Native, outside of US (%) - White
Place of birth - Native, outside of US (%) - Black or African American
Place of birth - Native, outside of US (%) - Asian
Place of birth - Native, outside of US (%) - Hispanic or Latino
Place of birth - Native, outside of US (%) - American Indian and Alaska Native
Place of birth - Native, outside of US (%) - Multirace
Place of birth - Native, outside of US (%) - Other Race
Place of birth - Foreign born (%)
Place of birth - Foreign born (%) - White
Place of birth - Foreign born (%) - Black or African American
Place of birth - Foreign born (%) - Asian
Place of birth - Foreign born (%) - Hispanic or Latino
Place of birth - Foreign born (%) - American Indian and Alaska Native
Place of birth - Foreign born (%) - Multirace
Place of birth - Foreign born (%) - Other Race
Residents speaking English at home (%)
Residents speaking English at home - Born in the United States (%)
Residents speaking English at home - Native, born elsewhere (%)
Residents speaking English at home - Foreign born (%)
Residents speaking Spanish at home (%)
Residents speaking Spanish at home - Born in the United States (%)
Residents speaking Spanish at home - Native, born elsewhere (%)
Residents speaking Spanish at home - Foreign born (%)
Residents speaking other language at home (%)
Residents speaking other language at home - Born in the United States (%)
Residents speaking other language at home - Native, born elsewhere (%)
Residents speaking other language at home - Foreign born (%)
Marital status - Never married (%)
Marital status - Now married (%)
Marital status - Separated (%)
Marital status - Widowed (%)
Marital status - Divorced (%)
Ancestries Reported - Arab (%)
Ancestries Reported - Czech (%)
Ancestries Reported - Danish (%)
Ancestries Reported - Dutch (%)
Ancestries Reported - English (%)
Ancestries Reported - French (%)
Ancestries Reported - French Canadian (%)
Ancestries Reported - German (%)
Ancestries Reported - Greek (%)
Ancestries Reported - Hungarian (%)
Ancestries Reported - Irish (%)
Ancestries Reported - Italian (%)
Ancestries Reported - Lithuanian (%)
Ancestries Reported - Norwegian (%)
Ancestries Reported - Polish (%)
Ancestries Reported - Portuguese (%)
Ancestries Reported - Russian (%)
Ancestries Reported - Scotch-Irish (%)
Ancestries Reported - Scottish (%)
Ancestries Reported - Slovak (%)
Ancestries Reported - Subsaharan African (%)
Ancestries Reported - Swedish (%)
Ancestries Reported - Swiss (%)
Ancestries Reported - Ukrainian (%)
Ancestries Reported - United States (%)
Ancestries Reported - Welsh (%)
Ancestries Reported - West Indian (%)
Ancestries Reported - Other (%)
Geographical mobility - Same house 1 year ago (%)
Geographical mobility - Same house 1 year ago (%) - White
Geographical mobility - Same house 1 year ago (%) - Black or African American
Geographical mobility - Same house 1 year ago (%) - Asian
Geographical mobility - Same house 1 year ago (%) - Hispanic or Latino
Geographical mobility - Same house 1 year ago (%) - American Indian and Alaska Native
Geographical mobility - Same house 1 year ago (%) - Multirace
Geographical mobility - Same house 1 year ago (%) - Other Race
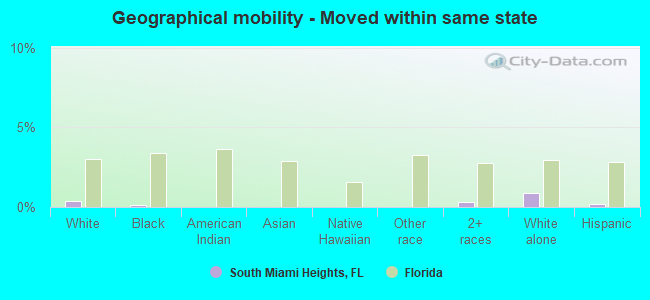
Geographical mobility - Moved within same county (%)
Geographical mobility - Moved within same county (%) - White
Geographical mobility - Moved within same county (%) - Black or African American
Geographical mobility - Moved within same county (%) - Asian
Geographical mobility - Moved within same county (%) - Hispanic or Latino
Geographical mobility - Moved within same county (%) - American Indian and Alaska Native
Geographical mobility - Moved within same county (%) - Multirace
Geographical mobility - Moved within same county (%) - Other Race
Geographical mobility - Moved from different county within same state (%)
Geographical mobility - Moved from different county within same state (%) - White
Geographical mobility - Moved from different county within same state (%) - Black or African American
Geographical mobility - Moved from different county within same state (%) - Asian
Geographical mobility - Moved from different county within same state (%) - Hispanic or Latino
Geographical mobility - Moved from different county within same state (%) - American Indian and Alaska Native
Geographical mobility - Moved from different county within same state (%) - Multirace
Geographical mobility - Moved from different county within same state (%) - Other Race
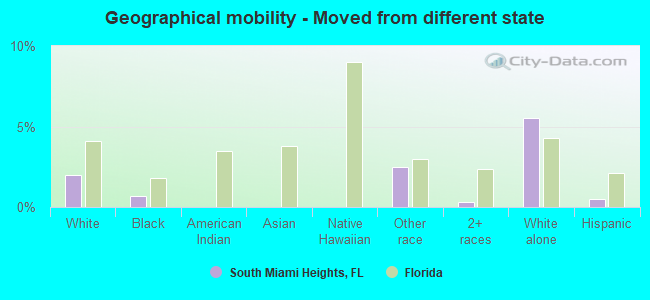
Geographical mobility - Moved from different state (%)
Geographical mobility - Moved from different state (%) - White
Geographical mobility - Moved from different state (%) - Black or African American
Geographical mobility - Moved from different state (%) - Asian
Geographical mobility - Moved from different state (%) - Hispanic or Latino
Geographical mobility - Moved from different state (%) - American Indian and Alaska Native
Geographical mobility - Moved from different state (%) - Multirace
Geographical mobility - Moved from different state (%) - Other Race
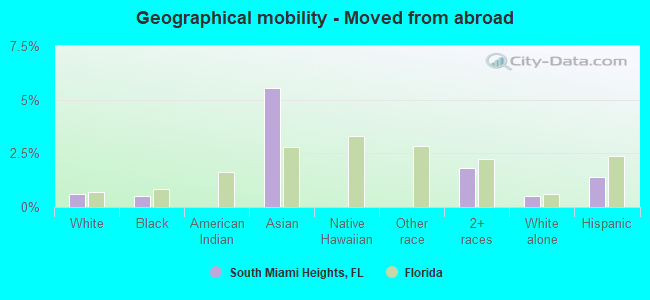
Geographical mobility - Moved from abroad (%)
Geographical mobility - Moved from abroad (%) - White
Geographical mobility - Moved from abroad (%) - Black or African American
Geographical mobility - Moved from abroad (%) - Asian
Geographical mobility - Moved from abroad (%) - Hispanic or Latino
Geographical mobility - Moved from abroad (%) - American Indian and Alaska Native
Geographical mobility - Moved from abroad (%) - Multirace
Geographical mobility - Moved from abroad (%) - Other Race
Place of birth for the foreign-born population - Ireland (%)
Place of birth for the foreign-born population - Denmark (%)
Place of birth for the foreign-born population - Norway (%)
Place of birth for the foreign-born population - Sweden (%)
Place of birth for the foreign-born population - United Kingdom (%)
Place of birth for the foreign-born population - England (%)
Place of birth for the foreign-born population - Scotland (%)
Place of birth for the foreign-born population - Other Northern Europe (%)
Place of birth for the foreign-born population - Austria (%)
Place of birth for the foreign-born population - Belgium (%)
Place of birth for the foreign-born population - France (%)
Place of birth for the foreign-born population - Germany (%)
Place of birth for the foreign-born population - Netherlands (%)
Place of birth for the foreign-born population - Switzerland (%)
Place of birth for the foreign-born population - Other Western Europe (%)
Place of birth for the foreign-born population - Greece (%)
Place of birth for the foreign-born population - Italy (%)
Place of birth for the foreign-born population - Portugal (%)
Place of birth for the foreign-born population - Spain (%)
Place of birth for the foreign-born population - Other Southern Europe (%)
Place of birth for the foreign-born population - Albania (%)
Place of birth for the foreign-born population - Belarus (%)
Place of birth for the foreign-born population - Bosnia and Herzegovina (%)
Place of birth for the foreign-born population - Bulgaria (%)
Place of birth for the foreign-born population - Croatia (%)
Place of birth for the foreign-born population - Czechoslovakia (%)
Place of birth for the foreign-born population - Hungary (%)
Place of birth for the foreign-born population - Latvia (%)
Place of birth for the foreign-born population - Lithuania (%)
Place of birth for the foreign-born population - North Macedonia (Macedonia) (%)
Place of birth for the foreign-born population - Moldova (%)
Place of birth for the foreign-born population - Poland (%)
Place of birth for the foreign-born population - Romania (%)
Place of birth for the foreign-born population - Russia (%)
Place of birth for the foreign-born population - Serbia (%)
Place of birth for the foreign-born population - Ukraine (%)
Place of birth for the foreign-born population - Other Eastern Europe (%)
Place of birth for the foreign-born population - China (%)
Place of birth for the foreign-born population - Hong Kong (%)
Place of birth for the foreign-born population - Taiwan (%)
Place of birth for the foreign-born population - Japan (%)
Place of birth for the foreign-born population - Korea (%)
Place of birth for the foreign-born population - Other Eastern Asia (%)
Place of birth for the foreign-born population - Afghanistan (%)
Place of birth for the foreign-born population - Bangladesh (%)
Place of birth for the foreign-born population - India (%)
Place of birth for the foreign-born population - Iran (%)
Place of birth for the foreign-born population - Kazakhstan (%)
Place of birth for the foreign-born population - Nepal (%)
Place of birth for the foreign-born population - Pakistan (%)
Place of birth for the foreign-born population - Sri Lanka (%)
Place of birth for the foreign-born population - Uzbekistan (%)
Place of birth for the foreign-born population - Other South Central Asia (%)
Place of birth for the foreign-born population - Burma (%)
Place of birth for the foreign-born population - Cambodia (%)
Place of birth for the foreign-born population - Indonesia (%)
Place of birth for the foreign-born population - Laos (%)
Place of birth for the foreign-born population - Malaysia (%)
Place of birth for the foreign-born population - Philippines (%)
Place of birth for the foreign-born population - Singapore (%)
Place of birth for the foreign-born population - Thailand (%)
Place of birth for the foreign-born population - Vietnam (%)
Place of birth for the foreign-born population - Other South Eastern Asia (%)
Place of birth for the foreign-born population - Armenia (%)
Place of birth for the foreign-born population - Iraq (%)
Place of birth for the foreign-born population - Israel (%)
Place of birth for the foreign-born population - Jordan (%)
Place of birth for the foreign-born population - Kuwait (%)
Place of birth for the foreign-born population - Lebanon (%)
Place of birth for the foreign-born population - Saudi Arabia (%)
Place of birth for the foreign-born population - Syria (%)
Place of birth for the foreign-born population - Turkey (%)
Place of birth for the foreign-born population - Yemen (%)
Place of birth for the foreign-born population - Other Western Asia (%)
Place of birth for the foreign-born population - Eritrea (%)
Place of birth for the foreign-born population - Ethiopia (%)
Place of birth for the foreign-born population - Kenya (%)
Place of birth for the foreign-born population - Somalia (%)
Place of birth for the foreign-born population - Uganda (%)
Place of birth for the foreign-born population - Zimbabwe (%)
Place of birth for the foreign-born population - Other Eastern Africa (%)
Place of birth for the foreign-born population - Cameroon (%)
Place of birth for the foreign-born population - Congo (%)
Place of birth for the foreign-born population - Democratic Republic of Congo (Zaire) (%)
Place of birth for the foreign-born population - Other Middle Africa (%)
Place of birth for the foreign-born population - Egypt (%)
Place of birth for the foreign-born population - Morocco (%)
Place of birth for the foreign-born population - Sudan (%)
Place of birth for the foreign-born population - Other Northern Africa (%)
Place of birth for the foreign-born population - South Africa (%)
Place of birth for the foreign-born population - Other Southern Africa (%)
Place of birth for the foreign-born population - Cabo Verde (%)
Place of birth for the foreign-born population - Ghana (%)
Place of birth for the foreign-born population - Liberia (%)
Place of birth for the foreign-born population - Nigeria (%)
Place of birth for the foreign-born population - Senegal (%)
Place of birth for the foreign-born population - Sierra Leone (%)
Place of birth for the foreign-born population - Other Western Africa (%)
Place of birth for the foreign-born population - Australia (%)
Place of birth for the foreign-born population - New Zealand (%)
Place of birth for the foreign-born population - Fiji (%)
Place of birth for the foreign-born population - Micronesia (%)
Place of birth for the foreign-born population - Bahamas (%)
Place of birth for the foreign-born population - Barbados (%)
Place of birth for the foreign-born population - Cuba (%)
Place of birth for the foreign-born population - Dominica (%)
Place of birth for the foreign-born population - Dominican Republic (%)
Place of birth for the foreign-born population - Grenada (%)
Place of birth for the foreign-born population - Haiti (%)
Place of birth for the foreign-born population - Jamaica (%)
Place of birth for the foreign-born population - St. Vincent and the Grenadines (%)
Place of birth for the foreign-born population - Trinidad and Tobago (%)
Place of birth for the foreign-born population - West Indies (%)
Place of birth for the foreign-born population - Other Caribbean (%)
Place of birth for the foreign-born population - Belize (%)
Place of birth for the foreign-born population - Costa Rica (%)
Place of birth for the foreign-born population - El Salvador (%)
Place of birth for the foreign-born population - Guatemala (%)
Place of birth for the foreign-born population - Honduras (%)
Place of birth for the foreign-born population - Mexico (%)
Place of birth for the foreign-born population - Nicaragua (%)
Place of birth for the foreign-born population - Panama (%)
Place of birth for the foreign-born population - Other Central America (%)
Place of birth for the foreign-born population - Argentina (%)
Place of birth for the foreign-born population - Bolivia (%)
Place of birth for the foreign-born population - Brazil (%)
Place of birth for the foreign-born population - Chile (%)
Place of birth for the foreign-born population - Colombia (%)
Place of birth for the foreign-born population - Ecuador (%)
Place of birth for the foreign-born population - Guyana (%)
Place of birth for the foreign-born population - Peru (%)
Place of birth for the foreign-born population - Uruguay (%)
Place of birth for the foreign-born population - Venezuela (%)
Place of birth for the foreign-born population - Other South America (%)
Place of birth for the foreign-born population - Canada (%)
Place of birth for the foreign-born population - Other Northern America (%)
Place of birth for the foreign-born population - Other (%)
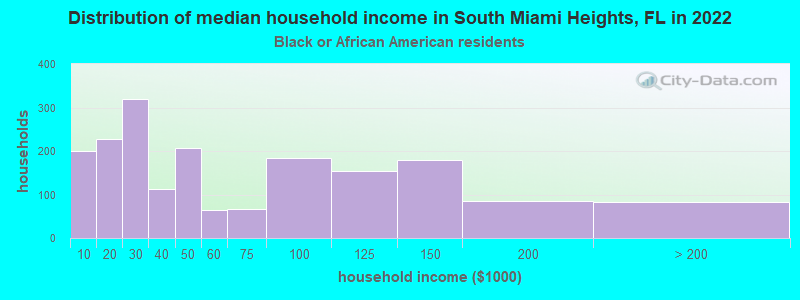
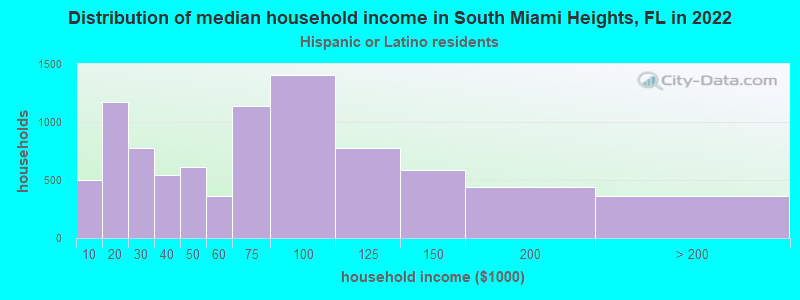
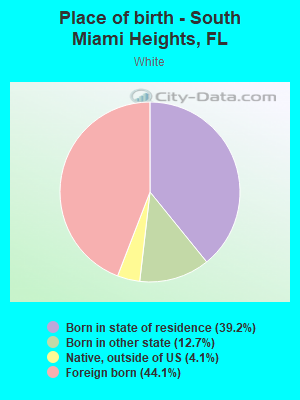
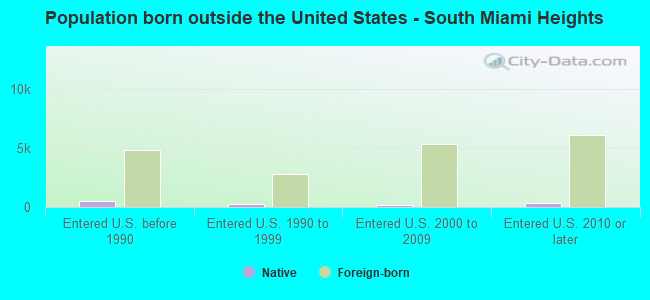
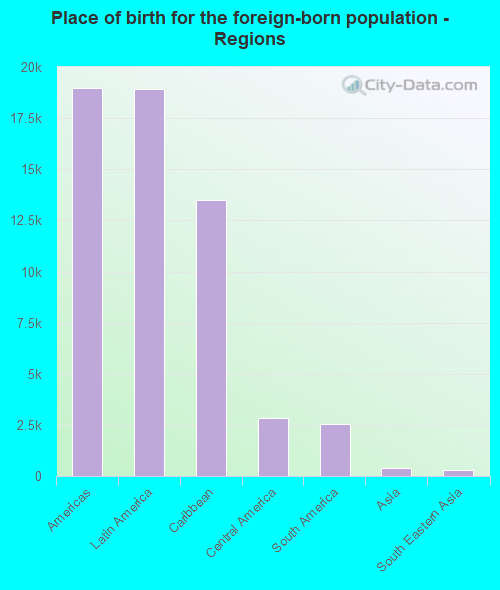
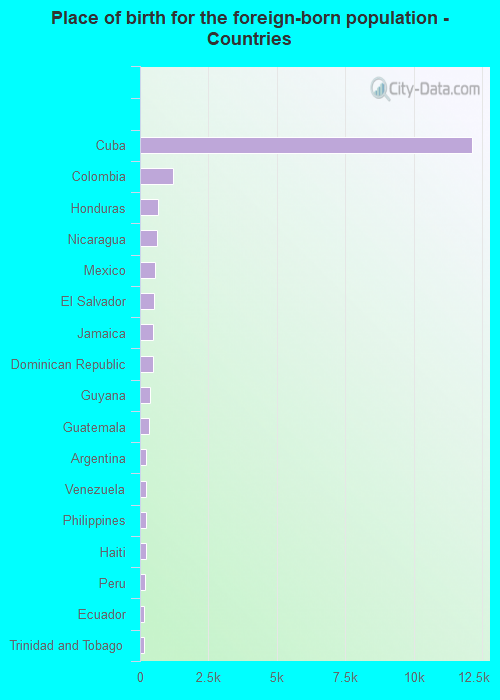
According to 2022 data, the most numerous races in South Miami Heights, FL are White alone (2,045 residents), Hispanic (26,537 residents), and Black alone (5,096 residents). 27.0% of South Miami Heights residents speak English at home. 54.9% of South Miami Heights, FL residents are foreign-born (53.0% born in Latin America), which is 61.7% greater than the foreign-born rate of 21.0% across the entire state of Florida.
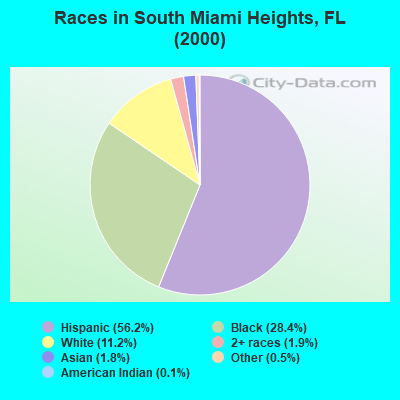
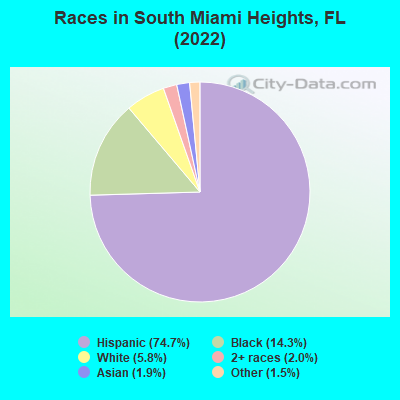
Race distribution in South Miami Heights
2000 2022
10,458,509 65.4% White alone 2,682,715 16.8% Hispanic 2,264,268 14.2% Black alone 261,693 1.6% Asian alone 236,954 1.5% Two or more races 42,358 0.3% American Indian alone 28,994 0.2% Other race alone 6,887 0.04% Native Hawaiian and Other
11,309,403 50.8% White alone 6,025,039 27.1% Hispanic 3,241,015 14.6% Black alone 861,630 3.9% Two or more races 623,692 2.8% Asian alone 152,054 0.7% Other race alone 22,504 0.1% American Indian alone 9,486 0.04% Native Hawaiian and Other
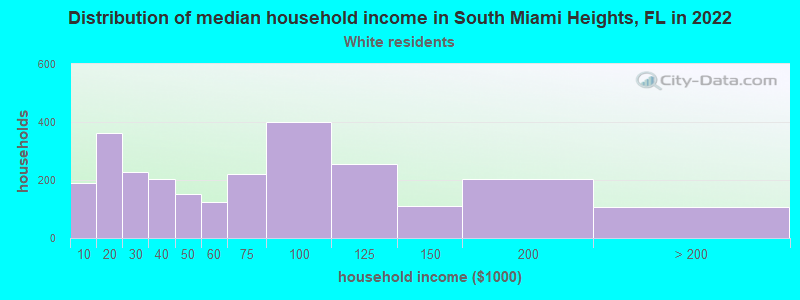
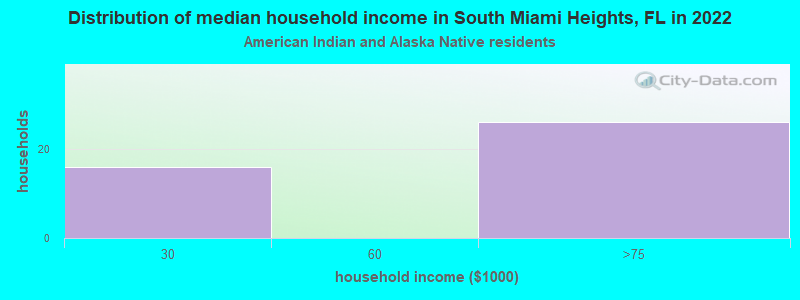
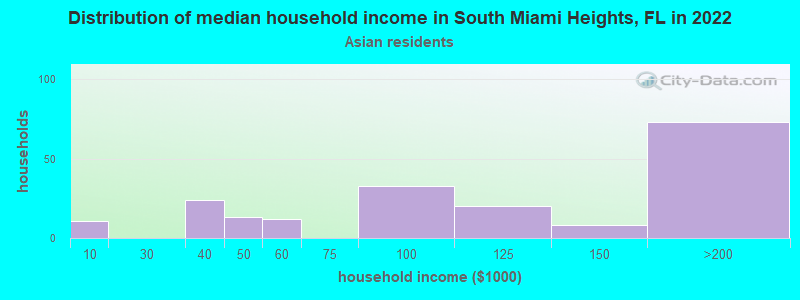
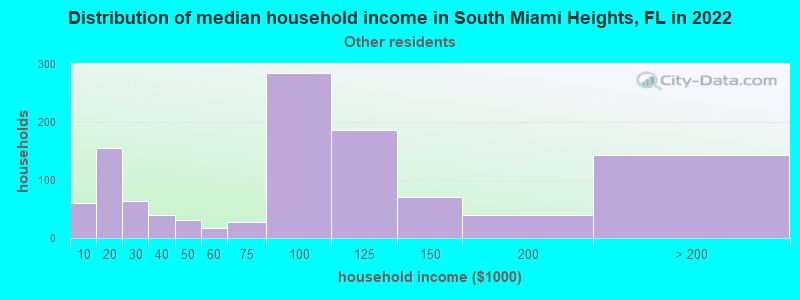
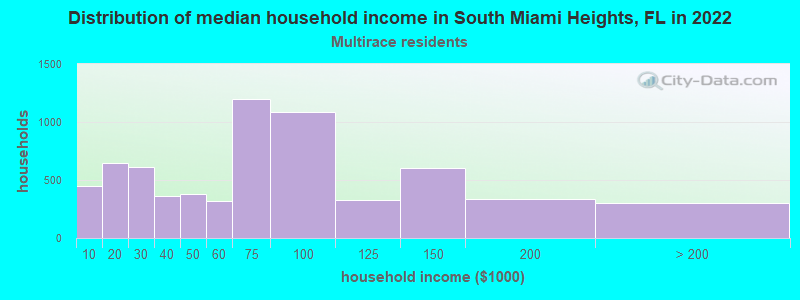
Income and house value in South Miami Heights Median household income in 2022 $60,770 White non-Hispanic householders$43,703 Black householders$110,802 Asian householders$85,555 Some other race householders$67,505 Two or more races householders$65,102 Hispanic or Latino race householdersMedian 2022 house value $366,894 White Non-Hispanic householders$385,842 Black or African American householders$484,456 American Indian or Alaska Native householders $393,593 Asian householders$381,536 Some other race householders$395,746 Two or more races householders$392,301 Hispanic or Latino householders
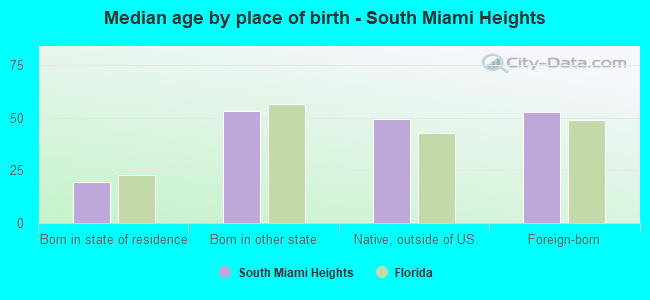
Median age by race in South Miami Heights
37.4 Median age for White residents35.8 38.7 37.0 Median age for Black or African American residents36.7 38.8 30.7 Median age for American Indian / Alaska Native residents25.1 52.1 43.0 Median age for Asian residents44.7 41.6 -679,849,340.2 Median age for Native Hawaiian / Pacific Islander residents-858,307,848.3 -443,298,968.6 42.6 Median age for Other race residents41.3 43.7 50.2 Median age for Two or more races residents49.6 50.3 39.0 Median age for White alone residents30.4 48.3 44.3 Median age for Hispanic or Latino residents42.1 47.0
Owner/renter occupied households by race in South Miami Heights
House owners and renters - White residents 1,875 67.6% Owner occupied897 32.4% Renter occupiedHouse owners and renters - Black or African American residents 1,062 58.7% Owner occupied746 41.3% Renter occupiedHouse owners and renters - American Indian / Alaska Native residents 9 25.8% Owner occupied26 74.2% Renter occupiedHouse owners and renters - Asian residents 166 86.1% Owner occupied27 13.9% Renter occupiedHouse owners and renters - Other race residents 722 69.2% Owner occupied322 30.8% Renter occupiedHouse owners and renters - Two or more races residents 4,145 62.5% Owner occupied2,484 37.5% Renter occupiedHouse owners and renters - White alone residents 572 84.3% Owner occupied106 15.7% Renter occupiedHouse owners and renters - Hispanic or Latino residents 5,465 62.4% Owner occupied3,289 37.6% Renter occupied
Language usage in South Miami Heights
English speakers - Total 27.0% of residents of South Miami Heights speak English at home.
70.8% of residents speak Spanish at home 9,698 40.5% Speak English very well14,235 59.5% Speak English less than very well2.4% of residents speak other language at home 592 72.2% Speak English very well228 27.8% Speak English less than very well
English speakers - Born in the United States 64.2% of residents of South Miami Heights speak English at home.
32.8% of residents speak Spanish at home 636 68.8% Speak English very well289 31.2% Speak English less than very well2.4% of residents speak other language at home 68 100.0% Speak English very well
English speakers - Native, born elsewhere 16.0% of residents of South Miami Heights speak English at home.
83.2% of residents speak Spanish at home 570 50.8% Speak English very well553 49.2% Speak English less than very well
English speakers - Foreign-born 9.6% of residents of South Miami Heights speak English at home.
88.2% of residents speak Spanish at home 4,136 24.1% Speak English very well12,999 75.9% Speak English less than very well2.9% of residents speak other language at home 335 60.5% Speak English very well219 39.5% Speak English less than very well
White (Caucasian) - Speak only English Native:
44.8% (1,875)Foreign-born:
5.3% (190)
White (Caucasian) - Speak another language Native:
51.6% (2,157)Foreign-born:
93.1% (3,336)
Black or African American - Speak only English Native:
92.7% (3,861)Foreign-born:
56.8% (586)
Black or African American - Speak another language Native:
7.3% (303)Foreign-born:
46.2% (477)
American Indian / Alaska Native - Speak another language Native:
66.7% (61)Foreign-born:
98.3% (45)
Asian - Speak only English Native:
100.0% (211)Foreign-born:
58.6% (295)
Other race - Speak only English Native:
30.8% (356)Foreign-born:
9.6% (246)
Other race - Speak another language Native:
69.4% (803)Foreign-born:
90.3% (2,314)
Two or more races - Speak only English Native:
20.3% (1,040)Foreign-born:
6.1% (746)
Two or more races - Speak another language Native:
79.7% (4,079)Foreign-born:
94.1% (11,527)
White alone - Speak another language Native:
20.4% (377)Foreign-born:
93.5% (53)
Hispanic or Latino - Speak only English Native:
15.7% (1,191)Foreign-born:
4.1% (725)
Hispanic or Latino - Speak another language Native:
84.3% (6,391)Foreign-born:
95.9% (16,959)
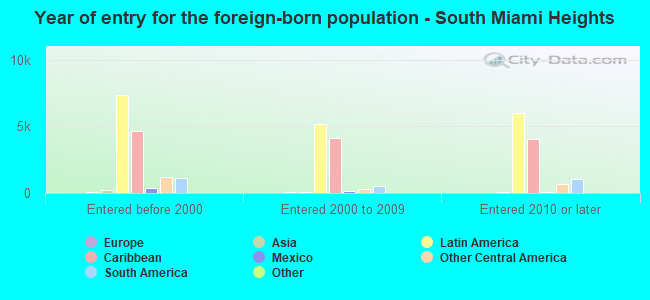
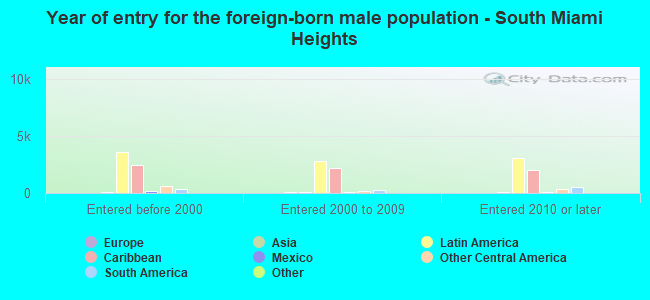
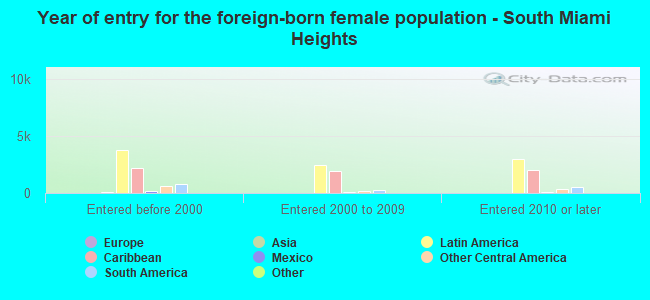
Foreign-born residents in South Miami Heights 19,480 residents are foreign born (53.0% Latin America ).
This city:
54.9%Florida:
21.1%
Marital status for residents in South Miami Heights Marital status - White (Caucasian) population 15 years and over
Males 33.6% Never married49.0% Now married3.9% Separated4.0% Widowed9.6% DivorcedFemales 29.5% Never married46.7% Now married1.5% Separated9.0% Widowed13.3% DivorcedWomen who gave birth in the past 12 months Now married:
71.0% (27)Unmarried:
29.0% (11)
Women who did not give birth in the past 12 months Now married:
44.0% (754)Unmarried:
56.0% (962)
Marital status - Black or African American population 15 years and over
Males 52.4% Never married41.4% Now married2.0% Separated1.3% Widowed3.0% DivorcedFemales 53.0% Never married32.2% Now married1.0% Separated4.1% Widowed9.7% DivorcedWomen who gave birth in the past 12 months Now married:
100.0% (11)Unmarried:
0.0% (0)
Women who did not give birth in the past 12 months Now married:
17.4% (214)Unmarried:
82.6% (1,018)
Marital status - American Indian / Alaska Native population 15 years and over
Males 36.5% Never married63.5% Now married0.0% Separated0.0% Widowed0.0% DivorcedFemales 50.0% Never married31.8% Now married0.0% Separated18.2% Widowed0.0% DivorcedWomen who did not give birth in the past 12 months Now married:
0.0% (0)Unmarried:
100.0% (35)
Marital status - Asian population 15 years and over
Males 24.6% Never married61.4% Now married0.0% Separated0.0% Widowed13.9% DivorcedFemales 27.4% Never married67.2% Now married0.0% Separated5.4% Widowed0.0% DivorcedWomen who did not give birth in the past 12 months Now married:
48.9% (71)Unmarried:
51.1% (74)
Marital status - Native Hawaiian / Pacific Islander population 15 years and over
Males 100.0% Never married0.0% Now married0.0% Separated0.0% Widowed0.0% DivorcedFemales 0.0% Never married100.0% Now married0.0% Separated0.0% Widowed0.0% DivorcedMarital status - Other race population 15 years and over
Males 37.4% Never married50.0% Now married0.0% Separated2.1% Widowed10.4% DivorcedFemales 30.7% Never married51.8% Now married6.0% Separated5.0% Widowed6.5% DivorcedWomen who gave birth in the past 12 months Now married:
54.5% (8)Unmarried:
45.5% (7)
Women who did not give birth in the past 12 months Now married:
47.5% (421)Unmarried:
52.5% (466)
Marital status - Two or more races population 15 years and over
Males 34.1% Never married46.2% Now married2.8% Separated1.0% Widowed15.9% DivorcedFemales 27.2% Never married40.9% Now married3.4% Separated9.6% Widowed18.8% DivorcedWomen who gave birth in the past 12 months Now married:
64.8% (91)Unmarried:
35.2% (49)
Women who did not give birth in the past 12 months Now married:
39.6% (1,435)Unmarried:
60.4% (2,191)
Marital status - White alone, not Hispanic / Latino population 15 years and over
Males 49.7% Never married31.7% Now married0.8% Separated13.0% Widowed4.9% DivorcedFemales 38.7% Never married28.2% Now married0.0% Separated16.7% Widowed16.4% DivorcedWomen who did not give birth in the past 12 months Now married:
17.7% (65)Unmarried:
82.3% (299)
Marital status - Hispanic or Latino population 15 years and over
Males 32.4% Never married49.6% Now married3.3% Separated1.9% Widowed12.7% DivorcedFemales 28.5% Never married46.1% Now married3.1% Separated8.5% Widowed13.7% DivorcedWomen who gave birth in the past 12 months Now married:
66.7% (109)Unmarried:
33.3% (55)
Women who did not give birth in the past 12 months Now married:
45.4% (2,453)Unmarried:
54.6% (2,956)
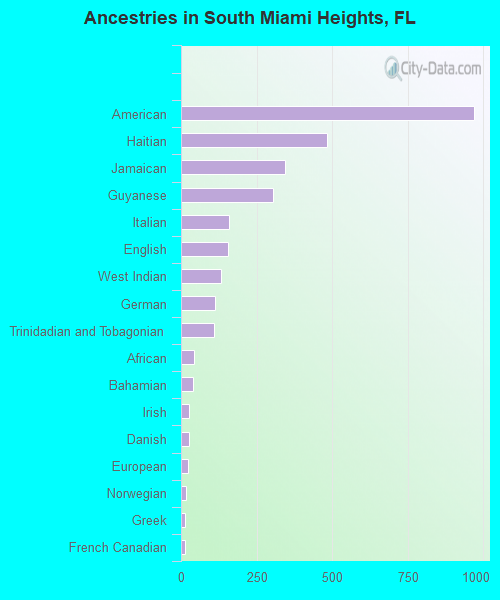
Ancestries in South Miami Heights
970 3.9% American484 1.9% Haitian344 1.4% Jamaican303 1.2% Guyanese159 0.6% Italian157 0.6% English132 0.5% West Indian112 0.4% German110 0.4% Trinidadian and Tobagonian44 0.2% African40 0.2% Bahamian27 0.1% Irish26 0.1% Danish23 0.09% European15 0.06% Norwegian13 0.05% Greek12 0.05% French Canadian8 0.03% Lebanese8 0.03% Dutch8 0.03% Portuguese7 0.03% Armenian6 0.02% Lithuanian6 0.02% Scotch-Irish6 0.02% Belizean3 0.01% Turkish2 0.01% Russian
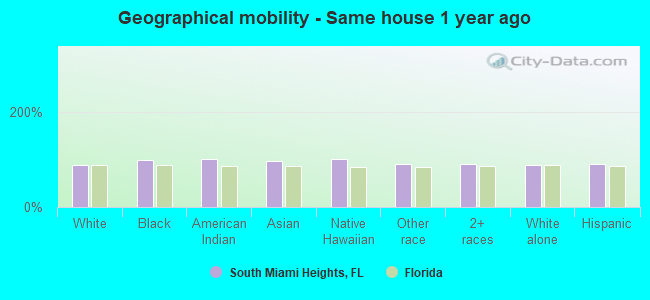
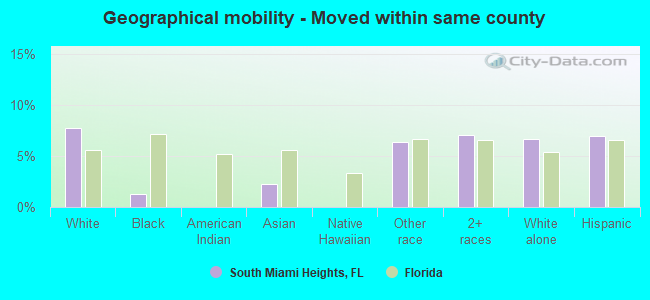
Geographical mobility in South Miami Heights Same house 1 year ago 7,517 88.3% White (Caucasian)5,343 98.2% Black or African American152 100.0% American Indian / Alaska Native683 95.5% Asian27 100.0% Native Hawaiian / Pacific Islander3,487 90.4% Other race16,165 89.7% Two or more races1,763 86.8% White alone, not Hispanic / Latino23,769 90.0% Hispanic or LatinoMoved within same county 657 7.7% White / Caucasian71 1.3% Black or African American16 2.3% Asian247 6.4% Other race1,272 7.1% Two or more races135 6.6% White alone, not Hispanic / Latino1,837 7.0% Hispanic or LatinoMoved within same state 30 0.4% White / Caucasian6 0.1% Black or African American57 0.3% Two or more races18 0.9% White alone, not Hispanic / Latino56 0.2% Hispanic or LatinoMoved from different state 168 2.0% White / Caucasian36 0.7% Black or African American97 2.5% Other race57 0.3% Two or more races112 5.5% White alone, not Hispanic / Latino126 0.5% Hispanic or LatinoMoved from abroad 53 0.6% White28 0.5% Black or African American40 5.5% Asian330 1.8% Two or more races11 0.5% White alone, not Hispanic / Latino372 1.4% Hispanic or Latino
Children Nativity (place of birth) in South Miami Heights
Children under 6 years - Living with two parents Both parents native 339 100.0% NativeBoth parents foreign-born 438 100.0% NativeOne native, one foreign-born parent 101 100.0% NativeChildren under 6 years - Living with one parent Native parent 384 99.7% Native1 0.3% Foreign-bornForeign-born parent 652 95.7% Native29 4.3% Foreign-bornChildren 6 to 17 years - Living with two parents Both parents native 562 98.5% Native8 1.5% Foreign-bornBoth parents foreign-born 1,138 76.2% Native356 23.8% Foreign-bornOne native, one foreign-born parent 301 100.0% NativeChildren 6 to 17 years - Living with one parent Native parent 808 100.0% NativeForeign-born parent 1,198 57.1% Native901 42.9% Foreign-born
Grandparents responsible for own grandchildren in South Miami Heights
Grandparents (30 to 59 years) White / Caucasian 112 100.0% Not responsible for grandchildrenBlack or African American 30 67.3% Responsible for grandchildren15 32.7% Not responsible for grandchildrenOther race 145 100.0% Not responsible for grandchildrenTwo or more races 16 5.0% Responsible for grandchildren293 95.0% Not responsible for grandchildrenHispanic or Latino 8 1.8% Responsible for grandchildren441 98.2% Not responsible for grandchildrenGrandparents (60 years and over) White / Caucasian 8 2.8% Responsible for grandchildren270 97.2% Not responsible for grandchildrenBlack or African American 19 8.8% Responsible for grandchildren194 91.2% Not responsible for grandchildrenOther race 95 100.0% Not responsible for grandchildrenTwo or more races 50 11.9% Responsible for grandchildren369 88.1% Not responsible for grandchildrenHispanic or Latino 53 7.5% Responsible for grandchildren662 92.5% Not responsible for grandchildren