Races in South Lockport, New York (NY) Detailed Stats
Data:
Races - White alone (%)
Races - White alone (% change since 2000)
Races - Black alone (%)
Races - Black alone (% change since 2000)
Races - American Indian alone (%)
Races - American Indian alone (% change since 2000)
Races - Asian alone (%)
Races - Asian alone (% change since 2000)
Races - Hispanic (%)
Races - Hispanic (% change since 2000)
Races - Native Hawaiian and Other Pacific Islander alone (%)
Races - Native Hawaiian and Other Pacific Islander alone (% change since 2000)
Races - Two or more races(%)
Races - Two or more races(% change since 2000)
Races - Other race alone (%)
Races - Other race alone (% change since 2000)
Racial diversity
Place of birth - Born in state of residence (%)
Place of birth - Born in state of residence (%) - White
Place of birth - Born in state of residence (%) - Black or African American
Place of birth - Born in state of residence (%) - Asian
Place of birth - Born in state of residence (%) - Hispanic or Latino
Place of birth - Born in state of residence (%) - American Indian and Alaska Native
Place of birth - Born in state of residence (%) - Multirace
Place of birth - Born in state of residence (%) - Other Race
Place of birth - Born in other state (%)
Place of birth - Born in other state (%) - White
Place of birth - Born in other state (%) - Black or African American
Place of birth - Born in other state (%) - Asian
Place of birth - Born in other state (%) - Hispanic or Latino
Place of birth - Born in other state (%) - American Indian and Alaska Native
Place of birth - Born in other state (%) - Multirace
Place of birth - Born in other state (%) - Other Race
Place of birth - Native, outside of US (%)
Place of birth - Native, outside of US (%) - White
Place of birth - Native, outside of US (%) - Black or African American
Place of birth - Native, outside of US (%) - Asian
Place of birth - Native, outside of US (%) - Hispanic or Latino
Place of birth - Native, outside of US (%) - American Indian and Alaska Native
Place of birth - Native, outside of US (%) - Multirace
Place of birth - Native, outside of US (%) - Other Race
Place of birth - Foreign born (%)
Place of birth - Foreign born (%) - White
Place of birth - Foreign born (%) - Black or African American
Place of birth - Foreign born (%) - Asian
Place of birth - Foreign born (%) - Hispanic or Latino
Place of birth - Foreign born (%) - American Indian and Alaska Native
Place of birth - Foreign born (%) - Multirace
Place of birth - Foreign born (%) - Other Race
Residents speaking English at home (%)
Residents speaking English at home - Born in the United States (%)
Residents speaking English at home - Native, born elsewhere (%)
Residents speaking English at home - Foreign born (%)
Residents speaking Spanish at home (%)
Residents speaking Spanish at home - Born in the United States (%)
Residents speaking Spanish at home - Native, born elsewhere (%)
Residents speaking Spanish at home - Foreign born (%)
Residents speaking other language at home (%)
Residents speaking other language at home - Born in the United States (%)
Residents speaking other language at home - Native, born elsewhere (%)
Residents speaking other language at home - Foreign born (%)
Marital status - Never married (%)
Marital status - Now married (%)
Marital status - Separated (%)
Marital status - Widowed (%)
Marital status - Divorced (%)
Ancestries Reported - Arab (%)
Ancestries Reported - Czech (%)
Ancestries Reported - Danish (%)
Ancestries Reported - Dutch (%)
Ancestries Reported - English (%)
Ancestries Reported - French (%)
Ancestries Reported - French Canadian (%)
Ancestries Reported - German (%)
Ancestries Reported - Greek (%)
Ancestries Reported - Hungarian (%)
Ancestries Reported - Irish (%)
Ancestries Reported - Italian (%)
Ancestries Reported - Lithuanian (%)
Ancestries Reported - Norwegian (%)
Ancestries Reported - Polish (%)
Ancestries Reported - Portuguese (%)
Ancestries Reported - Russian (%)
Ancestries Reported - Scotch-Irish (%)
Ancestries Reported - Scottish (%)
Ancestries Reported - Slovak (%)
Ancestries Reported - Subsaharan African (%)
Ancestries Reported - Swedish (%)
Ancestries Reported - Swiss (%)
Ancestries Reported - Ukrainian (%)
Ancestries Reported - United States (%)
Ancestries Reported - Welsh (%)
Ancestries Reported - West Indian (%)
Ancestries Reported - Other (%)
Geographical mobility - Same house 1 year ago (%)
Geographical mobility - Same house 1 year ago (%) - White
Geographical mobility - Same house 1 year ago (%) - Black or African American
Geographical mobility - Same house 1 year ago (%) - Asian
Geographical mobility - Same house 1 year ago (%) - Hispanic or Latino
Geographical mobility - Same house 1 year ago (%) - American Indian and Alaska Native
Geographical mobility - Same house 1 year ago (%) - Multirace
Geographical mobility - Same house 1 year ago (%) - Other Race
Geographical mobility - Moved within same county (%)
Geographical mobility - Moved within same county (%) - White
Geographical mobility - Moved within same county (%) - Black or African American
Geographical mobility - Moved within same county (%) - Asian
Geographical mobility - Moved within same county (%) - Hispanic or Latino
Geographical mobility - Moved within same county (%) - American Indian and Alaska Native
Geographical mobility - Moved within same county (%) - Multirace
Geographical mobility - Moved within same county (%) - Other Race
Geographical mobility - Moved from different county within same state (%)
Geographical mobility - Moved from different county within same state (%) - White
Geographical mobility - Moved from different county within same state (%) - Black or African American
Geographical mobility - Moved from different county within same state (%) - Asian
Geographical mobility - Moved from different county within same state (%) - Hispanic or Latino
Geographical mobility - Moved from different county within same state (%) - American Indian and Alaska Native
Geographical mobility - Moved from different county within same state (%) - Multirace
Geographical mobility - Moved from different county within same state (%) - Other Race
Geographical mobility - Moved from different state (%)
Geographical mobility - Moved from different state (%) - White
Geographical mobility - Moved from different state (%) - Black or African American
Geographical mobility - Moved from different state (%) - Asian
Geographical mobility - Moved from different state (%) - Hispanic or Latino
Geographical mobility - Moved from different state (%) - American Indian and Alaska Native
Geographical mobility - Moved from different state (%) - Multirace
Geographical mobility - Moved from different state (%) - Other Race
Geographical mobility - Moved from abroad (%)
Geographical mobility - Moved from abroad (%) - White
Geographical mobility - Moved from abroad (%) - Black or African American
Geographical mobility - Moved from abroad (%) - Asian
Geographical mobility - Moved from abroad (%) - Hispanic or Latino
Geographical mobility - Moved from abroad (%) - American Indian and Alaska Native
Geographical mobility - Moved from abroad (%) - Multirace
Geographical mobility - Moved from abroad (%) - Other Race
Place of birth for the foreign-born population - Ireland (%)
Place of birth for the foreign-born population - Denmark (%)
Place of birth for the foreign-born population - Norway (%)
Place of birth for the foreign-born population - Sweden (%)
Place of birth for the foreign-born population - United Kingdom (%)
Place of birth for the foreign-born population - England (%)
Place of birth for the foreign-born population - Scotland (%)
Place of birth for the foreign-born population - Other Northern Europe (%)
Place of birth for the foreign-born population - Austria (%)
Place of birth for the foreign-born population - Belgium (%)
Place of birth for the foreign-born population - France (%)
Place of birth for the foreign-born population - Germany (%)
Place of birth for the foreign-born population - Netherlands (%)
Place of birth for the foreign-born population - Switzerland (%)
Place of birth for the foreign-born population - Other Western Europe (%)
Place of birth for the foreign-born population - Greece (%)
Place of birth for the foreign-born population - Italy (%)
Place of birth for the foreign-born population - Portugal (%)
Place of birth for the foreign-born population - Spain (%)
Place of birth for the foreign-born population - Other Southern Europe (%)
Place of birth for the foreign-born population - Albania (%)
Place of birth for the foreign-born population - Belarus (%)
Place of birth for the foreign-born population - Bosnia and Herzegovina (%)
Place of birth for the foreign-born population - Bulgaria (%)
Place of birth for the foreign-born population - Croatia (%)
Place of birth for the foreign-born population - Czechoslovakia (%)
Place of birth for the foreign-born population - Hungary (%)
Place of birth for the foreign-born population - Latvia (%)
Place of birth for the foreign-born population - Lithuania (%)
Place of birth for the foreign-born population - North Macedonia (Macedonia) (%)
Place of birth for the foreign-born population - Moldova (%)
Place of birth for the foreign-born population - Poland (%)
Place of birth for the foreign-born population - Romania (%)
Place of birth for the foreign-born population - Russia (%)
Place of birth for the foreign-born population - Serbia (%)
Place of birth for the foreign-born population - Ukraine (%)
Place of birth for the foreign-born population - Other Eastern Europe (%)
Place of birth for the foreign-born population - China (%)
Place of birth for the foreign-born population - Hong Kong (%)
Place of birth for the foreign-born population - Taiwan (%)
Place of birth for the foreign-born population - Japan (%)
Place of birth for the foreign-born population - Korea (%)
Place of birth for the foreign-born population - Other Eastern Asia (%)
Place of birth for the foreign-born population - Afghanistan (%)
Place of birth for the foreign-born population - Bangladesh (%)
Place of birth for the foreign-born population - India (%)
Place of birth for the foreign-born population - Iran (%)
Place of birth for the foreign-born population - Kazakhstan (%)
Place of birth for the foreign-born population - Nepal (%)
Place of birth for the foreign-born population - Pakistan (%)
Place of birth for the foreign-born population - Sri Lanka (%)
Place of birth for the foreign-born population - Uzbekistan (%)
Place of birth for the foreign-born population - Other South Central Asia (%)
Place of birth for the foreign-born population - Burma (%)
Place of birth for the foreign-born population - Cambodia (%)
Place of birth for the foreign-born population - Indonesia (%)
Place of birth for the foreign-born population - Laos (%)
Place of birth for the foreign-born population - Malaysia (%)
Place of birth for the foreign-born population - Philippines (%)
Place of birth for the foreign-born population - Singapore (%)
Place of birth for the foreign-born population - Thailand (%)
Place of birth for the foreign-born population - Vietnam (%)
Place of birth for the foreign-born population - Other South Eastern Asia (%)
Place of birth for the foreign-born population - Armenia (%)
Place of birth for the foreign-born population - Iraq (%)
Place of birth for the foreign-born population - Israel (%)
Place of birth for the foreign-born population - Jordan (%)
Place of birth for the foreign-born population - Kuwait (%)
Place of birth for the foreign-born population - Lebanon (%)
Place of birth for the foreign-born population - Saudi Arabia (%)
Place of birth for the foreign-born population - Syria (%)
Place of birth for the foreign-born population - Turkey (%)
Place of birth for the foreign-born population - Yemen (%)
Place of birth for the foreign-born population - Other Western Asia (%)
Place of birth for the foreign-born population - Eritrea (%)
Place of birth for the foreign-born population - Ethiopia (%)
Place of birth for the foreign-born population - Kenya (%)
Place of birth for the foreign-born population - Somalia (%)
Place of birth for the foreign-born population - Uganda (%)
Place of birth for the foreign-born population - Zimbabwe (%)
Place of birth for the foreign-born population - Other Eastern Africa (%)
Place of birth for the foreign-born population - Cameroon (%)
Place of birth for the foreign-born population - Congo (%)
Place of birth for the foreign-born population - Democratic Republic of Congo (Zaire) (%)
Place of birth for the foreign-born population - Other Middle Africa (%)
Place of birth for the foreign-born population - Egypt (%)
Place of birth for the foreign-born population - Morocco (%)
Place of birth for the foreign-born population - Sudan (%)
Place of birth for the foreign-born population - Other Northern Africa (%)
Place of birth for the foreign-born population - South Africa (%)
Place of birth for the foreign-born population - Other Southern Africa (%)
Place of birth for the foreign-born population - Cabo Verde (%)
Place of birth for the foreign-born population - Ghana (%)
Place of birth for the foreign-born population - Liberia (%)
Place of birth for the foreign-born population - Nigeria (%)
Place of birth for the foreign-born population - Senegal (%)
Place of birth for the foreign-born population - Sierra Leone (%)
Place of birth for the foreign-born population - Other Western Africa (%)
Place of birth for the foreign-born population - Australia (%)
Place of birth for the foreign-born population - New Zealand (%)
Place of birth for the foreign-born population - Fiji (%)
Place of birth for the foreign-born population - Micronesia (%)
Place of birth for the foreign-born population - Bahamas (%)
Place of birth for the foreign-born population - Barbados (%)
Place of birth for the foreign-born population - Cuba (%)
Place of birth for the foreign-born population - Dominica (%)
Place of birth for the foreign-born population - Dominican Republic (%)
Place of birth for the foreign-born population - Grenada (%)
Place of birth for the foreign-born population - Haiti (%)
Place of birth for the foreign-born population - Jamaica (%)
Place of birth for the foreign-born population - St. Vincent and the Grenadines (%)
Place of birth for the foreign-born population - Trinidad and Tobago (%)
Place of birth for the foreign-born population - West Indies (%)
Place of birth for the foreign-born population - Other Caribbean (%)
Place of birth for the foreign-born population - Belize (%)
Place of birth for the foreign-born population - Costa Rica (%)
Place of birth for the foreign-born population - El Salvador (%)
Place of birth for the foreign-born population - Guatemala (%)
Place of birth for the foreign-born population - Honduras (%)
Place of birth for the foreign-born population - Mexico (%)
Place of birth for the foreign-born population - Nicaragua (%)
Place of birth for the foreign-born population - Panama (%)
Place of birth for the foreign-born population - Other Central America (%)
Place of birth for the foreign-born population - Argentina (%)
Place of birth for the foreign-born population - Bolivia (%)
Place of birth for the foreign-born population - Brazil (%)
Place of birth for the foreign-born population - Chile (%)
Place of birth for the foreign-born population - Colombia (%)
Place of birth for the foreign-born population - Ecuador (%)
Place of birth for the foreign-born population - Guyana (%)
Place of birth for the foreign-born population - Peru (%)
Place of birth for the foreign-born population - Uruguay (%)
Place of birth for the foreign-born population - Venezuela (%)
Place of birth for the foreign-born population - Other South America (%)
Place of birth for the foreign-born population - Canada (%)
Place of birth for the foreign-born population - Other Northern America (%)
Place of birth for the foreign-born population - Other (%)
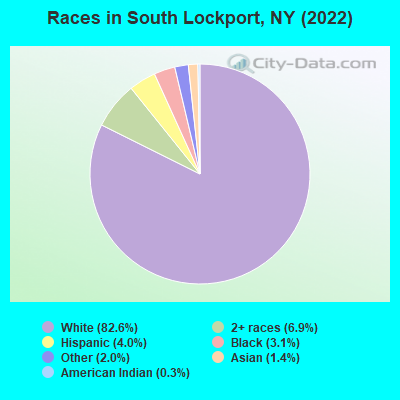
According to 2022 data, the most numerous races in South Lockport, NY are White alone (6,900 residents), Hispanic (331 residents), and Black alone (258 residents). 94.6% of South Lockport residents speak English at home. 4.1% of South Lockport, NY residents are foreign-born (1.3% born in Europe, 1.2% born in North America, 1.2% born in Latin America, 0.4% born in Asia), which is 430.9% less than the foreign-born rate of 22.0% across the entire state of New York.
Race distribution in South Lockport
2000 2022
11,760,981 62.0% White alone 2,867,583 15.1% Hispanic 2,812,623 14.8% Black alone 1,035,926 5.5% Asian alone 366,116 1.9% Two or more races 75,499 0.4% Other race alone 52,499 0.3% American Indian alone 5,230 0.03% Native Hawaiian and Other
10,408,933 52.9% White alone 3,867,299 19.7% Hispanic 2,633,840 13.4% Black alone 1,776,286 9.0% Asian alone 732,670 3.7% Two or more races 216,110 1.1% Other race alone 35,082 0.2% American Indian alone 6,931 0.04% Native Hawaiian and Other
Income and house value in South Lockport Median household income in 2022 $45,558 White non-Hispanic householders$45,863 Black householders$11,621 Some other race householdersMedian 2022 house value $206,386 White Non-Hispanic householders$176,965 Black or African American householders$356,784 Two or more races householders
Median age by race in South Lockport
46.6 Median age for White residents43.9 48.7 41.4 Median age for Black or African American residents47.0 36.2 -616,302,186.3 Median age for American Indian / Alaska Native residents-449,999,999.5 -1,014,925,372.1 37.8 Median age for Asian residents-1,166,666,665.5 43.8 -487,992,314.6 Median age for Native Hawaiian / Pacific Islander residents-666,666,666.0 -666,666,666.0 44.8 Median age for Other race residents46.9 61.5 23.7 Median age for Two or more races residents43.9 23.3 47.3 Median age for White alone residents46.0 49.2 6.7 Median age for Hispanic or Latino residents5.0 11.0
Owner/renter occupied households by race in South Lockport
House owners and renters - White residents 2,378 66.3% Owner occupied1,207 33.7% Renter occupiedHouse owners and renters - Black or African American residents 49 33.6% Owner occupied98 66.4% Renter occupiedHouse owners and renters - Asian residents 29 100.0% Renter occupiedHouse owners and renters - Other race residents 97 100.0% Renter occupiedHouse owners and renters - Two or more races residents 125 54.5% Owner occupied104 45.5% Renter occupiedHouse owners and renters - White alone residents 2,369 66.3% Owner occupied1,206 33.7% Renter occupiedHouse owners and renters - Hispanic or Latino residents 10 39.8% Owner occupied16 60.2% Renter occupied
Language usage in South Lockport
English speakers - Total 94.6% of residents of South Lockport speak English at home.
1.7% of residents speak Spanish at home 37 27.0% Speak English very well100 73.0% Speak English less than very well3.6% of residents speak other language at home 120 41.5% Speak English very well169 58.5% Speak English less than very well
English speakers - Born in the United States 87.3% of residents of South Lockport speak English at home.
5.7% of residents speak Spanish at home 59 100.0% Speak English less than very well2.0% of residents speak other language at home 21 100.0% Speak English very well
All residents speak only English at home
English speakers - Foreign-born 46.9% of residents of South Lockport speak English at home.
4.1% of residents speak Spanish at home 19 100.0% Speak English very well46.5% of residents speak other language at home 42 19.4% Speak English very well175 80.6% Speak English less than very well
White (Caucasian) - Speak only English Native:
99.8% (6,544)Foreign-born:
43.6% (128)
White (Caucasian) - Speak another language Native:
0.6% (38)Foreign-born:
56.7% (166)
Black or African American - Speak only English Native:
97.3% (226)Foreign-born:
79.9% (67)
Asian - Speak another language Native:
21.8% (13)Foreign-born:
100.0% (44)
Other race - Speak only English Native:
50.1% (91)Foreign-born:
43.0% (9)
Other race - Speak another language Native:
52.4% (96)Foreign-born:
57.8% (12)
Two or more races - Speak only English Native:
88.3% (423)Foreign-born:
59.2% (32)
White alone - Speak only English Native:
99.7% (6,433)Foreign-born:
43.2% (128)
White alone - Speak another language Native:
0.6% (38)Foreign-born:
57.5% (170)
Hispanic or Latino - Speak only English Native:
86.9% (163)Foreign-born:
38.5% (8)
Foreign-born residents in South Lockport 346 residents are foreign born (1.3% Europe , 1.2% North America , 1.2% Latin America , 0.4% Asia ).
This city:
4.1%New York:
22.6%
Marital status for residents in South Lockport Marital status - White (Caucasian) population 15 years and over
Males 35.5% Never married43.2% Now married2.5% Separated6.1% Widowed12.8% DivorcedFemales 27.7% Never married44.0% Now married3.6% Separated11.7% Widowed12.9% DivorcedWomen who did not give birth in the past 12 months Now married:
43.2% (661)Unmarried:
56.8% (869)
Marital status - Black or African American population 15 years and over
Males 27.4% Never married38.4% Now married19.2% Separated0.0% Widowed15.1% DivorcedFemales 72.4% Never married15.4% Now married0.0% Separated0.0% Widowed12.2% DivorcedWomen who did not give birth in the past 12 months Now married:
30.5% (16)Unmarried:
69.5% (37)
Marital status - Other race population 15 years and over
Males 82.7% Never married0.0% Now married0.0% Separated0.0% Widowed17.3% DivorcedFemales 0.0% Never married0.0% Now married0.0% Separated82.6% Widowed17.4% DivorcedWomen who did not give birth in the past 12 months Now married:
0.0% (0)Unmarried:
100.0% (12)
Marital status - Two or more races population 15 years and over
Males 21.0% Never married60.8% Now married0.0% Separated0.0% Widowed18.2% DivorcedFemales 55.2% Never married32.2% Now married0.0% Separated0.0% Widowed12.6% DivorcedWomen who did not give birth in the past 12 months Now married:
23.9% (43)Unmarried:
76.1% (136)
Marital status - White alone, not Hispanic / Latino population 15 years and over
Males 36.0% Never married42.3% Now married2.5% Separated6.2% Widowed13.0% DivorcedFemales 27.8% Never married43.8% Now married3.6% Separated11.8% Widowed13.0% DivorcedWomen who did not give birth in the past 12 months Now married:
43.2% (662)Unmarried:
56.8% (871)
Marital status - Hispanic or Latino population 15 years and over
Males 0.0% Never married100.0% Now married0.0% Separated0.0% Widowed0.0% DivorcedFemales 0.0% Never married63.3% Now married0.0% Separated0.0% Widowed36.7% DivorcedWomen who did not give birth in the past 12 months Now married:
0.0% (0)Unmarried:
100.0% (11)
Ancestries in South Lockport
549 18.7% Italian548 18.7% English520 17.8% German203 6.9% Polish191 6.5% Irish185 6.3% American76 2.6% Norwegian55 1.9% French Canadian43 1.5% Swedish25 0.9% Jamaican20 0.7% Russian17 0.6% British14 0.5% Danish13 0.4% Hungarian12 0.4% Romanian12 0.4% Swiss9 0.3% French8 0.3% Scandinavian6 0.2% Austrian
Children Nativity (place of birth) in South Lockport
Children under 6 years - Living with two parents Both parents native 111 100.0% NativeBoth parents foreign-born 21 100.0% NativeOne native, one foreign-born parent 33 100.0% NativeChildren under 6 years - Living with one parent Native parent 239 100.0% NativeChildren 6 to 17 years - Living with two parents Both parents native 421 98.3% Native7 1.7% Foreign-bornChildren 6 to 17 years - Living with one parent Native parent 369 100.0% NativeForeign-born parent 41 50.4% Native40 49.6% Foreign-born
Grandparents responsible for own grandchildren in South Lockport
Grandparents (30 to 59 years) White / Caucasian 31 100.0% Not responsible for grandchildrenBlack or African American 14 100.0% Not responsible for grandchildrenWhite alone, not Hispanic / Latino 37 100.0% Not responsible for grandchildren
Grandparents (60 years and over) White / Caucasian 24 100.0% Not responsible for grandchildrenWhite alone, not Hispanic / Latino 26 100.0% Not responsible for grandchildren