Races in Snow Hill, Tennessee (TN) Detailed Stats
Ancestries, Foreign-born residents, place of birth
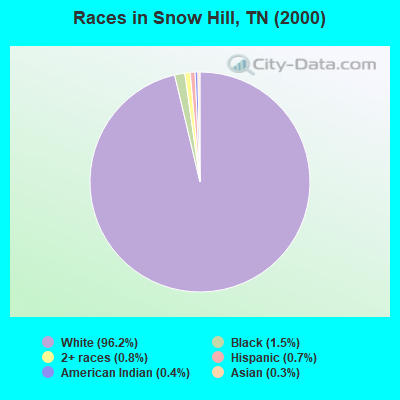
Race distribution in Snow Hill

- 12,02796.2%White alone
- 1851.5%Black alone
- 1020.8%Two or more races
- 910.7%Hispanic
- 540.4%American Indian alone
- 410.3%Asian alone
- 50.04%Other race alone
- 20.02%Native Hawaiian and Other
Pacific Islander alone
2000
2022
-
- 4,505,93079.2%White alone
- 928,20416.3%Black alone
- 123,8382.2%Hispanic
- 54,8241.0%Two or more races
- 56,0771.0%Asian alone
- 13,8200.2%American Indian alone
- 4,7800.08%Other race alone
- 1,8100.03%Native Hawaiian and Other
Pacific Islander alone

-
- 5,070,02671.9%White alone
- 1,089,73815.5%Black alone
- 442,6296.3%Hispanic
- 279,3814.0%Two or more races
- 131,8171.9%Asian alone
- 26,9720.4%Other race alone
- 6,3870.09%American Indian alone
- 4,3890.06%Native Hawaiian and Other
Pacific Islander alone

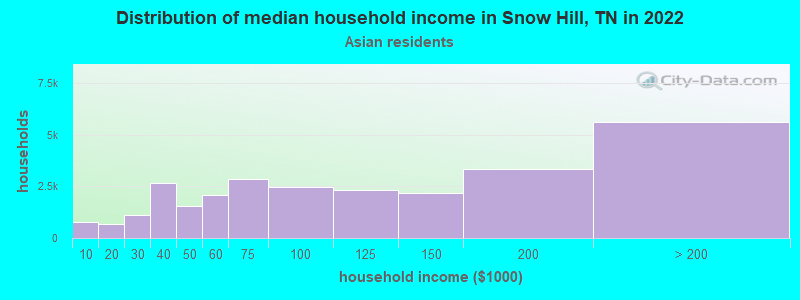
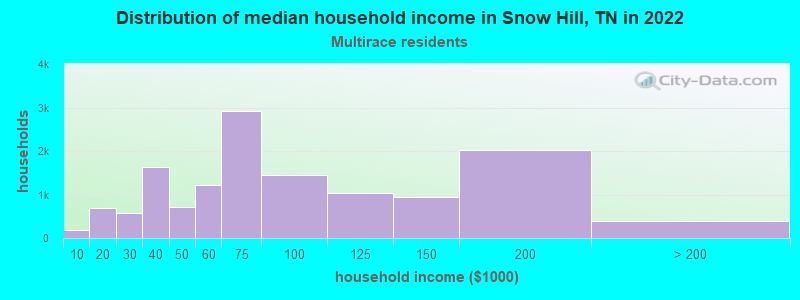
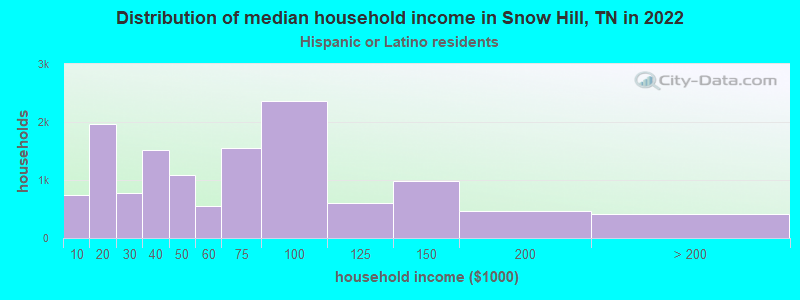
Income and house value in Snow Hill
- Median household income in 2022
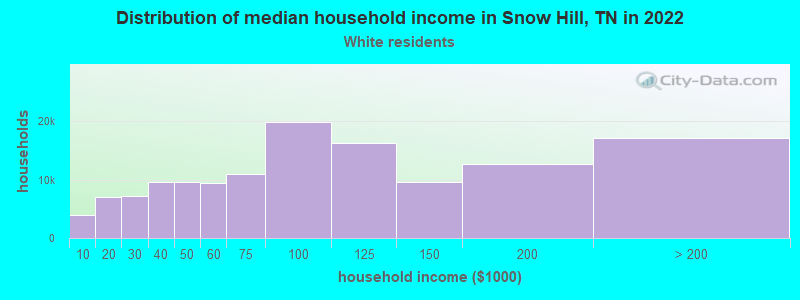
- $100,224White non-Hispanic householders
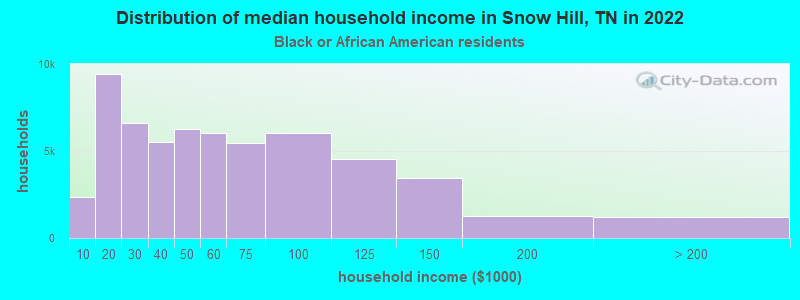
- $106,761Black householders
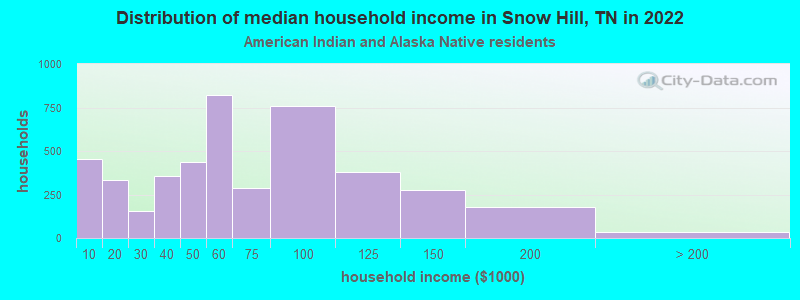
- $49,921American Indian and Alaska Native householders
- $73,558Asian householders
- $121,281Some other race householders
- $132,923Two or more races householders
- $109,143Hispanic or Latino race householders
- Median 2022 house value
- $356,522White Non-Hispanic householders
- $578,901Black or African American householders
- $366,290Some other race householders
- $309,311Two or more races householders
- $343,498Hispanic or Latino householders
Household income for White non-Hispanic householders
Household income for Black householders
Household income for American Indian and Alaska Native householders
Household income for Asian householders
Household income for Two or more races householders
Household income for Hispanic or Latino race householders
Zip code: 37363