Races in Sleepy Hollow, New York (NY) Detailed Stats
Data:
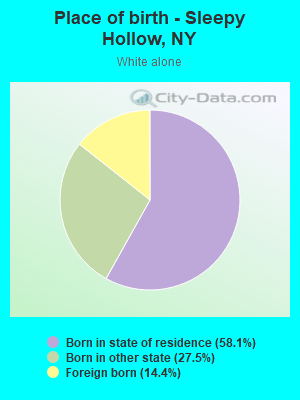
Races - White alone (%)
Races - White alone (% change since 2000)
Races - Black alone (%)
Races - Black alone (% change since 2000)
Races - American Indian alone (%)
Races - American Indian alone (% change since 2000)
Races - Asian alone (%)
Races - Asian alone (% change since 2000)
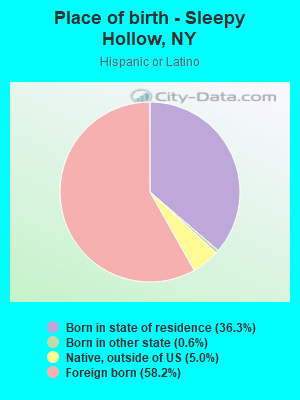
Races - Hispanic (%)
Races - Hispanic (% change since 2000)
Races - Native Hawaiian and Other Pacific Islander alone (%)
Races - Native Hawaiian and Other Pacific Islander alone (% change since 2000)
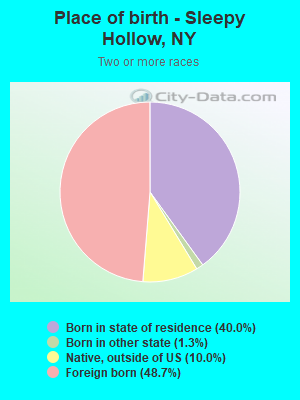
Races - Two or more races(%)
Races - Two or more races(% change since 2000)
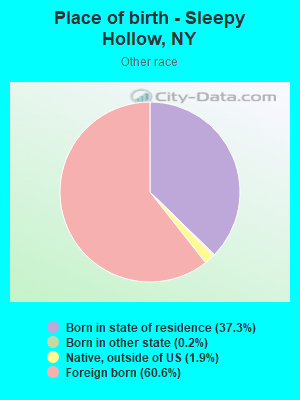
Races - Other race alone (%)
Races - Other race alone (% change since 2000)
Racial diversity
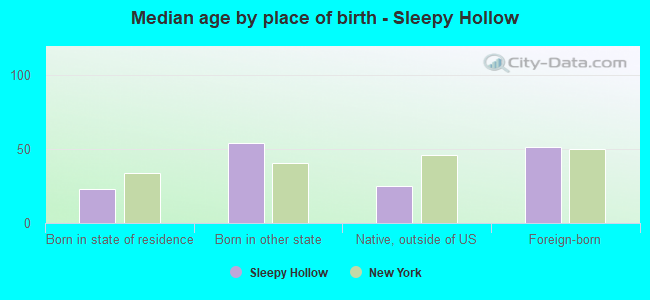
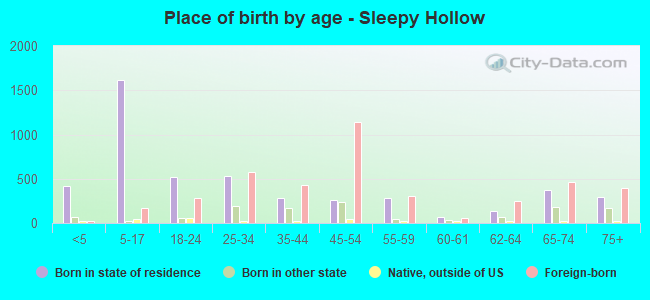
Place of birth - Born in state of residence (%)
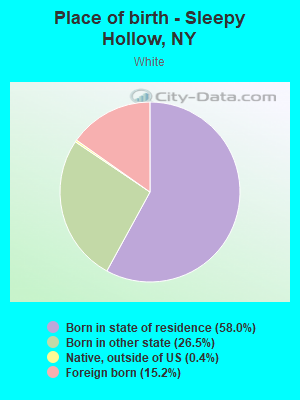
Place of birth - Born in state of residence (%) - White
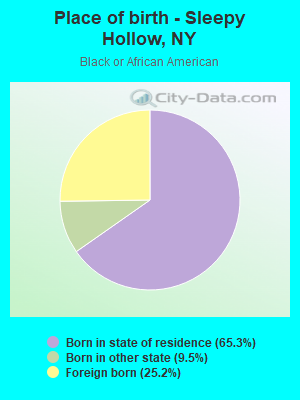
Place of birth - Born in state of residence (%) - Black or African American
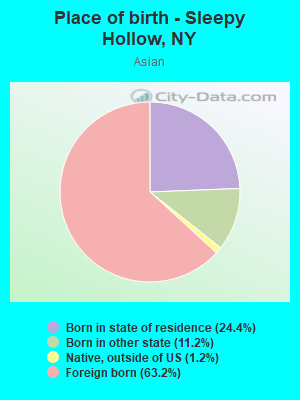
Place of birth - Born in state of residence (%) - Asian
Place of birth - Born in state of residence (%) - Hispanic or Latino
Place of birth - Born in state of residence (%) - American Indian and Alaska Native
Place of birth - Born in state of residence (%) - Multirace
Place of birth - Born in state of residence (%) - Other Race
Place of birth - Born in other state (%)
Place of birth - Born in other state (%) - White
Place of birth - Born in other state (%) - Black or African American
Place of birth - Born in other state (%) - Asian
Place of birth - Born in other state (%) - Hispanic or Latino
Place of birth - Born in other state (%) - American Indian and Alaska Native
Place of birth - Born in other state (%) - Multirace
Place of birth - Born in other state (%) - Other Race
Place of birth - Native, outside of US (%)
Place of birth - Native, outside of US (%) - White
Place of birth - Native, outside of US (%) - Black or African American
Place of birth - Native, outside of US (%) - Asian
Place of birth - Native, outside of US (%) - Hispanic or Latino
Place of birth - Native, outside of US (%) - American Indian and Alaska Native
Place of birth - Native, outside of US (%) - Multirace
Place of birth - Native, outside of US (%) - Other Race
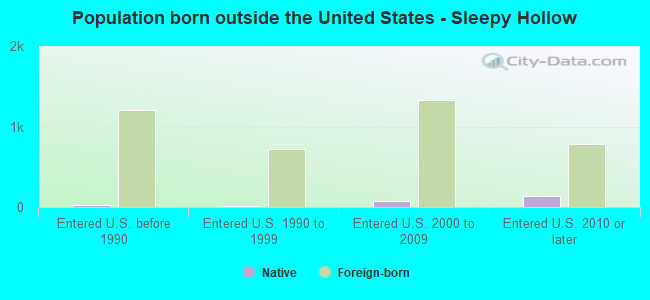
Place of birth - Foreign born (%)
Place of birth - Foreign born (%) - White
Place of birth - Foreign born (%) - Black or African American
Place of birth - Foreign born (%) - Asian
Place of birth - Foreign born (%) - Hispanic or Latino
Place of birth - Foreign born (%) - American Indian and Alaska Native
Place of birth - Foreign born (%) - Multirace
Place of birth - Foreign born (%) - Other Race
Residents speaking English at home (%)
Residents speaking English at home - Born in the United States (%)
Residents speaking English at home - Native, born elsewhere (%)
Residents speaking English at home - Foreign born (%)
Residents speaking Spanish at home (%)
Residents speaking Spanish at home - Born in the United States (%)
Residents speaking Spanish at home - Native, born elsewhere (%)
Residents speaking Spanish at home - Foreign born (%)
Residents speaking other language at home (%)
Residents speaking other language at home - Born in the United States (%)
Residents speaking other language at home - Native, born elsewhere (%)
Residents speaking other language at home - Foreign born (%)
Marital status - Never married (%)
Marital status - Now married (%)
Marital status - Separated (%)
Marital status - Widowed (%)
Marital status - Divorced (%)
Ancestries Reported - Arab (%)
Ancestries Reported - Czech (%)
Ancestries Reported - Danish (%)
Ancestries Reported - Dutch (%)
Ancestries Reported - English (%)
Ancestries Reported - French (%)
Ancestries Reported - French Canadian (%)
Ancestries Reported - German (%)
Ancestries Reported - Greek (%)
Ancestries Reported - Hungarian (%)
Ancestries Reported - Irish (%)
Ancestries Reported - Italian (%)
Ancestries Reported - Lithuanian (%)
Ancestries Reported - Norwegian (%)
Ancestries Reported - Polish (%)
Ancestries Reported - Portuguese (%)
Ancestries Reported - Russian (%)
Ancestries Reported - Scotch-Irish (%)
Ancestries Reported - Scottish (%)
Ancestries Reported - Slovak (%)
Ancestries Reported - Subsaharan African (%)
Ancestries Reported - Swedish (%)
Ancestries Reported - Swiss (%)
Ancestries Reported - Ukrainian (%)
Ancestries Reported - United States (%)
Ancestries Reported - Welsh (%)
Ancestries Reported - West Indian (%)
Ancestries Reported - Other (%)
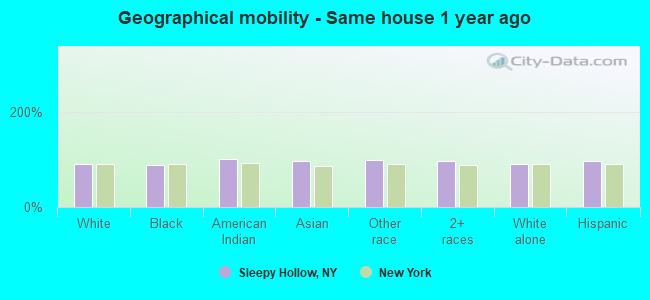
Geographical mobility - Same house 1 year ago (%)
Geographical mobility - Same house 1 year ago (%) - White
Geographical mobility - Same house 1 year ago (%) - Black or African American
Geographical mobility - Same house 1 year ago (%) - Asian
Geographical mobility - Same house 1 year ago (%) - Hispanic or Latino
Geographical mobility - Same house 1 year ago (%) - American Indian and Alaska Native
Geographical mobility - Same house 1 year ago (%) - Multirace
Geographical mobility - Same house 1 year ago (%) - Other Race
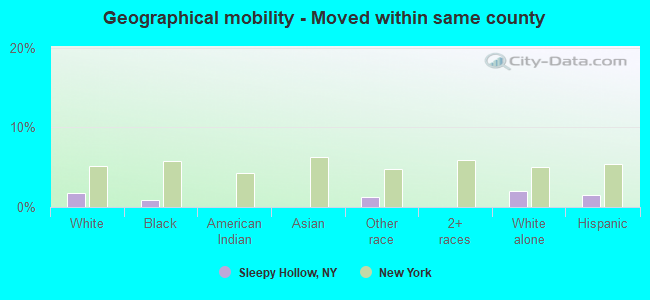
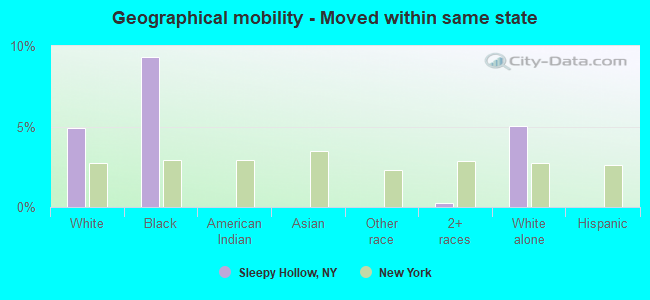
Geographical mobility - Moved within same county (%)
Geographical mobility - Moved within same county (%) - White
Geographical mobility - Moved within same county (%) - Black or African American
Geographical mobility - Moved within same county (%) - Asian
Geographical mobility - Moved within same county (%) - Hispanic or Latino
Geographical mobility - Moved within same county (%) - American Indian and Alaska Native
Geographical mobility - Moved within same county (%) - Multirace
Geographical mobility - Moved within same county (%) - Other Race
Geographical mobility - Moved from different county within same state (%)
Geographical mobility - Moved from different county within same state (%) - White
Geographical mobility - Moved from different county within same state (%) - Black or African American
Geographical mobility - Moved from different county within same state (%) - Asian
Geographical mobility - Moved from different county within same state (%) - Hispanic or Latino
Geographical mobility - Moved from different county within same state (%) - American Indian and Alaska Native
Geographical mobility - Moved from different county within same state (%) - Multirace
Geographical mobility - Moved from different county within same state (%) - Other Race
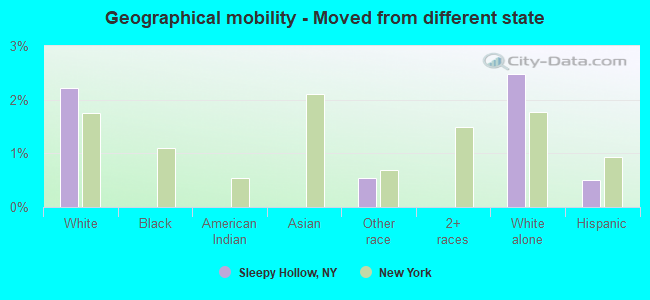
Geographical mobility - Moved from different state (%)
Geographical mobility - Moved from different state (%) - White
Geographical mobility - Moved from different state (%) - Black or African American
Geographical mobility - Moved from different state (%) - Asian
Geographical mobility - Moved from different state (%) - Hispanic or Latino
Geographical mobility - Moved from different state (%) - American Indian and Alaska Native
Geographical mobility - Moved from different state (%) - Multirace
Geographical mobility - Moved from different state (%) - Other Race
Geographical mobility - Moved from abroad (%)
Geographical mobility - Moved from abroad (%) - White
Geographical mobility - Moved from abroad (%) - Black or African American
Geographical mobility - Moved from abroad (%) - Asian
Geographical mobility - Moved from abroad (%) - Hispanic or Latino
Geographical mobility - Moved from abroad (%) - American Indian and Alaska Native
Geographical mobility - Moved from abroad (%) - Multirace
Geographical mobility - Moved from abroad (%) - Other Race
Place of birth for the foreign-born population - Ireland (%)
Place of birth for the foreign-born population - Denmark (%)
Place of birth for the foreign-born population - Norway (%)
Place of birth for the foreign-born population - Sweden (%)
Place of birth for the foreign-born population - United Kingdom (%)
Place of birth for the foreign-born population - England (%)
Place of birth for the foreign-born population - Scotland (%)
Place of birth for the foreign-born population - Other Northern Europe (%)
Place of birth for the foreign-born population - Austria (%)
Place of birth for the foreign-born population - Belgium (%)
Place of birth for the foreign-born population - France (%)
Place of birth for the foreign-born population - Germany (%)
Place of birth for the foreign-born population - Netherlands (%)
Place of birth for the foreign-born population - Switzerland (%)
Place of birth for the foreign-born population - Other Western Europe (%)
Place of birth for the foreign-born population - Greece (%)
Place of birth for the foreign-born population - Italy (%)
Place of birth for the foreign-born population - Portugal (%)
Place of birth for the foreign-born population - Spain (%)
Place of birth for the foreign-born population - Other Southern Europe (%)
Place of birth for the foreign-born population - Albania (%)
Place of birth for the foreign-born population - Belarus (%)
Place of birth for the foreign-born population - Bosnia and Herzegovina (%)
Place of birth for the foreign-born population - Bulgaria (%)
Place of birth for the foreign-born population - Croatia (%)
Place of birth for the foreign-born population - Czechoslovakia (%)
Place of birth for the foreign-born population - Hungary (%)
Place of birth for the foreign-born population - Latvia (%)
Place of birth for the foreign-born population - Lithuania (%)
Place of birth for the foreign-born population - North Macedonia (Macedonia) (%)
Place of birth for the foreign-born population - Moldova (%)
Place of birth for the foreign-born population - Poland (%)
Place of birth for the foreign-born population - Romania (%)
Place of birth for the foreign-born population - Russia (%)
Place of birth for the foreign-born population - Serbia (%)
Place of birth for the foreign-born population - Ukraine (%)
Place of birth for the foreign-born population - Other Eastern Europe (%)
Place of birth for the foreign-born population - China (%)
Place of birth for the foreign-born population - Hong Kong (%)
Place of birth for the foreign-born population - Taiwan (%)
Place of birth for the foreign-born population - Japan (%)
Place of birth for the foreign-born population - Korea (%)
Place of birth for the foreign-born population - Other Eastern Asia (%)
Place of birth for the foreign-born population - Afghanistan (%)
Place of birth for the foreign-born population - Bangladesh (%)
Place of birth for the foreign-born population - India (%)
Place of birth for the foreign-born population - Iran (%)
Place of birth for the foreign-born population - Kazakhstan (%)
Place of birth for the foreign-born population - Nepal (%)
Place of birth for the foreign-born population - Pakistan (%)
Place of birth for the foreign-born population - Sri Lanka (%)
Place of birth for the foreign-born population - Uzbekistan (%)
Place of birth for the foreign-born population - Other South Central Asia (%)
Place of birth for the foreign-born population - Burma (%)
Place of birth for the foreign-born population - Cambodia (%)
Place of birth for the foreign-born population - Indonesia (%)
Place of birth for the foreign-born population - Laos (%)
Place of birth for the foreign-born population - Malaysia (%)
Place of birth for the foreign-born population - Philippines (%)
Place of birth for the foreign-born population - Singapore (%)
Place of birth for the foreign-born population - Thailand (%)
Place of birth for the foreign-born population - Vietnam (%)
Place of birth for the foreign-born population - Other South Eastern Asia (%)
Place of birth for the foreign-born population - Armenia (%)
Place of birth for the foreign-born population - Iraq (%)
Place of birth for the foreign-born population - Israel (%)
Place of birth for the foreign-born population - Jordan (%)
Place of birth for the foreign-born population - Kuwait (%)
Place of birth for the foreign-born population - Lebanon (%)
Place of birth for the foreign-born population - Saudi Arabia (%)
Place of birth for the foreign-born population - Syria (%)
Place of birth for the foreign-born population - Turkey (%)
Place of birth for the foreign-born population - Yemen (%)
Place of birth for the foreign-born population - Other Western Asia (%)
Place of birth for the foreign-born population - Eritrea (%)
Place of birth for the foreign-born population - Ethiopia (%)
Place of birth for the foreign-born population - Kenya (%)
Place of birth for the foreign-born population - Somalia (%)
Place of birth for the foreign-born population - Uganda (%)
Place of birth for the foreign-born population - Zimbabwe (%)
Place of birth for the foreign-born population - Other Eastern Africa (%)
Place of birth for the foreign-born population - Cameroon (%)
Place of birth for the foreign-born population - Congo (%)
Place of birth for the foreign-born population - Democratic Republic of Congo (Zaire) (%)
Place of birth for the foreign-born population - Other Middle Africa (%)
Place of birth for the foreign-born population - Egypt (%)
Place of birth for the foreign-born population - Morocco (%)
Place of birth for the foreign-born population - Sudan (%)
Place of birth for the foreign-born population - Other Northern Africa (%)
Place of birth for the foreign-born population - South Africa (%)
Place of birth for the foreign-born population - Other Southern Africa (%)
Place of birth for the foreign-born population - Cabo Verde (%)
Place of birth for the foreign-born population - Ghana (%)
Place of birth for the foreign-born population - Liberia (%)
Place of birth for the foreign-born population - Nigeria (%)
Place of birth for the foreign-born population - Senegal (%)
Place of birth for the foreign-born population - Sierra Leone (%)
Place of birth for the foreign-born population - Other Western Africa (%)
Place of birth for the foreign-born population - Australia (%)
Place of birth for the foreign-born population - New Zealand (%)
Place of birth for the foreign-born population - Fiji (%)
Place of birth for the foreign-born population - Micronesia (%)
Place of birth for the foreign-born population - Bahamas (%)
Place of birth for the foreign-born population - Barbados (%)
Place of birth for the foreign-born population - Cuba (%)
Place of birth for the foreign-born population - Dominica (%)
Place of birth for the foreign-born population - Dominican Republic (%)
Place of birth for the foreign-born population - Grenada (%)
Place of birth for the foreign-born population - Haiti (%)
Place of birth for the foreign-born population - Jamaica (%)
Place of birth for the foreign-born population - St. Vincent and the Grenadines (%)
Place of birth for the foreign-born population - Trinidad and Tobago (%)
Place of birth for the foreign-born population - West Indies (%)
Place of birth for the foreign-born population - Other Caribbean (%)
Place of birth for the foreign-born population - Belize (%)
Place of birth for the foreign-born population - Costa Rica (%)
Place of birth for the foreign-born population - El Salvador (%)
Place of birth for the foreign-born population - Guatemala (%)
Place of birth for the foreign-born population - Honduras (%)
Place of birth for the foreign-born population - Mexico (%)
Place of birth for the foreign-born population - Nicaragua (%)
Place of birth for the foreign-born population - Panama (%)
Place of birth for the foreign-born population - Other Central America (%)
Place of birth for the foreign-born population - Argentina (%)
Place of birth for the foreign-born population - Bolivia (%)
Place of birth for the foreign-born population - Brazil (%)
Place of birth for the foreign-born population - Chile (%)
Place of birth for the foreign-born population - Colombia (%)
Place of birth for the foreign-born population - Ecuador (%)
Place of birth for the foreign-born population - Guyana (%)
Place of birth for the foreign-born population - Peru (%)
Place of birth for the foreign-born population - Uruguay (%)
Place of birth for the foreign-born population - Venezuela (%)
Place of birth for the foreign-born population - Other South America (%)
Place of birth for the foreign-born population - Canada (%)
Place of birth for the foreign-born population - Other Northern America (%)
Place of birth for the foreign-born population - Other (%)
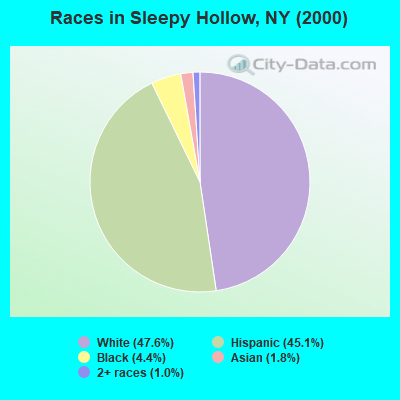
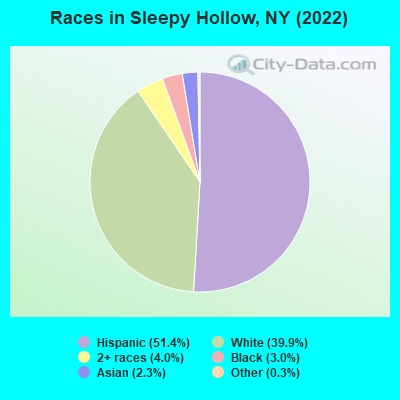
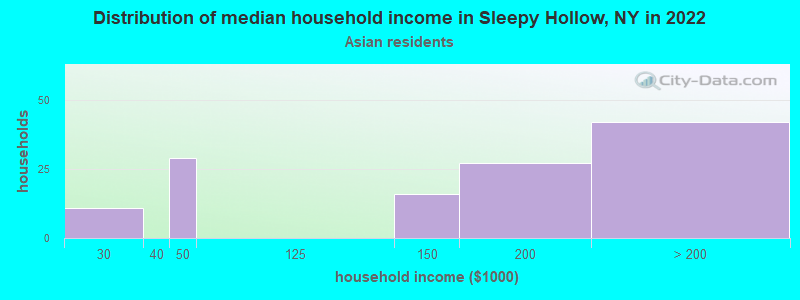
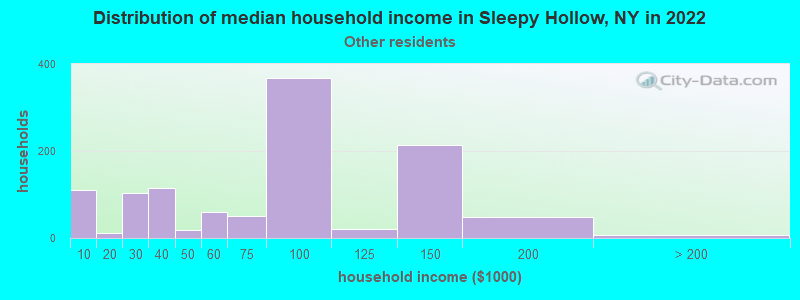
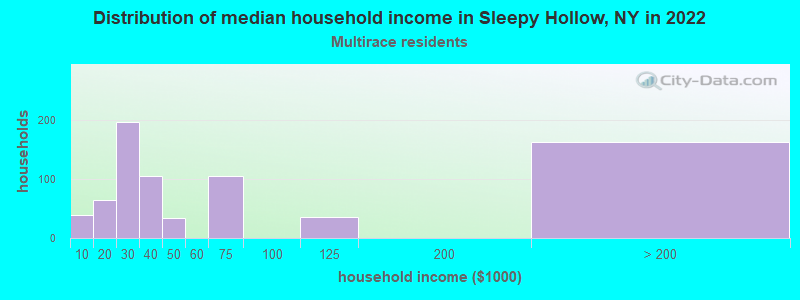
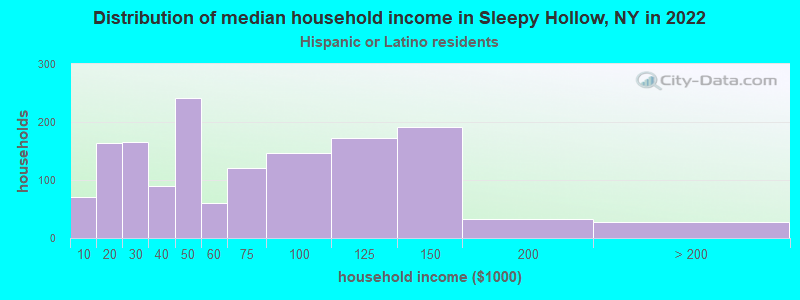
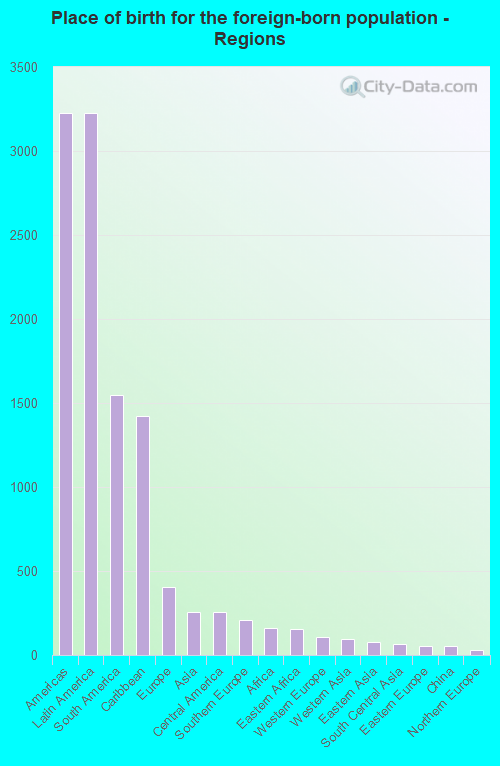
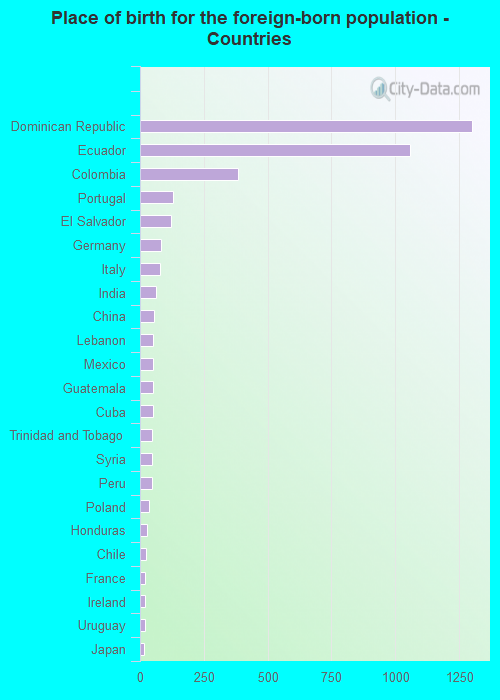
According to 2022 data, the most numerous races in Sleepy Hollow, NY are White alone (4,121 residents), Hispanic (5,305 residents), and Black alone (309 residents). 39.8% of Sleepy Hollow residents speak English at home. 39.2% of Sleepy Hollow, NY residents are foreign-born (31.4% born in Latin America), which is 43.9% greater than the foreign-born rate of 22.0% across the entire state of New York.
Race distribution in Sleepy Hollow
2000 2022
11,760,981 62.0% White alone 2,867,583 15.1% Hispanic 2,812,623 14.8% Black alone 1,035,926 5.5% Asian alone 366,116 1.9% Two or more races 75,499 0.4% Other race alone 52,499 0.3% American Indian alone 5,230 0.03% Native Hawaiian and Other
10,408,933 52.9% White alone 3,867,299 19.7% Hispanic 2,633,840 13.4% Black alone 1,776,286 9.0% Asian alone 732,670 3.7% Two or more races 216,110 1.1% Other race alone 35,082 0.2% American Indian alone 6,931 0.04% Native Hawaiian and Other
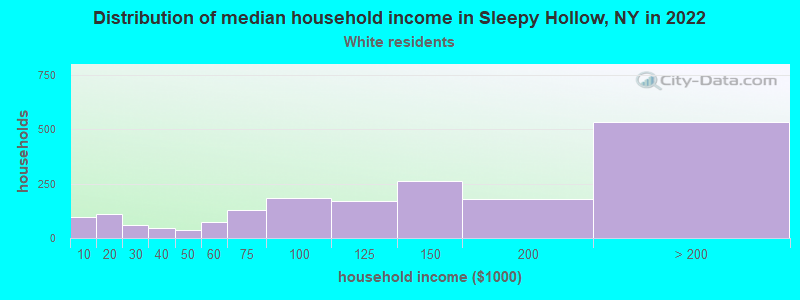
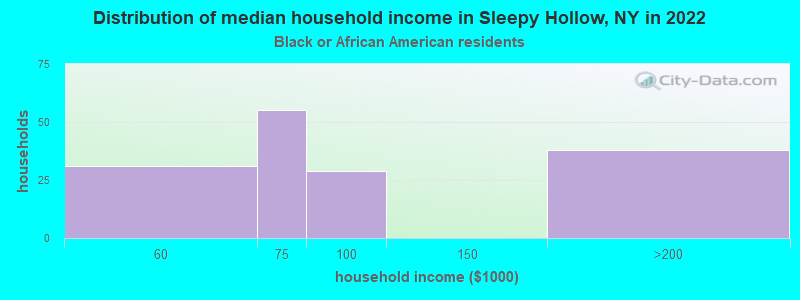
Income and house value in Sleepy Hollow Median household income in 2022 $124,197 White non-Hispanic householders$65,105 Black householders$165,164 Asian householders$81,906 Some other race householders$63,192 Hispanic or Latino race householdersMedian 2022 house value $889,930 White Non-Hispanic householders$505,259 Black or African American householders over $1,000,000 Asian householders$410,944 Some other race householders$489,315 Hispanic or Latino householders
Median age by race in Sleepy Hollow
51.1 Median age for White residents44.7 54.5 54.4 Median age for Black or African American residents51.9 54.1 -641,441,440.8 Median age for American Indian / Alaska Native residents-664,804,468.6 -554,999,999.4 50.0 Median age for Asian residents45.8 57.2 -487,992,314.6 Median age for Native Hawaiian / Pacific Islander residents-477,502,295.2 -666,666,666.0 26.3 Median age for Other race residents25.7 30.8 43.4 Median age for Two or more races residents27.8 43.6 51.3 Median age for White alone residents44.7 54.3 30.5 Median age for Hispanic or Latino residents26.1 32.0
Owner/renter occupied households by race in Sleepy Hollow
House owners and renters - White residents 893 49.6% Owner occupied908 50.4% Renter occupiedHouse owners and renters - Black or African American residents 107 63.3% Owner occupied62 36.7% Renter occupiedHouse owners and renters - American Indian / Alaska Native residents 89 100.0% Renter occupiedHouse owners and renters - Asian residents 70 56.4% Owner occupied54 43.6% Renter occupiedHouse owners and renters - Other race residents 120 10.7% Owner occupied1,003 89.3% Renter occupiedHouse owners and renters - Two or more races residents 123 14.9% Owner occupied703 85.1% Renter occupiedHouse owners and renters - White alone residents 924 51.2% Owner occupied881 48.8% Renter occupiedHouse owners and renters - Hispanic or Latino residents 136 8.0% Owner occupied1,570 92.0% Renter occupied
Language usage in Sleepy Hollow
English speakers - Total 39.8% of residents of Sleepy Hollow speak English at home.
50.5% of residents speak Spanish at home 2,208 44.5% Speak English very well2,756 55.5% Speak English less than very well10.3% of residents speak other language at home 654 64.9% Speak English very well353 35.1% Speak English less than very well
English speakers - Born in the United States 99.3% of residents of Sleepy Hollow speak English at home.
1.7% of residents speak Spanish at home 20 100.0% Speak English very well1.0% of residents speak other language at home 11 100.0% Speak English very well
English speakers - Native, born elsewhere 1.3% of residents of Sleepy Hollow speak English at home.
117.2% of residents speak Spanish at home 125 47.0% Speak English very well141 53.0% Speak English less than very well
English speakers - Foreign-born 4.0% of residents of Sleepy Hollow speak English at home.
74.7% of residents speak Spanish at home 596 19.5% Speak English very well2,464 80.5% Speak English less than very well18.1% of residents speak other language at home 396 53.6% Speak English very well343 46.4% Speak English less than very well
White (Caucasian) - Speak only English Native:
90.2% (3,034)Foreign-born:
5.3% (34)
White (Caucasian) - Speak another language Native:
9.5% (319)Foreign-born:
83.8% (533)
Black or African American - Speak only English Native:
84.4% (276)Foreign-born:
74.2% (82)
Black or African American - Speak another language Native:
13.8% (45)Foreign-born:
26.7% (29)
Asian - Speak only English Native:
77.7% (68)Foreign-born:
4.1% (6)
Asian - Speak another language Native:
22.0% (19)Foreign-born:
94.9% (146)
Other race - Speak only English Native:
11.1% (141)Foreign-born:
2.5% (56)
Other race - Speak another language Native:
91.9% (1,169)Foreign-born:
95.2% (2,122)
Two or more races - Speak another language Native:
78.9% (744)Foreign-born:
100.0% (1,123)
White alone - Speak only English Native:
92.5% (3,084)Foreign-born:
5.8% (34)
White alone - Speak another language Native:
7.4% (247)Foreign-born:
88.3% (523)
Hispanic or Latino - Speak only English Native:
9.9% (184)Foreign-born:
2.3% (71)
Hispanic or Latino - Speak another language Native:
93.8% (1,750)Foreign-born:
96.5% (2,996)
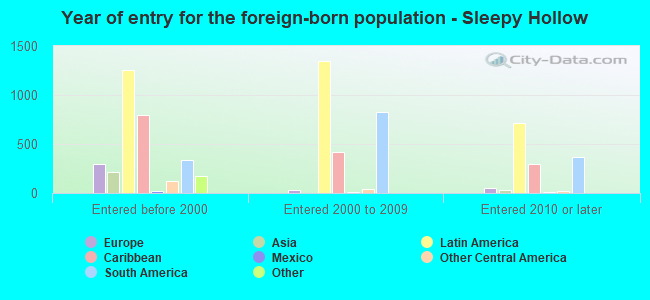
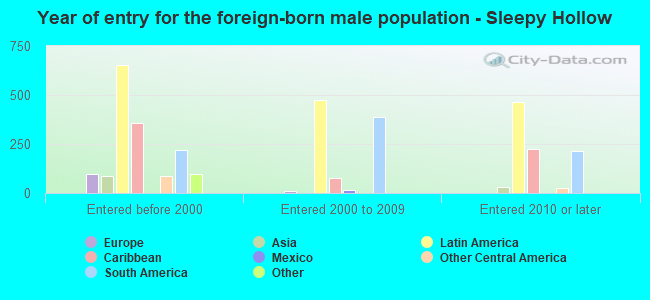
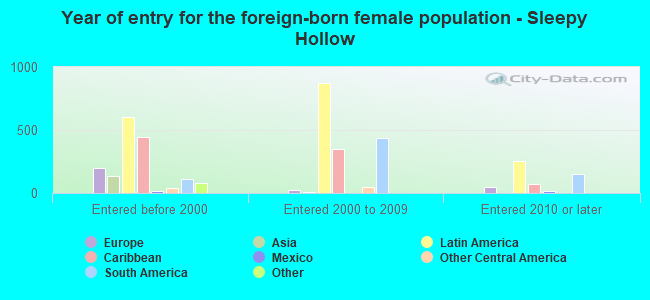
Foreign-born residents in Sleepy Hollow 4,044 residents are foreign born (31.4% Latin America ).
This city:
39.2%New York:
22.6%
Marital status for residents in Sleepy Hollow Marital status - White (Caucasian) population 15 years and over
Males 33.6% Never married49.4% Now married1.3% Separated1.3% Widowed14.4% DivorcedFemales 30.1% Never married39.8% Now married1.8% Separated16.5% Widowed11.8% DivorcedWomen who gave birth in the past 12 months Now married:
100.0% (49)Unmarried:
0.0% (0)
Women who did not give birth in the past 12 months Now married:
38.2% (245)Unmarried:
61.8% (396)
Marital status - Black or African American population 15 years and over
Males 61.1% Never married38.9% Now married0.0% Separated0.0% Widowed0.0% DivorcedFemales 55.3% Never married28.9% Now married0.0% Separated5.5% Widowed10.2% DivorcedWomen who did not give birth in the past 12 months Now married:
0.0% (0)Unmarried:
100.0% (80)
Marital status - American Indian / Alaska Native population 15 years and over
Males 100.0% Never married0.0% Now married0.0% Separated0.0% Widowed0.0% DivorcedFemales 100.0% Never married0.0% Now married0.0% Separated0.0% Widowed0.0% DivorcedWomen who did not give birth in the past 12 months Now married:
0.0% (0)Unmarried:
100.0% (73)
Marital status - Asian population 15 years and over
Males 0.0% Never married85.2% Now married0.0% Separated0.0% Widowed14.8% DivorcedFemales 20.1% Never married49.3% Now married23.9% Separated6.7% Widowed0.0% DivorcedWomen who did not give birth in the past 12 months Now married:
53.4% (30)Unmarried:
46.6% (26)
Marital status - Other race population 15 years and over
Males 50.3% Never married46.0% Now married0.0% Separated3.6% Widowed0.0% DivorcedFemales 39.5% Never married33.2% Now married6.3% Separated2.2% Widowed18.8% DivorcedWomen who gave birth in the past 12 months Now married:
0.0% (0)Unmarried:
100.0% (60)
Women who did not give birth in the past 12 months Now married:
30.8% (283)Unmarried:
69.2% (638)
Marital status - Two or more races population 15 years and over
Males 53.5% Never married33.2% Now married4.8% Separated0.0% Widowed8.5% DivorcedFemales 42.4% Never married27.1% Now married4.2% Separated3.0% Widowed23.2% DivorcedWomen who gave birth in the past 12 months Now married:
0.0% (0)Unmarried:
100.0% (57)
Women who did not give birth in the past 12 months Now married:
26.3% (135)Unmarried:
73.7% (380)
Marital status - White alone, not Hispanic / Latino population 15 years and over
Males 34.1% Never married51.7% Now married1.4% Separated1.4% Widowed11.4% DivorcedFemales 31.2% Never married41.3% Now married0.0% Separated15.0% Widowed12.5% DivorcedWomen who gave birth in the past 12 months Now married:
100.0% (52)Unmarried:
0.0% (0)
Women who did not give birth in the past 12 months Now married:
35.1% (220)Unmarried:
64.9% (407)
Marital status - Hispanic or Latino population 15 years and over
Males 54.5% Never married35.9% Now married1.4% Separated2.2% Widowed6.0% DivorcedFemales 38.8% Never married26.9% Now married7.5% Separated5.7% Widowed21.1% DivorcedWomen who gave birth in the past 12 months Now married:
0.0% (0)Unmarried:
100.0% (98)
Women who did not give birth in the past 12 months Now married:
31.6% (390)Unmarried:
68.4% (844)
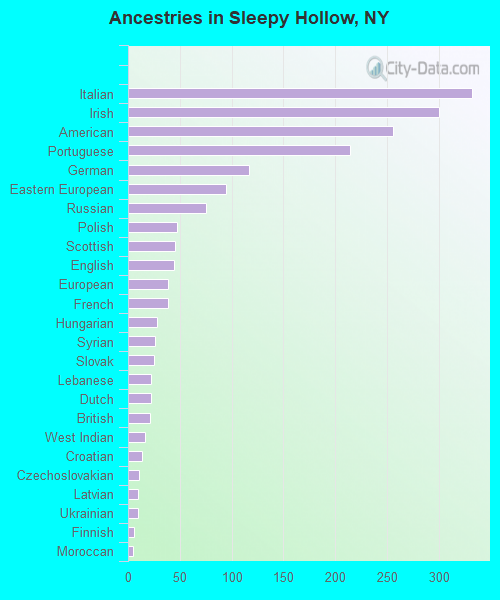
Ancestries in Sleepy Hollow
332 5.6% Italian300 5.0% Irish256 4.3% American214 3.6% Portuguese117 2.0% German95 1.6% Eastern European75 1.3% Russian47 0.8% Polish45 0.8% Scottish44 0.7% English39 0.7% European39 0.7% French28 0.5% Hungarian26 0.4% Syrian25 0.4% Slovak22 0.4% Lebanese22 0.4% Dutch21 0.4% British16 0.3% West Indian14 0.2% Croatian11 0.2% Czechoslovakian10 0.2% Latvian10 0.2% Ukrainian6 0.1% Finnish5 0.08% Moroccan3 0.05% Iranian3 0.05% Lithuanian2 0.03% Celtic2 0.03% Danish
Children Nativity (place of birth) in Sleepy Hollow
Children under 6 years - Living with two parents Both parents native 110 100.0% NativeBoth parents foreign-born 55 100.0% NativeOne native, one foreign-born parent 53 100.0% NativeChildren under 6 years - Living with one parent Native parent 107 100.0% NativeForeign-born parent 276 100.0% NativeChildren 6 to 17 years - Living with two parents Both parents native 248 100.0% NativeBoth parents foreign-born 690 93.6% Native47 6.4% Foreign-bornOne native, one foreign-born parent 130 100.0% NativeChildren 6 to 17 years - Living with one parent Foreign-born parent 451 59.4% Native309 40.6% Foreign-born
Grandparents responsible for own grandchildren in Sleepy Hollow
Grandparents (30 to 59 years) Other race 75 100.0% Not responsible for grandchildrenTwo or more races 69 100.0% Not responsible for grandchildrenHispanic or Latino 85 100.0% Not responsible for grandchildrenGrandparents (60 years and over) Other race 46 100.0% Not responsible for grandchildrenTwo or more races 70 62.7% Responsible for grandchildren42 37.3% Not responsible for grandchildrenHispanic or Latino 46 26.7% Responsible for grandchildren125 73.3% Not responsible for grandchildren