Races in Silver City, New Mexico (NM) Detailed Stats
Data:
Races - White alone (%)
Races - White alone (% change since 2000)
Races - Black alone (%)
Races - Black alone (% change since 2000)
Races - American Indian alone (%)
Races - American Indian alone (% change since 2000)
Races - Asian alone (%)
Races - Asian alone (% change since 2000)
Races - Hispanic (%)
Races - Hispanic (% change since 2000)
Races - Native Hawaiian and Other Pacific Islander alone (%)
Races - Native Hawaiian and Other Pacific Islander alone (% change since 2000)
Races - Two or more races(%)
Races - Two or more races(% change since 2000)
Races - Other race alone (%)
Races - Other race alone (% change since 2000)
Racial diversity
Place of birth - Born in state of residence (%)
Place of birth - Born in state of residence (%) - White
Place of birth - Born in state of residence (%) - Black or African American
Place of birth - Born in state of residence (%) - Asian
Place of birth - Born in state of residence (%) - Hispanic or Latino
Place of birth - Born in state of residence (%) - American Indian and Alaska Native
Place of birth - Born in state of residence (%) - Multirace
Place of birth - Born in state of residence (%) - Other Race
Place of birth - Born in other state (%)
Place of birth - Born in other state (%) - White
Place of birth - Born in other state (%) - Black or African American
Place of birth - Born in other state (%) - Asian
Place of birth - Born in other state (%) - Hispanic or Latino
Place of birth - Born in other state (%) - American Indian and Alaska Native
Place of birth - Born in other state (%) - Multirace
Place of birth - Born in other state (%) - Other Race
Place of birth - Native, outside of US (%)
Place of birth - Native, outside of US (%) - White
Place of birth - Native, outside of US (%) - Black or African American
Place of birth - Native, outside of US (%) - Asian
Place of birth - Native, outside of US (%) - Hispanic or Latino
Place of birth - Native, outside of US (%) - American Indian and Alaska Native
Place of birth - Native, outside of US (%) - Multirace
Place of birth - Native, outside of US (%) - Other Race
Place of birth - Foreign born (%)
Place of birth - Foreign born (%) - White
Place of birth - Foreign born (%) - Black or African American
Place of birth - Foreign born (%) - Asian
Place of birth - Foreign born (%) - Hispanic or Latino
Place of birth - Foreign born (%) - American Indian and Alaska Native
Place of birth - Foreign born (%) - Multirace
Place of birth - Foreign born (%) - Other Race
Residents speaking English at home (%)
Residents speaking English at home - Born in the United States (%)
Residents speaking English at home - Native, born elsewhere (%)
Residents speaking English at home - Foreign born (%)
Residents speaking Spanish at home (%)
Residents speaking Spanish at home - Born in the United States (%)
Residents speaking Spanish at home - Native, born elsewhere (%)
Residents speaking Spanish at home - Foreign born (%)
Residents speaking other language at home (%)
Residents speaking other language at home - Born in the United States (%)
Residents speaking other language at home - Native, born elsewhere (%)
Residents speaking other language at home - Foreign born (%)
Marital status - Never married (%)
Marital status - Now married (%)
Marital status - Separated (%)
Marital status - Widowed (%)
Marital status - Divorced (%)
Ancestries Reported - Arab (%)
Ancestries Reported - Czech (%)
Ancestries Reported - Danish (%)
Ancestries Reported - Dutch (%)
Ancestries Reported - English (%)
Ancestries Reported - French (%)
Ancestries Reported - French Canadian (%)
Ancestries Reported - German (%)
Ancestries Reported - Greek (%)
Ancestries Reported - Hungarian (%)
Ancestries Reported - Irish (%)
Ancestries Reported - Italian (%)
Ancestries Reported - Lithuanian (%)
Ancestries Reported - Norwegian (%)
Ancestries Reported - Polish (%)
Ancestries Reported - Portuguese (%)
Ancestries Reported - Russian (%)
Ancestries Reported - Scotch-Irish (%)
Ancestries Reported - Scottish (%)
Ancestries Reported - Slovak (%)
Ancestries Reported - Subsaharan African (%)
Ancestries Reported - Swedish (%)
Ancestries Reported - Swiss (%)
Ancestries Reported - Ukrainian (%)
Ancestries Reported - United States (%)
Ancestries Reported - Welsh (%)
Ancestries Reported - West Indian (%)
Ancestries Reported - Other (%)
Geographical mobility - Same house 1 year ago (%)
Geographical mobility - Same house 1 year ago (%) - White
Geographical mobility - Same house 1 year ago (%) - Black or African American
Geographical mobility - Same house 1 year ago (%) - Asian
Geographical mobility - Same house 1 year ago (%) - Hispanic or Latino
Geographical mobility - Same house 1 year ago (%) - American Indian and Alaska Native
Geographical mobility - Same house 1 year ago (%) - Multirace
Geographical mobility - Same house 1 year ago (%) - Other Race
Geographical mobility - Moved within same county (%)
Geographical mobility - Moved within same county (%) - White
Geographical mobility - Moved within same county (%) - Black or African American
Geographical mobility - Moved within same county (%) - Asian
Geographical mobility - Moved within same county (%) - Hispanic or Latino
Geographical mobility - Moved within same county (%) - American Indian and Alaska Native
Geographical mobility - Moved within same county (%) - Multirace
Geographical mobility - Moved within same county (%) - Other Race
Geographical mobility - Moved from different county within same state (%)
Geographical mobility - Moved from different county within same state (%) - White
Geographical mobility - Moved from different county within same state (%) - Black or African American
Geographical mobility - Moved from different county within same state (%) - Asian
Geographical mobility - Moved from different county within same state (%) - Hispanic or Latino
Geographical mobility - Moved from different county within same state (%) - American Indian and Alaska Native
Geographical mobility - Moved from different county within same state (%) - Multirace
Geographical mobility - Moved from different county within same state (%) - Other Race
Geographical mobility - Moved from different state (%)
Geographical mobility - Moved from different state (%) - White
Geographical mobility - Moved from different state (%) - Black or African American
Geographical mobility - Moved from different state (%) - Asian
Geographical mobility - Moved from different state (%) - Hispanic or Latino
Geographical mobility - Moved from different state (%) - American Indian and Alaska Native
Geographical mobility - Moved from different state (%) - Multirace
Geographical mobility - Moved from different state (%) - Other Race
Geographical mobility - Moved from abroad (%)
Geographical mobility - Moved from abroad (%) - White
Geographical mobility - Moved from abroad (%) - Black or African American
Geographical mobility - Moved from abroad (%) - Asian
Geographical mobility - Moved from abroad (%) - Hispanic or Latino
Geographical mobility - Moved from abroad (%) - American Indian and Alaska Native
Geographical mobility - Moved from abroad (%) - Multirace
Geographical mobility - Moved from abroad (%) - Other Race
Place of birth for the foreign-born population - Ireland (%)
Place of birth for the foreign-born population - Denmark (%)
Place of birth for the foreign-born population - Norway (%)
Place of birth for the foreign-born population - Sweden (%)
Place of birth for the foreign-born population - United Kingdom (%)
Place of birth for the foreign-born population - England (%)
Place of birth for the foreign-born population - Scotland (%)
Place of birth for the foreign-born population - Other Northern Europe (%)
Place of birth for the foreign-born population - Austria (%)
Place of birth for the foreign-born population - Belgium (%)
Place of birth for the foreign-born population - France (%)
Place of birth for the foreign-born population - Germany (%)
Place of birth for the foreign-born population - Netherlands (%)
Place of birth for the foreign-born population - Switzerland (%)
Place of birth for the foreign-born population - Other Western Europe (%)
Place of birth for the foreign-born population - Greece (%)
Place of birth for the foreign-born population - Italy (%)
Place of birth for the foreign-born population - Portugal (%)
Place of birth for the foreign-born population - Spain (%)
Place of birth for the foreign-born population - Other Southern Europe (%)
Place of birth for the foreign-born population - Albania (%)
Place of birth for the foreign-born population - Belarus (%)
Place of birth for the foreign-born population - Bosnia and Herzegovina (%)
Place of birth for the foreign-born population - Bulgaria (%)
Place of birth for the foreign-born population - Croatia (%)
Place of birth for the foreign-born population - Czechoslovakia (%)
Place of birth for the foreign-born population - Hungary (%)
Place of birth for the foreign-born population - Latvia (%)
Place of birth for the foreign-born population - Lithuania (%)
Place of birth for the foreign-born population - North Macedonia (Macedonia) (%)
Place of birth for the foreign-born population - Moldova (%)
Place of birth for the foreign-born population - Poland (%)
Place of birth for the foreign-born population - Romania (%)
Place of birth for the foreign-born population - Russia (%)
Place of birth for the foreign-born population - Serbia (%)
Place of birth for the foreign-born population - Ukraine (%)
Place of birth for the foreign-born population - Other Eastern Europe (%)
Place of birth for the foreign-born population - China (%)
Place of birth for the foreign-born population - Hong Kong (%)
Place of birth for the foreign-born population - Taiwan (%)
Place of birth for the foreign-born population - Japan (%)
Place of birth for the foreign-born population - Korea (%)
Place of birth for the foreign-born population - Other Eastern Asia (%)
Place of birth for the foreign-born population - Afghanistan (%)
Place of birth for the foreign-born population - Bangladesh (%)
Place of birth for the foreign-born population - India (%)
Place of birth for the foreign-born population - Iran (%)
Place of birth for the foreign-born population - Kazakhstan (%)
Place of birth for the foreign-born population - Nepal (%)
Place of birth for the foreign-born population - Pakistan (%)
Place of birth for the foreign-born population - Sri Lanka (%)
Place of birth for the foreign-born population - Uzbekistan (%)
Place of birth for the foreign-born population - Other South Central Asia (%)
Place of birth for the foreign-born population - Burma (%)
Place of birth for the foreign-born population - Cambodia (%)
Place of birth for the foreign-born population - Indonesia (%)
Place of birth for the foreign-born population - Laos (%)
Place of birth for the foreign-born population - Malaysia (%)
Place of birth for the foreign-born population - Philippines (%)
Place of birth for the foreign-born population - Singapore (%)
Place of birth for the foreign-born population - Thailand (%)
Place of birth for the foreign-born population - Vietnam (%)
Place of birth for the foreign-born population - Other South Eastern Asia (%)
Place of birth for the foreign-born population - Armenia (%)
Place of birth for the foreign-born population - Iraq (%)
Place of birth for the foreign-born population - Israel (%)
Place of birth for the foreign-born population - Jordan (%)
Place of birth for the foreign-born population - Kuwait (%)
Place of birth for the foreign-born population - Lebanon (%)
Place of birth for the foreign-born population - Saudi Arabia (%)
Place of birth for the foreign-born population - Syria (%)
Place of birth for the foreign-born population - Turkey (%)
Place of birth for the foreign-born population - Yemen (%)
Place of birth for the foreign-born population - Other Western Asia (%)
Place of birth for the foreign-born population - Eritrea (%)
Place of birth for the foreign-born population - Ethiopia (%)
Place of birth for the foreign-born population - Kenya (%)
Place of birth for the foreign-born population - Somalia (%)
Place of birth for the foreign-born population - Uganda (%)
Place of birth for the foreign-born population - Zimbabwe (%)
Place of birth for the foreign-born population - Other Eastern Africa (%)
Place of birth for the foreign-born population - Cameroon (%)
Place of birth for the foreign-born population - Congo (%)
Place of birth for the foreign-born population - Democratic Republic of Congo (Zaire) (%)
Place of birth for the foreign-born population - Other Middle Africa (%)
Place of birth for the foreign-born population - Egypt (%)
Place of birth for the foreign-born population - Morocco (%)
Place of birth for the foreign-born population - Sudan (%)
Place of birth for the foreign-born population - Other Northern Africa (%)
Place of birth for the foreign-born population - South Africa (%)
Place of birth for the foreign-born population - Other Southern Africa (%)
Place of birth for the foreign-born population - Cabo Verde (%)
Place of birth for the foreign-born population - Ghana (%)
Place of birth for the foreign-born population - Liberia (%)
Place of birth for the foreign-born population - Nigeria (%)
Place of birth for the foreign-born population - Senegal (%)
Place of birth for the foreign-born population - Sierra Leone (%)
Place of birth for the foreign-born population - Other Western Africa (%)
Place of birth for the foreign-born population - Australia (%)
Place of birth for the foreign-born population - New Zealand (%)
Place of birth for the foreign-born population - Fiji (%)
Place of birth for the foreign-born population - Micronesia (%)
Place of birth for the foreign-born population - Bahamas (%)
Place of birth for the foreign-born population - Barbados (%)
Place of birth for the foreign-born population - Cuba (%)
Place of birth for the foreign-born population - Dominica (%)
Place of birth for the foreign-born population - Dominican Republic (%)
Place of birth for the foreign-born population - Grenada (%)
Place of birth for the foreign-born population - Haiti (%)
Place of birth for the foreign-born population - Jamaica (%)
Place of birth for the foreign-born population - St. Vincent and the Grenadines (%)
Place of birth for the foreign-born population - Trinidad and Tobago (%)
Place of birth for the foreign-born population - West Indies (%)
Place of birth for the foreign-born population - Other Caribbean (%)
Place of birth for the foreign-born population - Belize (%)
Place of birth for the foreign-born population - Costa Rica (%)
Place of birth for the foreign-born population - El Salvador (%)
Place of birth for the foreign-born population - Guatemala (%)
Place of birth for the foreign-born population - Honduras (%)
Place of birth for the foreign-born population - Mexico (%)
Place of birth for the foreign-born population - Nicaragua (%)
Place of birth for the foreign-born population - Panama (%)
Place of birth for the foreign-born population - Other Central America (%)
Place of birth for the foreign-born population - Argentina (%)
Place of birth for the foreign-born population - Bolivia (%)
Place of birth for the foreign-born population - Brazil (%)
Place of birth for the foreign-born population - Chile (%)
Place of birth for the foreign-born population - Colombia (%)
Place of birth for the foreign-born population - Ecuador (%)
Place of birth for the foreign-born population - Guyana (%)
Place of birth for the foreign-born population - Peru (%)
Place of birth for the foreign-born population - Uruguay (%)
Place of birth for the foreign-born population - Venezuela (%)
Place of birth for the foreign-born population - Other South America (%)
Place of birth for the foreign-born population - Canada (%)
Place of birth for the foreign-born population - Other Northern America (%)
Place of birth for the foreign-born population - Other (%)
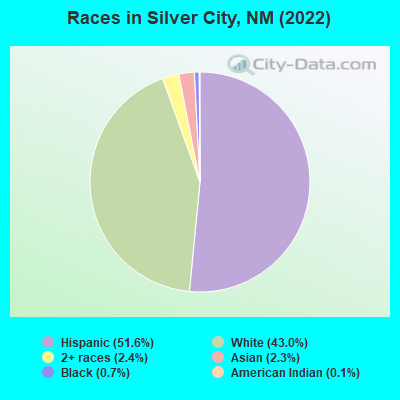
According to 2022 data, the most numerous races in Silver City, NM are Hispanic (4,978 residents), White alone (4,152 residents), and American Indian alone (12 residents). 79.5% of Silver City residents speak English at home. 4.2% of Silver City, NM residents are foreign-born (2.1% born in Latin America, 1.2% born in Asia, 0.8% born in Europe), which is 115.6% less than the foreign-born rate of 9.0% across the entire state of New Mexico.
Race distribution in Silver City
2000 2022
813,495 44.7% White alone 765,386 42.1% Hispanic 161,460 8.9% American Indian alone 30,654 1.7% Black alone 25,793 1.4% Two or more races 18,257 1.0% Asian alone 3,009 0.2% Other race alone 992 0.05% Native Hawaiian and Other
1,059,867 50.2% Hispanic 735,478 34.8% White alone 171,808 8.1% American Indian alone 65,084 3.1% Two or more races 36,870 1.7% Black alone 35,870 1.7% Asian alone 7,582 0.4% Other race alone 785 0.04% Native Hawaiian and Other
Income and house value in Silver City Median household income in 2022 $39,128 White non-Hispanic householders$24,394 Black householders$52,597 Some other race householders$38,766 Hispanic or Latino race householdersMedian 2022 house value $205,930 White Non-Hispanic householders$193,123 Black or African American householders$172,794 American Indian or Alaska Native householders $228,698 Asian householders$152,465 Native Hawaiian and other Pacific Islander householders$161,613 Some other race householders$173,404 Two or more races householders$157,751 Hispanic or Latino householders
Median age by race in Silver City
42.3 Median age for White residents39.3 43.1 21.6 Median age for Black or African American residents21.3 -670,719,350.9 -680,765,356.8 Median age for American Indian / Alaska Native residents-685,534,590.5 -676,413,254.7 32.5 Median age for Asian residents38.7 27.5 -658,511,722.1 Median age for Native Hawaiian / Pacific Islander residents-685,897,435.2 -659,380,691.5 32.2 Median age for Other race residents30.0 33.6 37.7 Median age for Two or more races residents32.0 39.3 46.4 Median age for White alone residents43.5 46.9 30.7 Median age for Hispanic or Latino residents30.6 32.0
Owner/renter occupied households by race in Silver City
House owners and renters - White residents 1,382 59.4% Owner occupied943 40.6% Renter occupiedHouse owners and renters - Black or African American residents 12 16.7% Owner occupied58 83.3% Renter occupiedHouse owners and renters - Asian residents 61 100.0% Renter occupiedHouse owners and renters - Other race residents 221 79.7% Owner occupied56 20.3% Renter occupiedHouse owners and renters - Two or more races residents 383 37.7% Owner occupied632 62.3% Renter occupiedHouse owners and renters - White alone residents 1,072 54.6% Owner occupied891 45.4% Renter occupiedHouse owners and renters - Hispanic or Latino residents 981 59.9% Owner occupied657 40.1% Renter occupied
Language usage in Silver City
English speakers - Total 79.5% of residents of Silver City speak English at home.
18.8% of residents speak Spanish at home 1,351 80.8% Speak English very well322 19.2% Speak English less than very well2.4% of residents speak other language at home 195 92.4% Speak English very well16 7.6% Speak English less than very well
English speakers - Born in the United States 89.3% of residents of Silver City speak English at home.
9.4% of residents speak Spanish at home 351 91.6% Speak English very well32 8.4% Speak English less than very well0.6% of residents speak other language at home 23 100.0% Speak English very well
All residents speak only English at home
English speakers - Foreign-born 11.8% of residents of Silver City speak English at home.
44.5% of residents speak Spanish at home 84 47.2% Speak English very well94 52.8% Speak English less than very well44.2% of residents speak other language at home 160 90.4% Speak English very well17 9.6% Speak English less than very well
White (Caucasian) - Speak only English Native:
94.4% (4,741)Foreign-born:
52.9% (23)
White (Caucasian) - Speak another language Native:
7.6% (382)Foreign-born:
100.0% (44)
Asian - Speak only English Native:
100.0% (56)Foreign-born:
12.7% (16)
Other race - Speak another language Native:
69.6% (556)Foreign-born:
98.8% (166)
Two or more races - Speak another language Native:
28.0% (671)Foreign-born:
98.0% (91)
White alone - Speak only English Native:
98.5% (3,817)Foreign-born:
33.4% (28)
White alone - Speak another language Native:
1.8% (69)Foreign-born:
64.6% (54)
Hispanic or Latino - Speak another language Native:
35.7% (1,529)Foreign-born:
96.8% (183)
Foreign-born residents in Silver City 403 residents are foreign born (2.1% Latin America , 1.2% Asia , 0.8% Europe ).
This city:
4.2%New Mexico:
9.2%
Marital status for residents in Silver City Marital status - White (Caucasian) population 15 years and over
Males 52.8% Never married30.4% Now married1.3% Separated3.8% Widowed11.7% DivorcedFemales 40.9% Never married25.3% Now married3.3% Separated10.8% Widowed19.7% DivorcedWomen who gave birth in the past 12 months Now married:
33.8% (18)Unmarried:
66.2% (35)
Women who did not give birth in the past 12 months Now married:
21.4% (197)Unmarried:
78.6% (721)
Marital status - Black or African American population 15 years and over
Males 56.5% Never married0.0% Now married0.0% Separated0.0% Widowed43.5% DivorcedFemales 50.0% Never married50.0% Now married0.0% Separated0.0% Widowed0.0% DivorcedWomen who did not give birth in the past 12 months Now married:
0.0% (0)Unmarried:
100.0% (13)
Marital status - American Indian / Alaska Native population 15 years and over
Males 100.0% Never married0.0% Now married0.0% Separated0.0% Widowed0.0% DivorcedFemales 100.0% Never married0.0% Now married0.0% Separated0.0% Widowed0.0% DivorcedWomen who did not give birth in the past 12 months Now married:
0.0% (0)Unmarried:
100.0% (5)
Marital status - Asian population 15 years and over
Males 46.8% Never married53.2% Now married0.0% Separated0.0% Widowed0.0% DivorcedFemales 67.9% Never married32.1% Now married0.0% Separated0.0% Widowed0.0% DivorcedWomen who gave birth in the past 12 months Now married:
100.0% (28)Unmarried:
0.0% (0)
Women who did not give birth in the past 12 months Now married:
14.6% (16)Unmarried:
85.4% (91)
Marital status - Other race population 15 years and over
Males 6.5% Never married74.5% Now married0.0% Separated4.9% Widowed14.1% DivorcedFemales 15.7% Never married62.1% Now married3.8% Separated16.1% Widowed2.3% DivorcedWomen who gave birth in the past 12 months Now married:
100.0% (80)Unmarried:
0.0% (0)
Women who did not give birth in the past 12 months Now married:
54.4% (71)Unmarried:
45.6% (59)
Marital status - Two or more races population 15 years and over
Males 62.1% Never married28.9% Now married3.7% Separated0.0% Widowed5.4% DivorcedFemales 45.9% Never married19.4% Now married0.0% Separated2.5% Widowed32.2% DivorcedWomen who did not give birth in the past 12 months Now married:
20.5% (207)Unmarried:
79.5% (800)
Marital status - White alone, not Hispanic / Latino population 15 years and over
Males 52.9% Never married27.0% Now married0.3% Separated4.9% Widowed14.8% DivorcedFemales 46.9% Never married21.0% Now married2.4% Separated12.7% Widowed17.0% DivorcedWomen who gave birth in the past 12 months Now married:
0.0% (0)Unmarried:
100.0% (46)
Women who did not give birth in the past 12 months Now married:
15.1% (120)Unmarried:
84.9% (671)
Marital status - Hispanic or Latino population 15 years and over
Males 49.4% Never married40.3% Now married3.0% Separated1.5% Widowed5.8% DivorcedFemales 34.0% Never married33.3% Now married2.8% Separated5.8% Widowed24.0% DivorcedWomen who gave birth in the past 12 months Now married:
100.0% (80)Unmarried:
0.0% (0)
Women who did not give birth in the past 12 months Now married:
30.1% (328)Unmarried:
69.9% (760)
Ancestries in Silver City
596 11.3% English408 7.7% Irish150 2.8% German82 1.5% American51 1.0% Norwegian46 0.9% European46 0.9% French31 0.6% Italian22 0.4% Danish18 0.3% Dutch16 0.3% Armenian15 0.3% Northern European15 0.3% Polish15 0.3% Scottish13 0.2% Swedish12 0.2% Serbian11 0.2% Scandinavian11 0.2% Scotch-Irish8 0.2% British6 0.1% French Canadian4 0.08% Egyptian4 0.08% Haitian
Geographical mobility in Silver City Same house 1 year ago 4,342 82.7% White (Caucasian)110 98.8% Black or African American132 73.6% Asian1,056 100.0% Other race1,774 70.7% Two or more races3,456 84.2% White alone, not Hispanic / Latino3,907 81.6% Hispanic or LatinoMoved within same county 320 6.1% White / Caucasian20 11.3% Asian6 0.6% Other race204 8.1% Two or more races114 2.8% White alone, not Hispanic / Latino418 8.7% Hispanic or LatinoMoved within same state 58 1.1% White / Caucasian9 74.3% American Indian / Alaska Native11 6.0% Asian425 16.9% Two or more races45 1.1% White alone, not Hispanic / Latino256 5.3% Hispanic or LatinoMoved from different state 601 11.4% White / Caucasian3 2.6% Black or African American5 42.7% American Indian / Alaska Native104 4.1% Two or more races538 13.1% White alone, not Hispanic / Latino171 3.6% Hispanic or LatinoMoved from abroad 16 0.3% White18 0.7% Two or more races22 0.5% White alone, not Hispanic / Latino
Children Nativity (place of birth) in Silver City
Children under 6 years - Living with two parents Both parents native 37 100.0% NativeBoth parents foreign-born 79 100.0% NativeOne native, one foreign-born parent 339 100.0% NativeChildren under 6 years - Living with one parent Native parent 280 100.0% Native
Children 6 to 17 years - Living with two parents Both parents native 403 100.0% NativeBoth parents foreign-born 115 100.0% NativeOne native, one foreign-born parent 222 100.0% NativeChildren 6 to 17 years - Living with one parent Native parent 597 100.0% Native
Grandparents responsible for own grandchildren in Silver City
Grandparents (30 to 59 years) White / Caucasian 24 100.0% Responsible for grandchildrenTwo or more races 11 100.0% Not responsible for grandchildrenWhite alone, not Hispanic / Latino 10 100.0% Responsible for grandchildrenHispanic or Latino 11 58.0% Responsible for grandchildren8 42.0% Not responsible for grandchildrenGrandparents (60 years and over) White / Caucasian 62 60.7% Responsible for grandchildren40 39.3% Not responsible for grandchildrenWhite alone, not Hispanic / Latino 12 16.6% Responsible for grandchildren62 83.4% Not responsible for grandchildrenHispanic or Latino 57 42.2% Responsible for grandchildren78 57.8% Not responsible for grandchildren