Races in Sherwood, Oregon (OR) Detailed Stats
Data:
Races - White alone (%)
Races - White alone (% change since 2000)
Races - Black alone (%)
Races - Black alone (% change since 2000)
Races - American Indian alone (%)
Races - American Indian alone (% change since 2000)
Races - Asian alone (%)
Races - Asian alone (% change since 2000)
Races - Hispanic (%)
Races - Hispanic (% change since 2000)
Races - Native Hawaiian and Other Pacific Islander alone (%)
Races - Native Hawaiian and Other Pacific Islander alone (% change since 2000)
Races - Two or more races(%)
Races - Two or more races(% change since 2000)
Races - Other race alone (%)
Races - Other race alone (% change since 2000)
Racial diversity
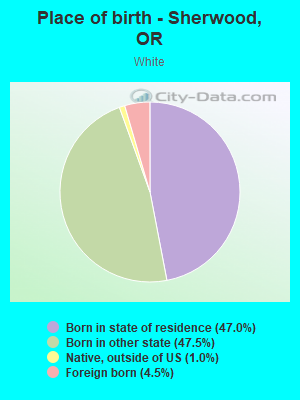
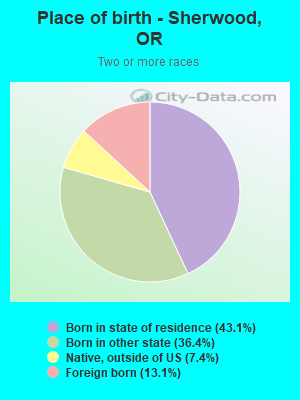
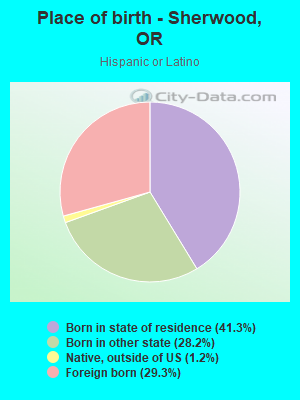
Place of birth - Born in state of residence (%)
Place of birth - Born in state of residence (%) - White
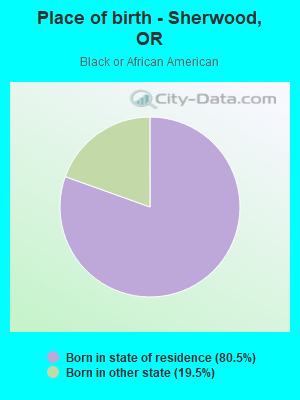
Place of birth - Born in state of residence (%) - Black or African American
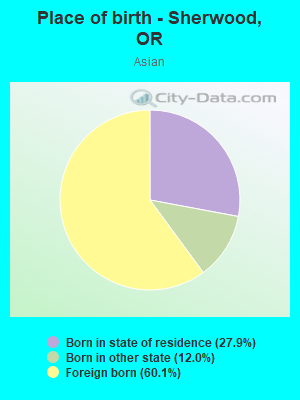
Place of birth - Born in state of residence (%) - Asian
Place of birth - Born in state of residence (%) - Hispanic or Latino
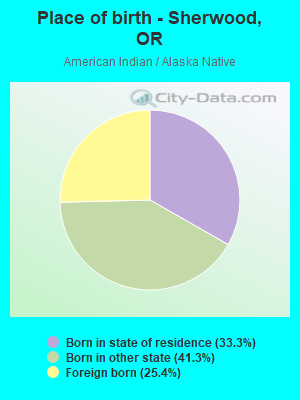
Place of birth - Born in state of residence (%) - American Indian and Alaska Native
Place of birth - Born in state of residence (%) - Multirace
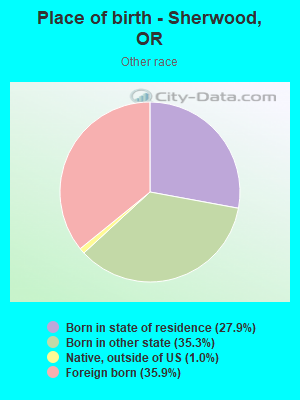
Place of birth - Born in state of residence (%) - Other Race
Place of birth - Born in other state (%)
Place of birth - Born in other state (%) - White
Place of birth - Born in other state (%) - Black or African American
Place of birth - Born in other state (%) - Asian
Place of birth - Born in other state (%) - Hispanic or Latino
Place of birth - Born in other state (%) - American Indian and Alaska Native
Place of birth - Born in other state (%) - Multirace
Place of birth - Born in other state (%) - Other Race
Place of birth - Native, outside of US (%)
Place of birth - Native, outside of US (%) - White
Place of birth - Native, outside of US (%) - Black or African American
Place of birth - Native, outside of US (%) - Asian
Place of birth - Native, outside of US (%) - Hispanic or Latino
Place of birth - Native, outside of US (%) - American Indian and Alaska Native
Place of birth - Native, outside of US (%) - Multirace
Place of birth - Native, outside of US (%) - Other Race
Place of birth - Foreign born (%)
Place of birth - Foreign born (%) - White
Place of birth - Foreign born (%) - Black or African American
Place of birth - Foreign born (%) - Asian
Place of birth - Foreign born (%) - Hispanic or Latino
Place of birth - Foreign born (%) - American Indian and Alaska Native
Place of birth - Foreign born (%) - Multirace
Place of birth - Foreign born (%) - Other Race
Residents speaking English at home (%)
Residents speaking English at home - Born in the United States (%)
Residents speaking English at home - Native, born elsewhere (%)
Residents speaking English at home - Foreign born (%)
Residents speaking Spanish at home (%)
Residents speaking Spanish at home - Born in the United States (%)
Residents speaking Spanish at home - Native, born elsewhere (%)
Residents speaking Spanish at home - Foreign born (%)
Residents speaking other language at home (%)
Residents speaking other language at home - Born in the United States (%)
Residents speaking other language at home - Native, born elsewhere (%)
Residents speaking other language at home - Foreign born (%)
Marital status - Never married (%)
Marital status - Now married (%)
Marital status - Separated (%)
Marital status - Widowed (%)
Marital status - Divorced (%)
Ancestries Reported - Arab (%)
Ancestries Reported - Czech (%)
Ancestries Reported - Danish (%)
Ancestries Reported - Dutch (%)
Ancestries Reported - English (%)
Ancestries Reported - French (%)
Ancestries Reported - French Canadian (%)
Ancestries Reported - German (%)
Ancestries Reported - Greek (%)
Ancestries Reported - Hungarian (%)
Ancestries Reported - Irish (%)
Ancestries Reported - Italian (%)
Ancestries Reported - Lithuanian (%)
Ancestries Reported - Norwegian (%)
Ancestries Reported - Polish (%)
Ancestries Reported - Portuguese (%)
Ancestries Reported - Russian (%)
Ancestries Reported - Scotch-Irish (%)
Ancestries Reported - Scottish (%)
Ancestries Reported - Slovak (%)
Ancestries Reported - Subsaharan African (%)
Ancestries Reported - Swedish (%)
Ancestries Reported - Swiss (%)
Ancestries Reported - Ukrainian (%)
Ancestries Reported - United States (%)
Ancestries Reported - Welsh (%)
Ancestries Reported - West Indian (%)
Ancestries Reported - Other (%)
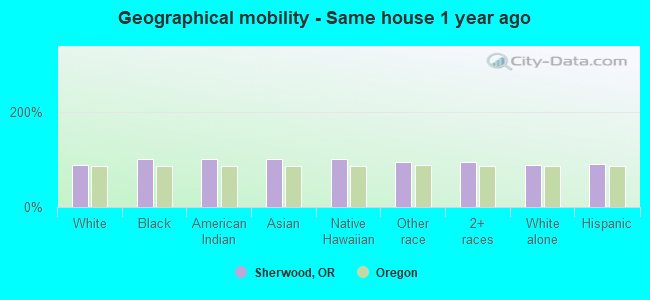
Geographical mobility - Same house 1 year ago (%)
Geographical mobility - Same house 1 year ago (%) - White
Geographical mobility - Same house 1 year ago (%) - Black or African American
Geographical mobility - Same house 1 year ago (%) - Asian
Geographical mobility - Same house 1 year ago (%) - Hispanic or Latino
Geographical mobility - Same house 1 year ago (%) - American Indian and Alaska Native
Geographical mobility - Same house 1 year ago (%) - Multirace
Geographical mobility - Same house 1 year ago (%) - Other Race
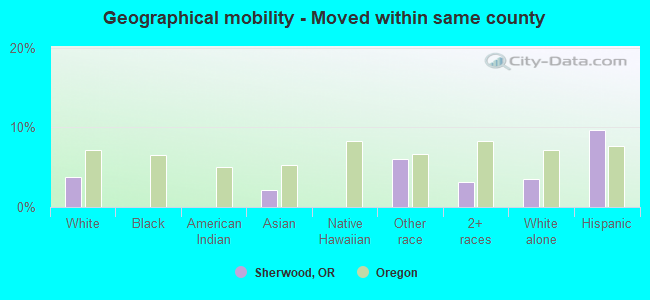
Geographical mobility - Moved within same county (%)
Geographical mobility - Moved within same county (%) - White
Geographical mobility - Moved within same county (%) - Black or African American
Geographical mobility - Moved within same county (%) - Asian
Geographical mobility - Moved within same county (%) - Hispanic or Latino
Geographical mobility - Moved within same county (%) - American Indian and Alaska Native
Geographical mobility - Moved within same county (%) - Multirace
Geographical mobility - Moved within same county (%) - Other Race
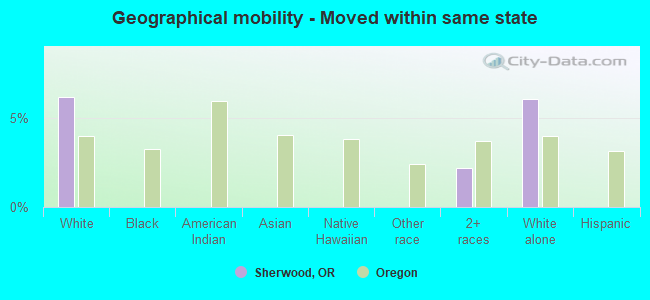
Geographical mobility - Moved from different county within same state (%)
Geographical mobility - Moved from different county within same state (%) - White
Geographical mobility - Moved from different county within same state (%) - Black or African American
Geographical mobility - Moved from different county within same state (%) - Asian
Geographical mobility - Moved from different county within same state (%) - Hispanic or Latino
Geographical mobility - Moved from different county within same state (%) - American Indian and Alaska Native
Geographical mobility - Moved from different county within same state (%) - Multirace
Geographical mobility - Moved from different county within same state (%) - Other Race
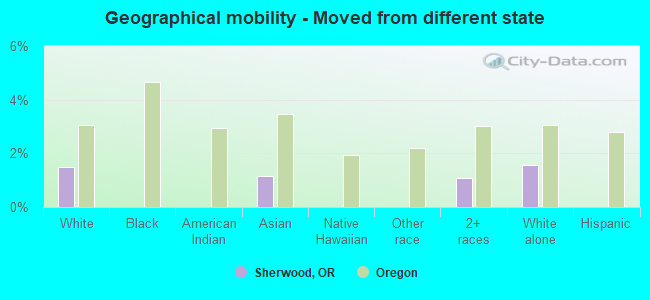
Geographical mobility - Moved from different state (%)
Geographical mobility - Moved from different state (%) - White
Geographical mobility - Moved from different state (%) - Black or African American
Geographical mobility - Moved from different state (%) - Asian
Geographical mobility - Moved from different state (%) - Hispanic or Latino
Geographical mobility - Moved from different state (%) - American Indian and Alaska Native
Geographical mobility - Moved from different state (%) - Multirace
Geographical mobility - Moved from different state (%) - Other Race
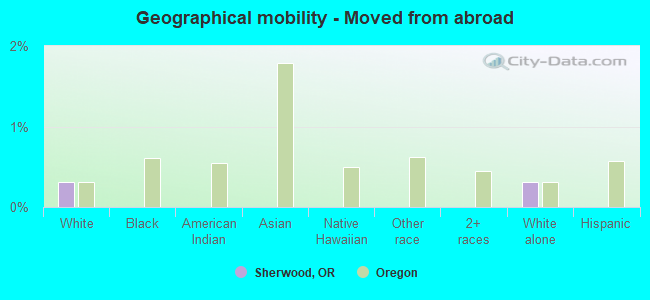
Geographical mobility - Moved from abroad (%)
Geographical mobility - Moved from abroad (%) - White
Geographical mobility - Moved from abroad (%) - Black or African American
Geographical mobility - Moved from abroad (%) - Asian
Geographical mobility - Moved from abroad (%) - Hispanic or Latino
Geographical mobility - Moved from abroad (%) - American Indian and Alaska Native
Geographical mobility - Moved from abroad (%) - Multirace
Geographical mobility - Moved from abroad (%) - Other Race
Place of birth for the foreign-born population - Ireland (%)
Place of birth for the foreign-born population - Denmark (%)
Place of birth for the foreign-born population - Norway (%)
Place of birth for the foreign-born population - Sweden (%)
Place of birth for the foreign-born population - United Kingdom (%)
Place of birth for the foreign-born population - England (%)
Place of birth for the foreign-born population - Scotland (%)
Place of birth for the foreign-born population - Other Northern Europe (%)
Place of birth for the foreign-born population - Austria (%)
Place of birth for the foreign-born population - Belgium (%)
Place of birth for the foreign-born population - France (%)
Place of birth for the foreign-born population - Germany (%)
Place of birth for the foreign-born population - Netherlands (%)
Place of birth for the foreign-born population - Switzerland (%)
Place of birth for the foreign-born population - Other Western Europe (%)
Place of birth for the foreign-born population - Greece (%)
Place of birth for the foreign-born population - Italy (%)
Place of birth for the foreign-born population - Portugal (%)
Place of birth for the foreign-born population - Spain (%)
Place of birth for the foreign-born population - Other Southern Europe (%)
Place of birth for the foreign-born population - Albania (%)
Place of birth for the foreign-born population - Belarus (%)
Place of birth for the foreign-born population - Bosnia and Herzegovina (%)
Place of birth for the foreign-born population - Bulgaria (%)
Place of birth for the foreign-born population - Croatia (%)
Place of birth for the foreign-born population - Czechoslovakia (%)
Place of birth for the foreign-born population - Hungary (%)
Place of birth for the foreign-born population - Latvia (%)
Place of birth for the foreign-born population - Lithuania (%)
Place of birth for the foreign-born population - North Macedonia (Macedonia) (%)
Place of birth for the foreign-born population - Moldova (%)
Place of birth for the foreign-born population - Poland (%)
Place of birth for the foreign-born population - Romania (%)
Place of birth for the foreign-born population - Russia (%)
Place of birth for the foreign-born population - Serbia (%)
Place of birth for the foreign-born population - Ukraine (%)
Place of birth for the foreign-born population - Other Eastern Europe (%)
Place of birth for the foreign-born population - China (%)
Place of birth for the foreign-born population - Hong Kong (%)
Place of birth for the foreign-born population - Taiwan (%)
Place of birth for the foreign-born population - Japan (%)
Place of birth for the foreign-born population - Korea (%)
Place of birth for the foreign-born population - Other Eastern Asia (%)
Place of birth for the foreign-born population - Afghanistan (%)
Place of birth for the foreign-born population - Bangladesh (%)
Place of birth for the foreign-born population - India (%)
Place of birth for the foreign-born population - Iran (%)
Place of birth for the foreign-born population - Kazakhstan (%)
Place of birth for the foreign-born population - Nepal (%)
Place of birth for the foreign-born population - Pakistan (%)
Place of birth for the foreign-born population - Sri Lanka (%)
Place of birth for the foreign-born population - Uzbekistan (%)
Place of birth for the foreign-born population - Other South Central Asia (%)
Place of birth for the foreign-born population - Burma (%)
Place of birth for the foreign-born population - Cambodia (%)
Place of birth for the foreign-born population - Indonesia (%)
Place of birth for the foreign-born population - Laos (%)
Place of birth for the foreign-born population - Malaysia (%)
Place of birth for the foreign-born population - Philippines (%)
Place of birth for the foreign-born population - Singapore (%)
Place of birth for the foreign-born population - Thailand (%)
Place of birth for the foreign-born population - Vietnam (%)
Place of birth for the foreign-born population - Other South Eastern Asia (%)
Place of birth for the foreign-born population - Armenia (%)
Place of birth for the foreign-born population - Iraq (%)
Place of birth for the foreign-born population - Israel (%)
Place of birth for the foreign-born population - Jordan (%)
Place of birth for the foreign-born population - Kuwait (%)
Place of birth for the foreign-born population - Lebanon (%)
Place of birth for the foreign-born population - Saudi Arabia (%)
Place of birth for the foreign-born population - Syria (%)
Place of birth for the foreign-born population - Turkey (%)
Place of birth for the foreign-born population - Yemen (%)
Place of birth for the foreign-born population - Other Western Asia (%)
Place of birth for the foreign-born population - Eritrea (%)
Place of birth for the foreign-born population - Ethiopia (%)
Place of birth for the foreign-born population - Kenya (%)
Place of birth for the foreign-born population - Somalia (%)
Place of birth for the foreign-born population - Uganda (%)
Place of birth for the foreign-born population - Zimbabwe (%)
Place of birth for the foreign-born population - Other Eastern Africa (%)
Place of birth for the foreign-born population - Cameroon (%)
Place of birth for the foreign-born population - Congo (%)
Place of birth for the foreign-born population - Democratic Republic of Congo (Zaire) (%)
Place of birth for the foreign-born population - Other Middle Africa (%)
Place of birth for the foreign-born population - Egypt (%)
Place of birth for the foreign-born population - Morocco (%)
Place of birth for the foreign-born population - Sudan (%)
Place of birth for the foreign-born population - Other Northern Africa (%)
Place of birth for the foreign-born population - South Africa (%)
Place of birth for the foreign-born population - Other Southern Africa (%)
Place of birth for the foreign-born population - Cabo Verde (%)
Place of birth for the foreign-born population - Ghana (%)
Place of birth for the foreign-born population - Liberia (%)
Place of birth for the foreign-born population - Nigeria (%)
Place of birth for the foreign-born population - Senegal (%)
Place of birth for the foreign-born population - Sierra Leone (%)
Place of birth for the foreign-born population - Other Western Africa (%)
Place of birth for the foreign-born population - Australia (%)
Place of birth for the foreign-born population - New Zealand (%)
Place of birth for the foreign-born population - Fiji (%)
Place of birth for the foreign-born population - Micronesia (%)
Place of birth for the foreign-born population - Bahamas (%)
Place of birth for the foreign-born population - Barbados (%)
Place of birth for the foreign-born population - Cuba (%)
Place of birth for the foreign-born population - Dominica (%)
Place of birth for the foreign-born population - Dominican Republic (%)
Place of birth for the foreign-born population - Grenada (%)
Place of birth for the foreign-born population - Haiti (%)
Place of birth for the foreign-born population - Jamaica (%)
Place of birth for the foreign-born population - St. Vincent and the Grenadines (%)
Place of birth for the foreign-born population - Trinidad and Tobago (%)
Place of birth for the foreign-born population - West Indies (%)
Place of birth for the foreign-born population - Other Caribbean (%)
Place of birth for the foreign-born population - Belize (%)
Place of birth for the foreign-born population - Costa Rica (%)
Place of birth for the foreign-born population - El Salvador (%)
Place of birth for the foreign-born population - Guatemala (%)
Place of birth for the foreign-born population - Honduras (%)
Place of birth for the foreign-born population - Mexico (%)
Place of birth for the foreign-born population - Nicaragua (%)
Place of birth for the foreign-born population - Panama (%)
Place of birth for the foreign-born population - Other Central America (%)
Place of birth for the foreign-born population - Argentina (%)
Place of birth for the foreign-born population - Bolivia (%)
Place of birth for the foreign-born population - Brazil (%)
Place of birth for the foreign-born population - Chile (%)
Place of birth for the foreign-born population - Colombia (%)
Place of birth for the foreign-born population - Ecuador (%)
Place of birth for the foreign-born population - Guyana (%)
Place of birth for the foreign-born population - Peru (%)
Place of birth for the foreign-born population - Uruguay (%)
Place of birth for the foreign-born population - Venezuela (%)
Place of birth for the foreign-born population - Other South America (%)
Place of birth for the foreign-born population - Canada (%)
Place of birth for the foreign-born population - Other Northern America (%)
Place of birth for the foreign-born population - Other (%)
Latest news about races in Sherwood, OR collected exclusively by city-data.com from local newspapers, TV, and radio stations
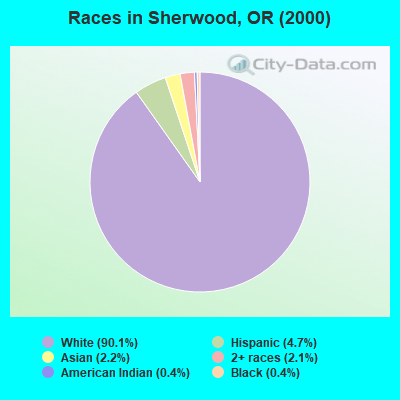
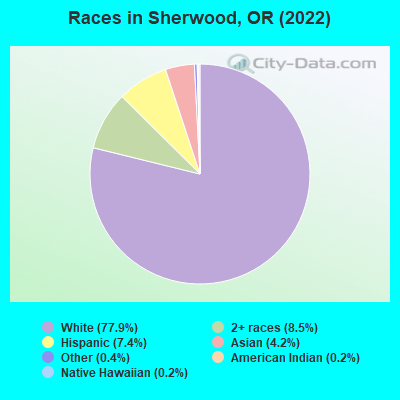
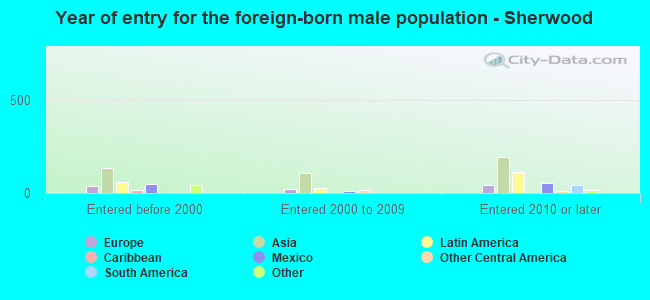
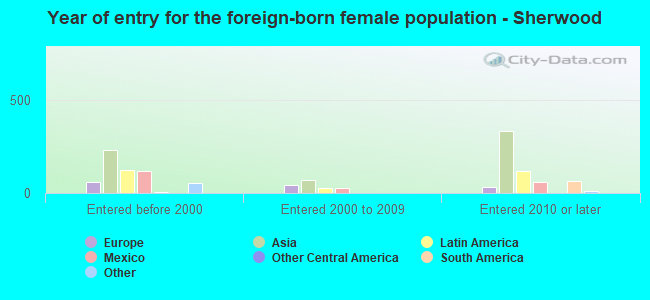
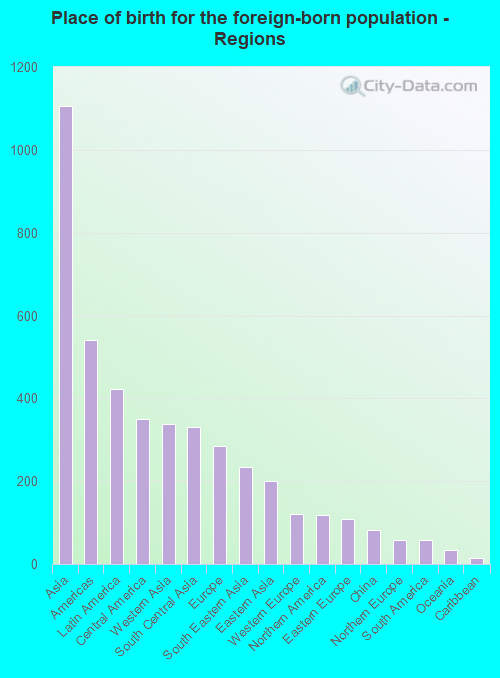
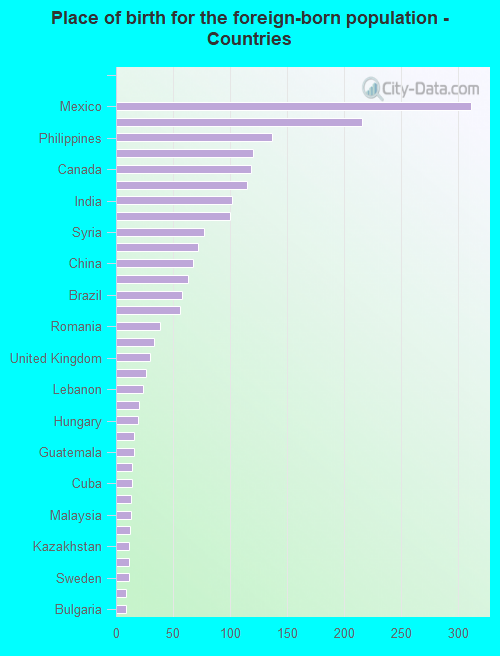
According to 2022 data, the most numerous races in Sherwood, OR are White alone (15,820 residents), Hispanic (1,511 residents), and Two or more races (1,724 residents). 85.9% of Sherwood residents speak English at home. 9.7% of Sherwood, OR residents are foreign-born (5.3% born in Asia, 2.0% born in Latin America, 1.4% born in Europe), which is 7.1% greater than the foreign-born rate of 9.0% across the entire state of Oregon.
Race distribution in Sherwood
2000 2022
2,857,616 83.5% White alone 275,314 8.0% Hispanic 100,333 2.9% Asian alone 82,733 2.4% Two or more races 53,325 1.6% Black alone 40,130 1.2% American Indian alone 7,398 0.2% Native Hawaiian and Other 4,550 0.1% Other race alone
3,037,571 71.6% White alone 609,538 14.4% Hispanic 252,744 6.0% Two or more races 191,283 4.5% Asian alone 78,228 1.8% Black alone 29,399 0.7% American Indian alone 25,731 0.6% Other race alone 15,643 0.4% Native Hawaiian and Other
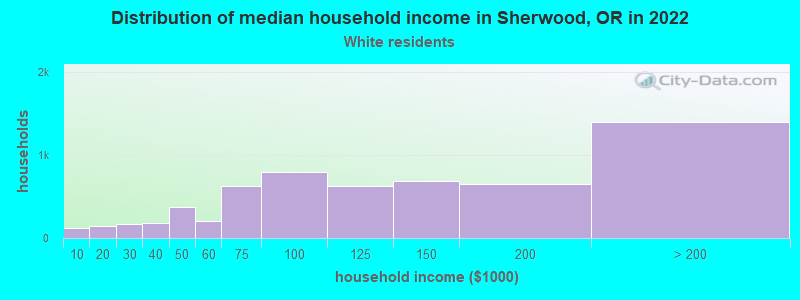
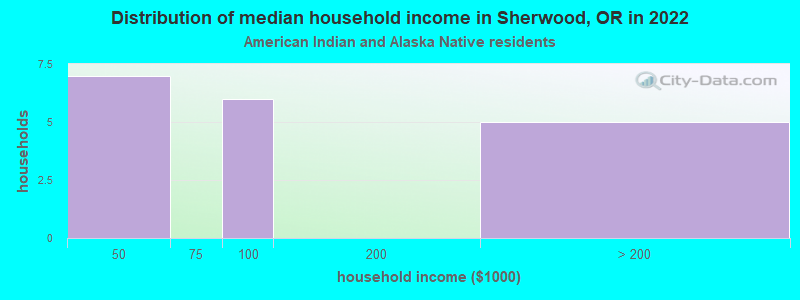
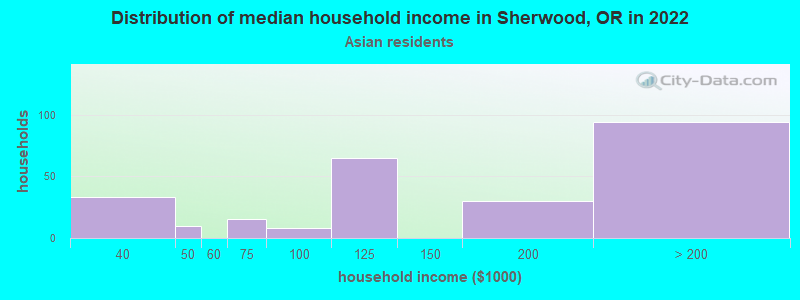
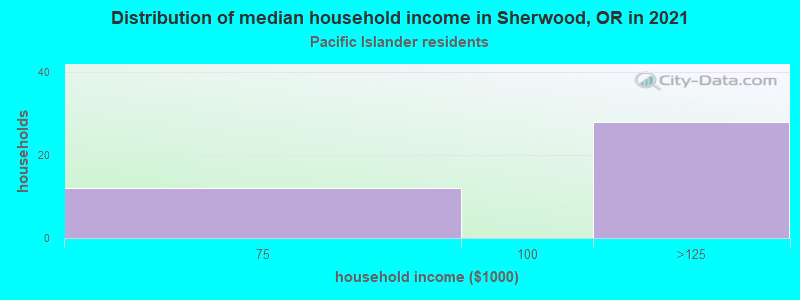
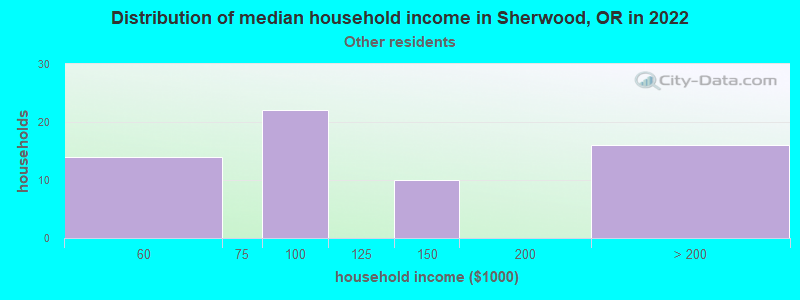
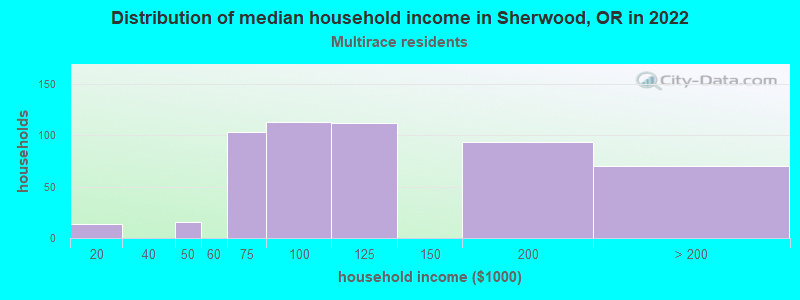
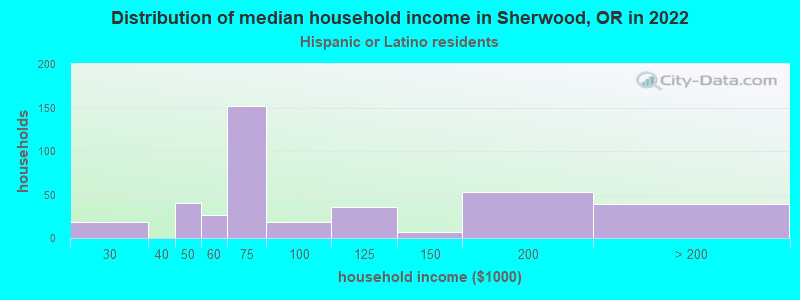
Income and house value in Sherwood Median household income in 2022 $113,469 White non-Hispanic householders$117,245 Asian householders$84,314 Native Hawaiian and other Pacific Islander householders$98,725 Some other race householders$91,198 Two or more races householders$63,923 Hispanic or Latino race householdersMedian 2022 house value $628,836 White Non-Hispanic householders$543,542 Black or African American householders$508,755 American Indian or Alaska Native householders $624,823 Asian householders$585,353 Some other race householders$614,119 Two or more races householders$639,874 Hispanic or Latino householders
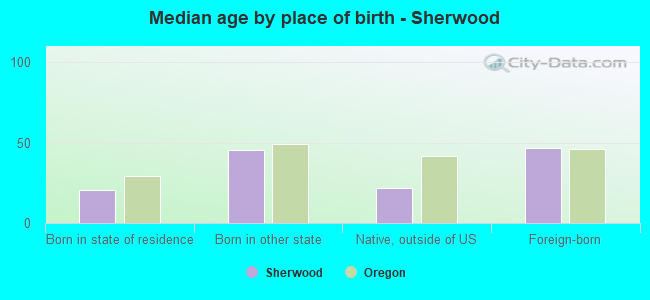
Median age by race in Sherwood
39.6 Median age for White residents37.6 41.1 21.1 Median age for Black or African American residents-707,566,461.5 -652,307,691.7 55.7 Median age for American Indian / Alaska Native residents-838,647,342.2 59.7 44.2 Median age for Asian residents48.8 40.1 79.6 Median age for Native Hawaiian / Pacific Islander residents-476,923,076.4 -850,649,349.8 35.3 Median age for Other race residents36.6 34.2 22.8 Median age for Two or more races residents26.9 22.0 39.2 Median age for White alone residents37.2 40.7 23.9 Median age for Hispanic or Latino residents34.1 23.4
Owner/renter occupied households by race in Sherwood
House owners and renters - White residents 4,421 73.9% Owner occupied1,565 26.1% Renter occupiedHouse owners and renters - American Indian / Alaska Native residents 8 33.4% Owner occupied15 66.6% Renter occupiedHouse owners and renters - Asian residents 229 92.0% Owner occupied20 8.0% Renter occupiedHouse owners and renters - Native Hawaiian / Pacific Islander residents 51 100.0% Owner occupiedHouse owners and renters - Other race residents 75 100.0% Owner occupiedHouse owners and renters - Two or more races residents 361 64.1% Owner occupied202 35.9% Renter occupiedHouse owners and renters - White alone residents 4,370 73.5% Owner occupied1,578 26.5% Renter occupiedHouse owners and renters - Hispanic or Latino residents 173 49.8% Owner occupied175 50.2% Renter occupied
Language usage in Sherwood
English speakers - Total 85.9% of residents of Sherwood speak English at home.
4.9% of residents speak Spanish at home 821 86.8% Speak English very well125 13.2% Speak English less than very well8.1% of residents speak other language at home 1,277 81.2% Speak English very well295 18.8% Speak English less than very well
English speakers - Born in the United States 95.7% of residents of Sherwood speak English at home.
2.2% of residents speak Spanish at home 192 100.0% Speak English very well0.9% of residents speak other language at home 81 100.0% Speak English very well
English speakers - Native, born elsewhere 59.1% of residents of Sherwood speak English at home.
69.3% of residents speak other language at home 144 75.8% Speak English very well46 24.2% Speak English less than very well
English speakers - Foreign-born 19.2% of residents of Sherwood speak English at home.
21.8% of residents speak Spanish at home 354 82.5% Speak English very well75 17.5% Speak English less than very well58.4% of residents speak other language at home 931 81.2% Speak English very well216 18.8% Speak English less than very well
White (Caucasian) - Speak only English Native:
97.6% (13,854)Foreign-born:
26.7% (188)
White (Caucasian) - Speak another language Native:
2.7% (380)Foreign-born:
73.2% (515)
American Indian / Alaska Native - Speak another language Native:
31.0% (10)Foreign-born:
100.0% (11)
Asian - Speak only English Native:
81.6% (273)Foreign-born:
27.5% (146)
Asian - Speak another language Native:
13.7% (46)Foreign-born:
69.0% (367)
Other race - Speak only English Native:
64.8% (158)Foreign-born:
7.4% (11)
Other race - Speak another language Native:
32.7% (80)Foreign-born:
92.4% (139)
Two or more races - Speak only English Native:
83.4% (1,862)Foreign-born:
4.2% (15)
Two or more races - Speak another language Native:
16.1% (360)Foreign-born:
96.0% (353)
White alone - Speak only English Native:
96.8% (13,882)Foreign-born:
24.8% (209)
White alone - Speak another language Native:
3.2% (456)Foreign-born:
75.1% (633)
Hispanic or Latino - Speak only English Native:
63.5% (647)Foreign-born:
6.8% (29)
Hispanic or Latino - Speak another language Native:
33.9% (345)Foreign-born:
92.9% (402)
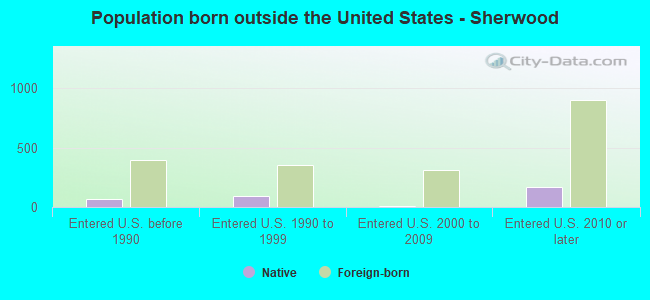
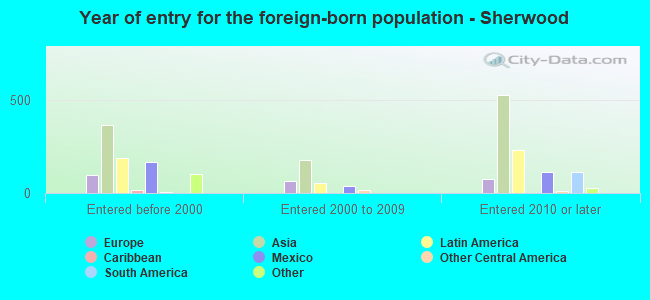
Foreign-born residents in Sherwood 1,967 residents are foreign born (5.3% Asia , 2.0% Latin America , 1.4% Europe ).
This city:
9.7%Oregon:
9.8%
Marital status for residents in Sherwood Marital status - White (Caucasian) population 15 years and over
Males 29.7% Never married60.6% Now married0.0% Separated1.7% Widowed8.0% DivorcedFemales 25.0% Never married56.0% Now married2.4% Separated5.5% Widowed11.1% DivorcedWomen who gave birth in the past 12 months Now married:
60.8% (53)Unmarried:
39.2% (34)
Women who did not give birth in the past 12 months Now married:
53.5% (1,969)Unmarried:
46.5% (1,711)
Marital status - Black or African American population 15 years and over
Males 0.0% Never married100.0% Now married0.0% Separated0.0% Widowed0.0% DivorcedFemales 100.0% Never married0.0% Now married0.0% Separated0.0% Widowed0.0% DivorcedWomen who did not give birth in the past 12 months Now married:
0.0% (0)Unmarried:
100.0% (68)
Marital status - American Indian / Alaska Native population 15 years and over
Males 100.0% Never married0.0% Now married0.0% Separated0.0% Widowed0.0% DivorcedFemales 0.0% Never married76.5% Now married0.0% Separated0.0% Widowed23.5% DivorcedWomen who did not give birth in the past 12 months Now married:
100.0% (14)Unmarried:
0.0% (0)
Marital status - Asian population 15 years and over
Males 6.2% Never married88.4% Now married0.0% Separated0.0% Widowed5.4% DivorcedFemales 10.6% Never married74.5% Now married3.1% Separated0.0% Widowed11.8% DivorcedWomen who gave birth in the past 12 months Now married:
100.0% (16)Unmarried:
0.0% (0)
Women who did not give birth in the past 12 months Now married:
78.2% (176)Unmarried:
21.8% (49)
Marital status - Native Hawaiian / Pacific Islander population 15 years and over
Males 0.0% Never married100.0% Now married0.0% Separated0.0% Widowed0.0% DivorcedFemales 0.0% Never married0.0% Now married0.0% Separated100.0% Widowed0.0% DivorcedMarital status - Other race population 15 years and over
Males 19.8% Never married55.4% Now married0.0% Separated0.0% Widowed24.8% DivorcedFemales 0.0% Never married78.8% Now married21.2% Separated0.0% Widowed0.0% DivorcedWomen who did not give birth in the past 12 months Now married:
100.0% (93)Unmarried:
0.0% (0)
Marital status - Two or more races population 15 years and over
Males 34.2% Never married61.9% Now married0.0% Separated0.0% Widowed3.8% DivorcedFemales 43.8% Never married43.2% Now married0.0% Separated0.7% Widowed12.2% DivorcedWomen who gave birth in the past 12 months Now married:
100.0% (12)Unmarried:
0.0% (0)
Women who did not give birth in the past 12 months Now married:
39.8% (386)Unmarried:
60.2% (584)
Marital status - White alone, not Hispanic / Latino population 15 years and over
Males 29.6% Never married60.9% Now married0.0% Separated1.5% Widowed8.0% DivorcedFemales 24.6% Never married56.7% Now married2.4% Separated5.6% Widowed10.7% DivorcedWomen who gave birth in the past 12 months Now married:
60.8% (57)Unmarried:
39.2% (36)
Women who did not give birth in the past 12 months Now married:
54.6% (2,050)Unmarried:
45.4% (1,704)
Marital status - Hispanic or Latino population 15 years and over
Males 34.1% Never married52.2% Now married0.0% Separated3.4% Widowed10.3% DivorcedFemales 49.1% Never married28.0% Now married2.9% Separated0.0% Widowed20.0% DivorcedWomen who did not give birth in the past 12 months Now married:
26.7% (187)Unmarried:
73.3% (514)
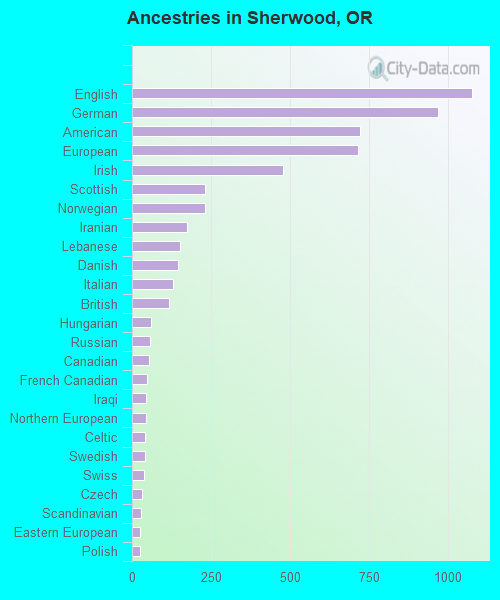
Ancestries in Sherwood
1,076 13.1% English969 11.8% German723 8.8% American716 8.7% European478 5.8% Irish231 2.8% Scottish230 2.8% Norwegian173 2.1% Iranian153 1.9% Lebanese146 1.8% Danish131 1.6% Italian116 1.4% British60 0.7% Hungarian56 0.7% Russian53 0.6% Canadian48 0.6% French Canadian45 0.5% Iraqi45 0.5% Northern European42 0.5% Celtic42 0.5% Swedish37 0.5% Swiss32 0.4% Czech29 0.4% Scandinavian26 0.3% Eastern European26 0.3% Polish26 0.3% Romanian21 0.3% Scotch-Irish20 0.2% Dutch18 0.2% Greek16 0.2% French16 0.2% Portuguese7 0.09% Welsh6 0.07% Ukrainian5 0.06% Arab
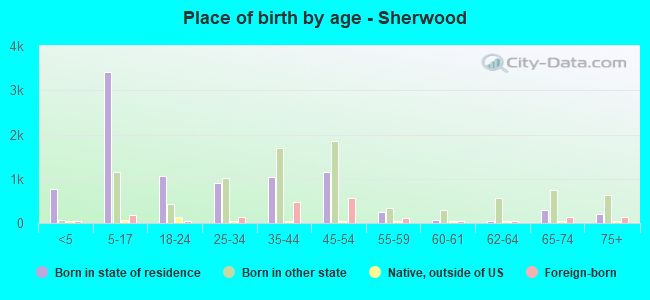
Children Nativity (place of birth) in Sherwood
Children under 6 years - Living with two parents Both parents native 809 100.0% NativeBoth parents foreign-born 123 92.7% Native10 7.3% Foreign-bornOne native, one foreign-born parent 114 100.0% NativeChildren under 6 years - Living with one parent Native parent 205 100.0% NativeForeign-born parent 7 100.0% NativeChildren 6 to 17 years - Living with two parents Both parents native 2,984 99.8% Native6 0.2% Foreign-bornBoth parents foreign-born 244 58.7% Native172 41.3% Foreign-bornOne native, one foreign-born parent 279 96.4% Native10 3.6% Foreign-bornChildren 6 to 17 years - Living with one parent Native parent 710 100.0% NativeForeign-born parent 88 51.3% Native84 48.7% Foreign-born
Grandparents responsible for own grandchildren in Sherwood
Grandparents (30 to 59 years) White / Caucasian 9 48.0% Responsible for grandchildren10 52.0% Not responsible for grandchildrenAsian 8 100.0% Responsible for grandchildrenWhite alone, not Hispanic / Latino 9 43.8% Responsible for grandchildren12 56.2% Not responsible for grandchildrenGrandparents (60 years and over) White / Caucasian 16 7.6% Responsible for grandchildren194 92.4% Not responsible for grandchildrenAsian 10 100.0% Not responsible for grandchildrenWhite alone, not Hispanic / Latino 17 6.6% Responsible for grandchildren234 93.4% Not responsible for grandchildren