Races in Shawnee, Oklahoma (OK) Detailed Stats
Data:
Races - White alone (%)
Races - White alone (% change since 2000)
Races - Black alone (%)
Races - Black alone (% change since 2000)
Races - American Indian alone (%)
Races - American Indian alone (% change since 2000)
Races - Asian alone (%)
Races - Asian alone (% change since 2000)
Races - Hispanic (%)
Races - Hispanic (% change since 2000)
Races - Native Hawaiian and Other Pacific Islander alone (%)
Races - Native Hawaiian and Other Pacific Islander alone (% change since 2000)
Races - Two or more races(%)
Races - Two or more races(% change since 2000)
Races - Other race alone (%)
Races - Other race alone (% change since 2000)
Racial diversity
Place of birth - Born in state of residence (%)
Place of birth - Born in state of residence (%) - White
Place of birth - Born in state of residence (%) - Black or African American
Place of birth - Born in state of residence (%) - Asian
Place of birth - Born in state of residence (%) - Hispanic or Latino
Place of birth - Born in state of residence (%) - American Indian and Alaska Native
Place of birth - Born in state of residence (%) - Multirace
Place of birth - Born in state of residence (%) - Other Race
Place of birth - Born in other state (%)
Place of birth - Born in other state (%) - White
Place of birth - Born in other state (%) - Black or African American
Place of birth - Born in other state (%) - Asian
Place of birth - Born in other state (%) - Hispanic or Latino
Place of birth - Born in other state (%) - American Indian and Alaska Native
Place of birth - Born in other state (%) - Multirace
Place of birth - Born in other state (%) - Other Race
Place of birth - Native, outside of US (%)
Place of birth - Native, outside of US (%) - White
Place of birth - Native, outside of US (%) - Black or African American
Place of birth - Native, outside of US (%) - Asian
Place of birth - Native, outside of US (%) - Hispanic or Latino
Place of birth - Native, outside of US (%) - American Indian and Alaska Native
Place of birth - Native, outside of US (%) - Multirace
Place of birth - Native, outside of US (%) - Other Race
Place of birth - Foreign born (%)
Place of birth - Foreign born (%) - White
Place of birth - Foreign born (%) - Black or African American
Place of birth - Foreign born (%) - Asian
Place of birth - Foreign born (%) - Hispanic or Latino
Place of birth - Foreign born (%) - American Indian and Alaska Native
Place of birth - Foreign born (%) - Multirace
Place of birth - Foreign born (%) - Other Race
Residents speaking English at home (%)
Residents speaking English at home - Born in the United States (%)
Residents speaking English at home - Native, born elsewhere (%)
Residents speaking English at home - Foreign born (%)
Residents speaking Spanish at home (%)
Residents speaking Spanish at home - Born in the United States (%)
Residents speaking Spanish at home - Native, born elsewhere (%)
Residents speaking Spanish at home - Foreign born (%)
Residents speaking other language at home (%)
Residents speaking other language at home - Born in the United States (%)
Residents speaking other language at home - Native, born elsewhere (%)
Residents speaking other language at home - Foreign born (%)
Marital status - Never married (%)
Marital status - Now married (%)
Marital status - Separated (%)
Marital status - Widowed (%)
Marital status - Divorced (%)
Ancestries Reported - Arab (%)
Ancestries Reported - Czech (%)
Ancestries Reported - Danish (%)
Ancestries Reported - Dutch (%)
Ancestries Reported - English (%)
Ancestries Reported - French (%)
Ancestries Reported - French Canadian (%)
Ancestries Reported - German (%)
Ancestries Reported - Greek (%)
Ancestries Reported - Hungarian (%)
Ancestries Reported - Irish (%)
Ancestries Reported - Italian (%)
Ancestries Reported - Lithuanian (%)
Ancestries Reported - Norwegian (%)
Ancestries Reported - Polish (%)
Ancestries Reported - Portuguese (%)
Ancestries Reported - Russian (%)
Ancestries Reported - Scotch-Irish (%)
Ancestries Reported - Scottish (%)
Ancestries Reported - Slovak (%)
Ancestries Reported - Subsaharan African (%)
Ancestries Reported - Swedish (%)
Ancestries Reported - Swiss (%)
Ancestries Reported - Ukrainian (%)
Ancestries Reported - United States (%)
Ancestries Reported - Welsh (%)
Ancestries Reported - West Indian (%)
Ancestries Reported - Other (%)
Geographical mobility - Same house 1 year ago (%)
Geographical mobility - Same house 1 year ago (%) - White
Geographical mobility - Same house 1 year ago (%) - Black or African American
Geographical mobility - Same house 1 year ago (%) - Asian
Geographical mobility - Same house 1 year ago (%) - Hispanic or Latino
Geographical mobility - Same house 1 year ago (%) - American Indian and Alaska Native
Geographical mobility - Same house 1 year ago (%) - Multirace
Geographical mobility - Same house 1 year ago (%) - Other Race
Geographical mobility - Moved within same county (%)
Geographical mobility - Moved within same county (%) - White
Geographical mobility - Moved within same county (%) - Black or African American
Geographical mobility - Moved within same county (%) - Asian
Geographical mobility - Moved within same county (%) - Hispanic or Latino
Geographical mobility - Moved within same county (%) - American Indian and Alaska Native
Geographical mobility - Moved within same county (%) - Multirace
Geographical mobility - Moved within same county (%) - Other Race
Geographical mobility - Moved from different county within same state (%)
Geographical mobility - Moved from different county within same state (%) - White
Geographical mobility - Moved from different county within same state (%) - Black or African American
Geographical mobility - Moved from different county within same state (%) - Asian
Geographical mobility - Moved from different county within same state (%) - Hispanic or Latino
Geographical mobility - Moved from different county within same state (%) - American Indian and Alaska Native
Geographical mobility - Moved from different county within same state (%) - Multirace
Geographical mobility - Moved from different county within same state (%) - Other Race
Geographical mobility - Moved from different state (%)
Geographical mobility - Moved from different state (%) - White
Geographical mobility - Moved from different state (%) - Black or African American
Geographical mobility - Moved from different state (%) - Asian
Geographical mobility - Moved from different state (%) - Hispanic or Latino
Geographical mobility - Moved from different state (%) - American Indian and Alaska Native
Geographical mobility - Moved from different state (%) - Multirace
Geographical mobility - Moved from different state (%) - Other Race
Geographical mobility - Moved from abroad (%)
Geographical mobility - Moved from abroad (%) - White
Geographical mobility - Moved from abroad (%) - Black or African American
Geographical mobility - Moved from abroad (%) - Asian
Geographical mobility - Moved from abroad (%) - Hispanic or Latino
Geographical mobility - Moved from abroad (%) - American Indian and Alaska Native
Geographical mobility - Moved from abroad (%) - Multirace
Geographical mobility - Moved from abroad (%) - Other Race
Place of birth for the foreign-born population - Ireland (%)
Place of birth for the foreign-born population - Denmark (%)
Place of birth for the foreign-born population - Norway (%)
Place of birth for the foreign-born population - Sweden (%)
Place of birth for the foreign-born population - United Kingdom (%)
Place of birth for the foreign-born population - England (%)
Place of birth for the foreign-born population - Scotland (%)
Place of birth for the foreign-born population - Other Northern Europe (%)
Place of birth for the foreign-born population - Austria (%)
Place of birth for the foreign-born population - Belgium (%)
Place of birth for the foreign-born population - France (%)
Place of birth for the foreign-born population - Germany (%)
Place of birth for the foreign-born population - Netherlands (%)
Place of birth for the foreign-born population - Switzerland (%)
Place of birth for the foreign-born population - Other Western Europe (%)
Place of birth for the foreign-born population - Greece (%)
Place of birth for the foreign-born population - Italy (%)
Place of birth for the foreign-born population - Portugal (%)
Place of birth for the foreign-born population - Spain (%)
Place of birth for the foreign-born population - Other Southern Europe (%)
Place of birth for the foreign-born population - Albania (%)
Place of birth for the foreign-born population - Belarus (%)
Place of birth for the foreign-born population - Bosnia and Herzegovina (%)
Place of birth for the foreign-born population - Bulgaria (%)
Place of birth for the foreign-born population - Croatia (%)
Place of birth for the foreign-born population - Czechoslovakia (%)
Place of birth for the foreign-born population - Hungary (%)
Place of birth for the foreign-born population - Latvia (%)
Place of birth for the foreign-born population - Lithuania (%)
Place of birth for the foreign-born population - North Macedonia (Macedonia) (%)
Place of birth for the foreign-born population - Moldova (%)
Place of birth for the foreign-born population - Poland (%)
Place of birth for the foreign-born population - Romania (%)
Place of birth for the foreign-born population - Russia (%)
Place of birth for the foreign-born population - Serbia (%)
Place of birth for the foreign-born population - Ukraine (%)
Place of birth for the foreign-born population - Other Eastern Europe (%)
Place of birth for the foreign-born population - China (%)
Place of birth for the foreign-born population - Hong Kong (%)
Place of birth for the foreign-born population - Taiwan (%)
Place of birth for the foreign-born population - Japan (%)
Place of birth for the foreign-born population - Korea (%)
Place of birth for the foreign-born population - Other Eastern Asia (%)
Place of birth for the foreign-born population - Afghanistan (%)
Place of birth for the foreign-born population - Bangladesh (%)
Place of birth for the foreign-born population - India (%)
Place of birth for the foreign-born population - Iran (%)
Place of birth for the foreign-born population - Kazakhstan (%)
Place of birth for the foreign-born population - Nepal (%)
Place of birth for the foreign-born population - Pakistan (%)
Place of birth for the foreign-born population - Sri Lanka (%)
Place of birth for the foreign-born population - Uzbekistan (%)
Place of birth for the foreign-born population - Other South Central Asia (%)
Place of birth for the foreign-born population - Burma (%)
Place of birth for the foreign-born population - Cambodia (%)
Place of birth for the foreign-born population - Indonesia (%)
Place of birth for the foreign-born population - Laos (%)
Place of birth for the foreign-born population - Malaysia (%)
Place of birth for the foreign-born population - Philippines (%)
Place of birth for the foreign-born population - Singapore (%)
Place of birth for the foreign-born population - Thailand (%)
Place of birth for the foreign-born population - Vietnam (%)
Place of birth for the foreign-born population - Other South Eastern Asia (%)
Place of birth for the foreign-born population - Armenia (%)
Place of birth for the foreign-born population - Iraq (%)
Place of birth for the foreign-born population - Israel (%)
Place of birth for the foreign-born population - Jordan (%)
Place of birth for the foreign-born population - Kuwait (%)
Place of birth for the foreign-born population - Lebanon (%)
Place of birth for the foreign-born population - Saudi Arabia (%)
Place of birth for the foreign-born population - Syria (%)
Place of birth for the foreign-born population - Turkey (%)
Place of birth for the foreign-born population - Yemen (%)
Place of birth for the foreign-born population - Other Western Asia (%)
Place of birth for the foreign-born population - Eritrea (%)
Place of birth for the foreign-born population - Ethiopia (%)
Place of birth for the foreign-born population - Kenya (%)
Place of birth for the foreign-born population - Somalia (%)
Place of birth for the foreign-born population - Uganda (%)
Place of birth for the foreign-born population - Zimbabwe (%)
Place of birth for the foreign-born population - Other Eastern Africa (%)
Place of birth for the foreign-born population - Cameroon (%)
Place of birth for the foreign-born population - Congo (%)
Place of birth for the foreign-born population - Democratic Republic of Congo (Zaire) (%)
Place of birth for the foreign-born population - Other Middle Africa (%)
Place of birth for the foreign-born population - Egypt (%)
Place of birth for the foreign-born population - Morocco (%)
Place of birth for the foreign-born population - Sudan (%)
Place of birth for the foreign-born population - Other Northern Africa (%)
Place of birth for the foreign-born population - South Africa (%)
Place of birth for the foreign-born population - Other Southern Africa (%)
Place of birth for the foreign-born population - Cabo Verde (%)
Place of birth for the foreign-born population - Ghana (%)
Place of birth for the foreign-born population - Liberia (%)
Place of birth for the foreign-born population - Nigeria (%)
Place of birth for the foreign-born population - Senegal (%)
Place of birth for the foreign-born population - Sierra Leone (%)
Place of birth for the foreign-born population - Other Western Africa (%)
Place of birth for the foreign-born population - Australia (%)
Place of birth for the foreign-born population - New Zealand (%)
Place of birth for the foreign-born population - Fiji (%)
Place of birth for the foreign-born population - Micronesia (%)
Place of birth for the foreign-born population - Bahamas (%)
Place of birth for the foreign-born population - Barbados (%)
Place of birth for the foreign-born population - Cuba (%)
Place of birth for the foreign-born population - Dominica (%)
Place of birth for the foreign-born population - Dominican Republic (%)
Place of birth for the foreign-born population - Grenada (%)
Place of birth for the foreign-born population - Haiti (%)
Place of birth for the foreign-born population - Jamaica (%)
Place of birth for the foreign-born population - St. Vincent and the Grenadines (%)
Place of birth for the foreign-born population - Trinidad and Tobago (%)
Place of birth for the foreign-born population - West Indies (%)
Place of birth for the foreign-born population - Other Caribbean (%)
Place of birth for the foreign-born population - Belize (%)
Place of birth for the foreign-born population - Costa Rica (%)
Place of birth for the foreign-born population - El Salvador (%)
Place of birth for the foreign-born population - Guatemala (%)
Place of birth for the foreign-born population - Honduras (%)
Place of birth for the foreign-born population - Mexico (%)
Place of birth for the foreign-born population - Nicaragua (%)
Place of birth for the foreign-born population - Panama (%)
Place of birth for the foreign-born population - Other Central America (%)
Place of birth for the foreign-born population - Argentina (%)
Place of birth for the foreign-born population - Bolivia (%)
Place of birth for the foreign-born population - Brazil (%)
Place of birth for the foreign-born population - Chile (%)
Place of birth for the foreign-born population - Colombia (%)
Place of birth for the foreign-born population - Ecuador (%)
Place of birth for the foreign-born population - Guyana (%)
Place of birth for the foreign-born population - Peru (%)
Place of birth for the foreign-born population - Uruguay (%)
Place of birth for the foreign-born population - Venezuela (%)
Place of birth for the foreign-born population - Other South America (%)
Place of birth for the foreign-born population - Canada (%)
Place of birth for the foreign-born population - Other Northern America (%)
Place of birth for the foreign-born population - Other (%)
Latest news about races in Shawnee, OK collected exclusively by city-data.com from local newspapers, TV, and radio stations
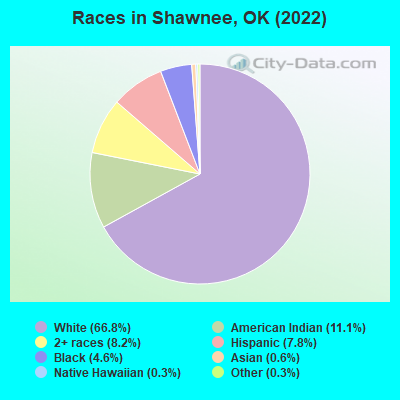
According to 2022 data, the most numerous races in Shawnee, OK are White alone (21,202 residents), Hispanic (2,485 residents), and Two or more races (2,587 residents). 95.4% of Shawnee residents speak English at home. 2.1% of Shawnee, OK residents are foreign-born (0.8% born in Latin America, 0.6% born in Asia, 0.6% born in Europe), which is 181.3% less than the foreign-born rate of 6.0% across the entire state of Oklahoma.
Race distribution in Shawnee
2000 2022
2,556,368 74.1% White alone 266,158 7.7% American Indian alone 257,981 7.5% Black alone 179,304 5.2% Hispanic 140,249 4.1% Two or more races 46,172 1.3% Asian alone 2,322 0.07% Other race alone 2,100 0.06% Native Hawaiian and Other
2,517,403 62.6% White alone 486,692 12.1% Hispanic 364,453 9.1% Two or more races 273,650 6.8% American Indian alone 268,543 6.7% Black alone 92,672 2.3% Asian alone 10,786 0.3% Other race alone 5,601 0.1% Native Hawaiian and Other
Income and house value in Shawnee Median household income in 2022 $46,696 White non-Hispanic householders$31,314 Black householders$41,888 American Indian and Alaska Native householders$66,311 Asian householders$30,486 Some other race householders$32,326 Two or more races householders$51,822 Hispanic or Latino race householdersMedian 2022 house value $159,776 White Non-Hispanic householders$122,651 Black or African American householders$124,576 American Indian or Alaska Native householders $733,432 Asian householders$126,776 Some other race householders$158,951 Two or more races householders$156,751 Hispanic or Latino householders
Median age by race in Shawnee
40.0 Median age for White residents40.4 39.6 19.7 Median age for Black or African American residents19.3 29.6 29.4 Median age for American Indian / Alaska Native residents27.6 30.8 26.4 Median age for Asian residents33.0 19.2 23.5 Median age for Native Hawaiian / Pacific Islander residents23.8 24.5 26.9 Median age for Other race residents29.0 26.1 29.0 Median age for Two or more races residents21.0 31.9 40.8 Median age for White alone residents41.1 40.8 24.6 Median age for Hispanic or Latino residents23.4 25.1
Owner/renter occupied households by race in Shawnee
House owners and renters - White residents 5,283 57.3% Owner occupied3,932 42.7% Renter occupiedHouse owners and renters - Black or African American residents 42 12.1% Owner occupied306 87.9% Renter occupiedHouse owners and renters - American Indian / Alaska Native residents 552 44.6% Owner occupied686 55.4% Renter occupiedHouse owners and renters - Asian residents 45 45.8% Owner occupied54 54.2% Renter occupiedHouse owners and renters - Native Hawaiian / Pacific Islander residents 10 100.0% Renter occupiedHouse owners and renters - Other race residents 92 41.8% Owner occupied128 58.2% Renter occupiedHouse owners and renters - Two or more races residents 617 53.4% Owner occupied539 46.6% Renter occupiedHouse owners and renters - White alone residents 5,160 57.6% Owner occupied3,805 42.4% Renter occupiedHouse owners and renters - Hispanic or Latino residents 352 47.2% Owner occupied395 52.8% Renter occupied
Language usage in Shawnee
English speakers - Total 95.4% of residents of Shawnee speak English at home.
3.2% of residents speak Spanish at home 728 77.2% Speak English very well215 22.8% Speak English less than very well1.3% of residents speak other language at home 276 72.6% Speak English very well104 27.4% Speak English less than very well
English speakers - Born in the United States 95.8% of residents of Shawnee speak English at home.
3.5% of residents speak Spanish at home 309 98.4% Speak English very well5 1.6% Speak English less than very well0.6% of residents speak other language at home 55 100.0% Speak English very well
English speakers - Native, born elsewhere 67.1% of residents of Shawnee speak English at home.
9.2% of residents speak Spanish at home 20 58.8% Speak English very well14 41.2% Speak English less than very well15.6% of residents speak other language at home 58 100.0% Speak English very well
English speakers - Foreign-born 25.1% of residents of Shawnee speak English at home.
45.4% of residents speak Spanish at home 151 38.6% Speak English very well240 61.4% Speak English less than very well26.5% of residents speak other language at home 96 42.1% Speak English very well132 57.9% Speak English less than very well
White (Caucasian) - Speak only English Native:
99.6% (20,380)Foreign-born:
33.3% (123)
White (Caucasian) - Speak another language Native:
0.6% (114)Foreign-born:
65.5% (242)
Black or African American - Speak another language Native:
1.3% (16)Foreign-born:
100.0% (6)
American Indian / Alaska Native - Speak only English Native:
95.8% (3,804)Foreign-born:
93.4% (37)
Asian - Speak only English Native:
68.9% (53)Foreign-born:
47.5% (55)
Asian - Speak another language Native:
31.0% (24)Foreign-born:
50.5% (59)
Native Hawaiian / Pacific Islander - Speak another language Native:
44.1% (20)Foreign-born:
100.0% (26)
Other race - Speak only English Native:
53.2% (144)Foreign-born:
50.6% (72)
Other race - Speak another language Native:
45.7% (124)Foreign-born:
49.6% (70)
Two or more races - Speak only English Native:
91.7% (2,556)Foreign-born:
7.4% (8)
Two or more races - Speak another language Native:
8.5% (238)Foreign-born:
65.0% (71)
White alone - Speak only English Native:
99.4% (19,790)Foreign-born:
45.5% (91)
White alone - Speak another language Native:
0.6% (129)Foreign-born:
54.3% (109)
Hispanic or Latino - Speak only English Native:
59.6% (983)Foreign-born:
6.1% (28)
Hispanic or Latino - Speak another language Native:
34.1% (562)Foreign-born:
85.7% (391)
Foreign-born residents in Shawnee 677 residents are foreign born (0.8% Latin America , 0.6% Asia , 0.6% Europe ).
This city:
2.1%Oklahoma:
6.1%
Marital status for residents in Shawnee Marital status - White (Caucasian) population 15 years and over
Males 28.6% Never married50.2% Now married2.0% Separated3.5% Widowed15.7% DivorcedFemales 28.4% Never married43.6% Now married2.0% Separated11.3% Widowed14.7% DivorcedWomen who gave birth in the past 12 months Now married:
55.8% (146)Unmarried:
44.2% (116)
Women who did not give birth in the past 12 months Now married:
40.4% (2,041)Unmarried:
59.6% (3,011)
Marital status - Black or African American population 15 years and over
Males 61.9% Never married16.6% Now married1.6% Separated1.1% Widowed18.8% DivorcedFemales 59.9% Never married27.4% Now married3.9% Separated3.9% Widowed4.9% DivorcedWomen who gave birth in the past 12 months Now married:
50.0% (21)Unmarried:
50.0% (21)
Women who did not give birth in the past 12 months Now married:
24.8% (69)Unmarried:
75.2% (207)
Marital status - American Indian / Alaska Native population 15 years and over
Males 41.7% Never married34.3% Now married4.5% Separated3.2% Widowed16.3% DivorcedFemales 36.8% Never married33.6% Now married4.6% Separated6.3% Widowed18.7% DivorcedWomen who gave birth in the past 12 months Now married:
34.1% (10)Unmarried:
65.9% (20)
Women who did not give birth in the past 12 months Now married:
35.0% (270)Unmarried:
65.0% (501)
Marital status - Asian population 15 years and over
Males 61.5% Never married33.3% Now married0.0% Separated0.0% Widowed5.2% DivorcedFemales 75.0% Never married15.2% Now married0.0% Separated0.0% Widowed9.8% DivorcedWomen who did not give birth in the past 12 months Now married:
0.0% (0)Unmarried:
100.0% (69)
Marital status - Native Hawaiian / Pacific Islander population 15 years and over
Males 50.0% Never married50.0% Now married0.0% Separated0.0% Widowed0.0% DivorcedFemales 65.5% Never married34.5% Now married0.0% Separated0.0% Widowed0.0% DivorcedWomen who did not give birth in the past 12 months Now married:
34.5% (12)Unmarried:
65.5% (22)
Marital status - Other race population 15 years and over
Males 58.2% Never married30.6% Now married0.0% Separated0.0% Widowed11.2% DivorcedFemales 37.9% Never married34.8% Now married0.0% Separated7.6% Widowed19.7% DivorcedWomen who gave birth in the past 12 months Now married:
100.0% (12)Unmarried:
0.0% (0)
Women who did not give birth in the past 12 months Now married:
41.9% (42)Unmarried:
58.1% (58)
Marital status - Two or more races population 15 years and over
Males 44.5% Never married41.4% Now married1.3% Separated0.0% Widowed12.7% DivorcedFemales 43.2% Never married32.5% Now married0.0% Separated8.1% Widowed16.2% DivorcedWomen who gave birth in the past 12 months Now married:
76.9% (51)Unmarried:
23.1% (15)
Women who did not give birth in the past 12 months Now married:
32.8% (323)Unmarried:
67.2% (661)
Marital status - White alone, not Hispanic / Latino population 15 years and over
Males 28.7% Never married50.3% Now married2.1% Separated3.6% Widowed15.3% DivorcedFemales 27.3% Never married44.0% Now married2.0% Separated11.6% Widowed15.1% DivorcedWomen who gave birth in the past 12 months Now married:
54.4% (140)Unmarried:
45.6% (117)
Women who did not give birth in the past 12 months Now married:
41.0% (1,976)Unmarried:
59.0% (2,845)
Marital status - Hispanic or Latino population 15 years and over
Males 39.2% Never married35.6% Now married2.5% Separated2.0% Widowed20.7% DivorcedFemales 46.7% Never married38.5% Now married0.8% Separated4.6% Widowed9.3% DivorcedWomen who gave birth in the past 12 months Now married:
72.7% (26)Unmarried:
27.3% (10)
Women who did not give birth in the past 12 months Now married:
38.3% (244)Unmarried:
61.7% (393)
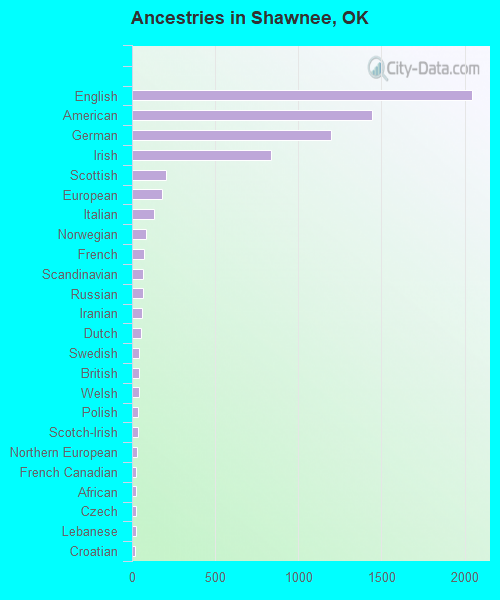
Ancestries in Shawnee
2,045 15.9% English1,444 11.2% American1,194 9.3% German836 6.5% Irish205 1.6% Scottish179 1.4% European135 1.0% Italian83 0.6% Norwegian75 0.6% French66 0.5% Scandinavian66 0.5% Russian60 0.5% Iranian55 0.4% Dutch45 0.3% Swedish40 0.3% British40 0.3% Welsh39 0.3% Polish37 0.3% Scotch-Irish31 0.2% Northern European25 0.2% French Canadian25 0.2% African24 0.2% Czech23 0.2% Lebanese20 0.2% Croatian18 0.1% Slavic17 0.1% Yugoslavian14 0.1% Danish13 0.1% Czechoslovakian12 0.09% Egyptian10 0.08% Portuguese8 0.06% Eastern European7 0.05% Austrian4 0.03% Latvian1 0.01% Hungarian
Geographical mobility in Shawnee Same house 1 year ago 17,440 80.1% White (Caucasian)1,122 78.5% Black or African American3,505 93.9% American Indian / Alaska Native143 74.4% Asian34 42.3% Native Hawaiian / Pacific Islander321 73.8% Other race2,889 85.6% Two or more races16,807 80.0% White alone, not Hispanic / Latino1,983 82.4% Hispanic or LatinoMoved within same county 1,699 7.8% White / Caucasian73 5.1% Black or African American131 3.5% American Indian / Alaska Native9 4.6% Asian32 7.3% Other race205 6.1% Two or more races1,643 7.8% White alone, not Hispanic / Latino204 8.5% Hispanic or LatinoMoved within same state 1,145 5.3% White / Caucasian100 7.0% Black or African American79 2.1% American Indian / Alaska Native51 62.9% Native Hawaiian / Pacific Islander57 13.0% Other race149 4.4% Two or more races1,148 5.5% White alone, not Hispanic / Latino118 4.9% Hispanic or LatinoMoved from different state 1,545 7.1% White / Caucasian145 10.1% Black or African American48 1.3% American Indian / Alaska Native34 17.7% Asian13 3.0% Other race85 2.5% Two or more races1,484 7.1% White alone, not Hispanic / Latino112 4.6% Hispanic or LatinoMoved from abroad 29 0.1% White21 1.5% Black or African American11 5.9% Asian27 0.8% Two or more races23 0.1% White alone, not Hispanic / Latino6 0.2% Hispanic or Latino
Children Nativity (place of birth) in Shawnee
Children under 6 years - Living with two parents Both parents native 1,314 100.0% NativeBoth parents foreign-born 15 100.0% NativeOne native, one foreign-born parent 25 100.0% NativeChildren under 6 years - Living with one parent Native parent 939 100.0% NativeForeign-born parent 19 100.0% NativeChildren 6 to 17 years - Living with two parents Both parents native 2,672 99.2% Native22 0.8% Foreign-bornBoth parents foreign-born 73 86.3% Native12 13.7% Foreign-bornOne native, one foreign-born parent 54 66.7% Native27 33.3% Foreign-bornChildren 6 to 17 years - Living with one parent Native parent 1,693 100.0% Native
Grandparents responsible for own grandchildren in Shawnee
Grandparents (30 to 59 years) White / Caucasian 80 34.1% Responsible for grandchildren155 65.9% Not responsible for grandchildrenBlack or African American 15 100.0% Responsible for grandchildrenAmerican Indian / Alaska Native 26 89.7% Responsible for grandchildren3 10.3% Not responsible for grandchildrenTwo or more races 37 100.0% Responsible for grandchildrenWhite alone, not Hispanic / Latino 80 34.1% Responsible for grandchildren155 65.9% Not responsible for grandchildrenHispanic or Latino 6 100.0% Responsible for grandchildrenGrandparents (60 years and over) White / Caucasian 46 45.5% Responsible for grandchildren55 54.5% Not responsible for grandchildrenBlack or African American 8 100.0% Responsible for grandchildrenAmerican Indian / Alaska Native 19 77.1% Responsible for grandchildren6 22.9% Not responsible for grandchildrenWhite alone, not Hispanic / Latino 46 45.5% Responsible for grandchildren55 54.5% Not responsible for grandchildren