Races in Shakopee, Minnesota (MN) Detailed Stats
Data:
Races - White alone (%)
Races - White alone (% change since 2000)
Races - Black alone (%)
Races - Black alone (% change since 2000)
Races - American Indian alone (%)
Races - American Indian alone (% change since 2000)
Races - Asian alone (%)
Races - Asian alone (% change since 2000)
Races - Hispanic (%)
Races - Hispanic (% change since 2000)
Races - Native Hawaiian and Other Pacific Islander alone (%)
Races - Native Hawaiian and Other Pacific Islander alone (% change since 2000)
Races - Two or more races(%)
Races - Two or more races(% change since 2000)
Races - Other race alone (%)
Races - Other race alone (% change since 2000)
Racial diversity
Place of birth - Born in state of residence (%)
Place of birth - Born in state of residence (%) - White
Place of birth - Born in state of residence (%) - Black or African American
Place of birth - Born in state of residence (%) - Asian
Place of birth - Born in state of residence (%) - Hispanic or Latino
Place of birth - Born in state of residence (%) - American Indian and Alaska Native
Place of birth - Born in state of residence (%) - Multirace
Place of birth - Born in state of residence (%) - Other Race
Place of birth - Born in other state (%)
Place of birth - Born in other state (%) - White
Place of birth - Born in other state (%) - Black or African American
Place of birth - Born in other state (%) - Asian
Place of birth - Born in other state (%) - Hispanic or Latino
Place of birth - Born in other state (%) - American Indian and Alaska Native
Place of birth - Born in other state (%) - Multirace
Place of birth - Born in other state (%) - Other Race
Place of birth - Native, outside of US (%)
Place of birth - Native, outside of US (%) - White
Place of birth - Native, outside of US (%) - Black or African American
Place of birth - Native, outside of US (%) - Asian
Place of birth - Native, outside of US (%) - Hispanic or Latino
Place of birth - Native, outside of US (%) - American Indian and Alaska Native
Place of birth - Native, outside of US (%) - Multirace
Place of birth - Native, outside of US (%) - Other Race
Place of birth - Foreign born (%)
Place of birth - Foreign born (%) - White
Place of birth - Foreign born (%) - Black or African American
Place of birth - Foreign born (%) - Asian
Place of birth - Foreign born (%) - Hispanic or Latino
Place of birth - Foreign born (%) - American Indian and Alaska Native
Place of birth - Foreign born (%) - Multirace
Place of birth - Foreign born (%) - Other Race
Residents speaking English at home (%)
Residents speaking English at home - Born in the United States (%)
Residents speaking English at home - Native, born elsewhere (%)
Residents speaking English at home - Foreign born (%)
Residents speaking Spanish at home (%)
Residents speaking Spanish at home - Born in the United States (%)
Residents speaking Spanish at home - Native, born elsewhere (%)
Residents speaking Spanish at home - Foreign born (%)
Residents speaking other language at home (%)
Residents speaking other language at home - Born in the United States (%)
Residents speaking other language at home - Native, born elsewhere (%)
Residents speaking other language at home - Foreign born (%)
Marital status - Never married (%)
Marital status - Now married (%)
Marital status - Separated (%)
Marital status - Widowed (%)
Marital status - Divorced (%)
Ancestries Reported - Arab (%)
Ancestries Reported - Czech (%)
Ancestries Reported - Danish (%)
Ancestries Reported - Dutch (%)
Ancestries Reported - English (%)
Ancestries Reported - French (%)
Ancestries Reported - French Canadian (%)
Ancestries Reported - German (%)
Ancestries Reported - Greek (%)
Ancestries Reported - Hungarian (%)
Ancestries Reported - Irish (%)
Ancestries Reported - Italian (%)
Ancestries Reported - Lithuanian (%)
Ancestries Reported - Norwegian (%)
Ancestries Reported - Polish (%)
Ancestries Reported - Portuguese (%)
Ancestries Reported - Russian (%)
Ancestries Reported - Scotch-Irish (%)
Ancestries Reported - Scottish (%)
Ancestries Reported - Slovak (%)
Ancestries Reported - Subsaharan African (%)
Ancestries Reported - Swedish (%)
Ancestries Reported - Swiss (%)
Ancestries Reported - Ukrainian (%)
Ancestries Reported - United States (%)
Ancestries Reported - Welsh (%)
Ancestries Reported - West Indian (%)
Ancestries Reported - Other (%)
Geographical mobility - Same house 1 year ago (%)
Geographical mobility - Same house 1 year ago (%) - White
Geographical mobility - Same house 1 year ago (%) - Black or African American
Geographical mobility - Same house 1 year ago (%) - Asian
Geographical mobility - Same house 1 year ago (%) - Hispanic or Latino
Geographical mobility - Same house 1 year ago (%) - American Indian and Alaska Native
Geographical mobility - Same house 1 year ago (%) - Multirace
Geographical mobility - Same house 1 year ago (%) - Other Race
Geographical mobility - Moved within same county (%)
Geographical mobility - Moved within same county (%) - White
Geographical mobility - Moved within same county (%) - Black or African American
Geographical mobility - Moved within same county (%) - Asian
Geographical mobility - Moved within same county (%) - Hispanic or Latino
Geographical mobility - Moved within same county (%) - American Indian and Alaska Native
Geographical mobility - Moved within same county (%) - Multirace
Geographical mobility - Moved within same county (%) - Other Race
Geographical mobility - Moved from different county within same state (%)
Geographical mobility - Moved from different county within same state (%) - White
Geographical mobility - Moved from different county within same state (%) - Black or African American
Geographical mobility - Moved from different county within same state (%) - Asian
Geographical mobility - Moved from different county within same state (%) - Hispanic or Latino
Geographical mobility - Moved from different county within same state (%) - American Indian and Alaska Native
Geographical mobility - Moved from different county within same state (%) - Multirace
Geographical mobility - Moved from different county within same state (%) - Other Race
Geographical mobility - Moved from different state (%)
Geographical mobility - Moved from different state (%) - White
Geographical mobility - Moved from different state (%) - Black or African American
Geographical mobility - Moved from different state (%) - Asian
Geographical mobility - Moved from different state (%) - Hispanic or Latino
Geographical mobility - Moved from different state (%) - American Indian and Alaska Native
Geographical mobility - Moved from different state (%) - Multirace
Geographical mobility - Moved from different state (%) - Other Race
Geographical mobility - Moved from abroad (%)
Geographical mobility - Moved from abroad (%) - White
Geographical mobility - Moved from abroad (%) - Black or African American
Geographical mobility - Moved from abroad (%) - Asian
Geographical mobility - Moved from abroad (%) - Hispanic or Latino
Geographical mobility - Moved from abroad (%) - American Indian and Alaska Native
Geographical mobility - Moved from abroad (%) - Multirace
Geographical mobility - Moved from abroad (%) - Other Race
Place of birth for the foreign-born population - Ireland (%)
Place of birth for the foreign-born population - Denmark (%)
Place of birth for the foreign-born population - Norway (%)
Place of birth for the foreign-born population - Sweden (%)
Place of birth for the foreign-born population - United Kingdom (%)
Place of birth for the foreign-born population - England (%)
Place of birth for the foreign-born population - Scotland (%)
Place of birth for the foreign-born population - Other Northern Europe (%)
Place of birth for the foreign-born population - Austria (%)
Place of birth for the foreign-born population - Belgium (%)
Place of birth for the foreign-born population - France (%)
Place of birth for the foreign-born population - Germany (%)
Place of birth for the foreign-born population - Netherlands (%)
Place of birth for the foreign-born population - Switzerland (%)
Place of birth for the foreign-born population - Other Western Europe (%)
Place of birth for the foreign-born population - Greece (%)
Place of birth for the foreign-born population - Italy (%)
Place of birth for the foreign-born population - Portugal (%)
Place of birth for the foreign-born population - Spain (%)
Place of birth for the foreign-born population - Other Southern Europe (%)
Place of birth for the foreign-born population - Albania (%)
Place of birth for the foreign-born population - Belarus (%)
Place of birth for the foreign-born population - Bosnia and Herzegovina (%)
Place of birth for the foreign-born population - Bulgaria (%)
Place of birth for the foreign-born population - Croatia (%)
Place of birth for the foreign-born population - Czechoslovakia (%)
Place of birth for the foreign-born population - Hungary (%)
Place of birth for the foreign-born population - Latvia (%)
Place of birth for the foreign-born population - Lithuania (%)
Place of birth for the foreign-born population - North Macedonia (Macedonia) (%)
Place of birth for the foreign-born population - Moldova (%)
Place of birth for the foreign-born population - Poland (%)
Place of birth for the foreign-born population - Romania (%)
Place of birth for the foreign-born population - Russia (%)
Place of birth for the foreign-born population - Serbia (%)
Place of birth for the foreign-born population - Ukraine (%)
Place of birth for the foreign-born population - Other Eastern Europe (%)
Place of birth for the foreign-born population - China (%)
Place of birth for the foreign-born population - Hong Kong (%)
Place of birth for the foreign-born population - Taiwan (%)
Place of birth for the foreign-born population - Japan (%)
Place of birth for the foreign-born population - Korea (%)
Place of birth for the foreign-born population - Other Eastern Asia (%)
Place of birth for the foreign-born population - Afghanistan (%)
Place of birth for the foreign-born population - Bangladesh (%)
Place of birth for the foreign-born population - India (%)
Place of birth for the foreign-born population - Iran (%)
Place of birth for the foreign-born population - Kazakhstan (%)
Place of birth for the foreign-born population - Nepal (%)
Place of birth for the foreign-born population - Pakistan (%)
Place of birth for the foreign-born population - Sri Lanka (%)
Place of birth for the foreign-born population - Uzbekistan (%)
Place of birth for the foreign-born population - Other South Central Asia (%)
Place of birth for the foreign-born population - Burma (%)
Place of birth for the foreign-born population - Cambodia (%)
Place of birth for the foreign-born population - Indonesia (%)
Place of birth for the foreign-born population - Laos (%)
Place of birth for the foreign-born population - Malaysia (%)
Place of birth for the foreign-born population - Philippines (%)
Place of birth for the foreign-born population - Singapore (%)
Place of birth for the foreign-born population - Thailand (%)
Place of birth for the foreign-born population - Vietnam (%)
Place of birth for the foreign-born population - Other South Eastern Asia (%)
Place of birth for the foreign-born population - Armenia (%)
Place of birth for the foreign-born population - Iraq (%)
Place of birth for the foreign-born population - Israel (%)
Place of birth for the foreign-born population - Jordan (%)
Place of birth for the foreign-born population - Kuwait (%)
Place of birth for the foreign-born population - Lebanon (%)
Place of birth for the foreign-born population - Saudi Arabia (%)
Place of birth for the foreign-born population - Syria (%)
Place of birth for the foreign-born population - Turkey (%)
Place of birth for the foreign-born population - Yemen (%)
Place of birth for the foreign-born population - Other Western Asia (%)
Place of birth for the foreign-born population - Eritrea (%)
Place of birth for the foreign-born population - Ethiopia (%)
Place of birth for the foreign-born population - Kenya (%)
Place of birth for the foreign-born population - Somalia (%)
Place of birth for the foreign-born population - Uganda (%)
Place of birth for the foreign-born population - Zimbabwe (%)
Place of birth for the foreign-born population - Other Eastern Africa (%)
Place of birth for the foreign-born population - Cameroon (%)
Place of birth for the foreign-born population - Congo (%)
Place of birth for the foreign-born population - Democratic Republic of Congo (Zaire) (%)
Place of birth for the foreign-born population - Other Middle Africa (%)
Place of birth for the foreign-born population - Egypt (%)
Place of birth for the foreign-born population - Morocco (%)
Place of birth for the foreign-born population - Sudan (%)
Place of birth for the foreign-born population - Other Northern Africa (%)
Place of birth for the foreign-born population - South Africa (%)
Place of birth for the foreign-born population - Other Southern Africa (%)
Place of birth for the foreign-born population - Cabo Verde (%)
Place of birth for the foreign-born population - Ghana (%)
Place of birth for the foreign-born population - Liberia (%)
Place of birth for the foreign-born population - Nigeria (%)
Place of birth for the foreign-born population - Senegal (%)
Place of birth for the foreign-born population - Sierra Leone (%)
Place of birth for the foreign-born population - Other Western Africa (%)
Place of birth for the foreign-born population - Australia (%)
Place of birth for the foreign-born population - New Zealand (%)
Place of birth for the foreign-born population - Fiji (%)
Place of birth for the foreign-born population - Micronesia (%)
Place of birth for the foreign-born population - Bahamas (%)
Place of birth for the foreign-born population - Barbados (%)
Place of birth for the foreign-born population - Cuba (%)
Place of birth for the foreign-born population - Dominica (%)
Place of birth for the foreign-born population - Dominican Republic (%)
Place of birth for the foreign-born population - Grenada (%)
Place of birth for the foreign-born population - Haiti (%)
Place of birth for the foreign-born population - Jamaica (%)
Place of birth for the foreign-born population - St. Vincent and the Grenadines (%)
Place of birth for the foreign-born population - Trinidad and Tobago (%)
Place of birth for the foreign-born population - West Indies (%)
Place of birth for the foreign-born population - Other Caribbean (%)
Place of birth for the foreign-born population - Belize (%)
Place of birth for the foreign-born population - Costa Rica (%)
Place of birth for the foreign-born population - El Salvador (%)
Place of birth for the foreign-born population - Guatemala (%)
Place of birth for the foreign-born population - Honduras (%)
Place of birth for the foreign-born population - Mexico (%)
Place of birth for the foreign-born population - Nicaragua (%)
Place of birth for the foreign-born population - Panama (%)
Place of birth for the foreign-born population - Other Central America (%)
Place of birth for the foreign-born population - Argentina (%)
Place of birth for the foreign-born population - Bolivia (%)
Place of birth for the foreign-born population - Brazil (%)
Place of birth for the foreign-born population - Chile (%)
Place of birth for the foreign-born population - Colombia (%)
Place of birth for the foreign-born population - Ecuador (%)
Place of birth for the foreign-born population - Guyana (%)
Place of birth for the foreign-born population - Peru (%)
Place of birth for the foreign-born population - Uruguay (%)
Place of birth for the foreign-born population - Venezuela (%)
Place of birth for the foreign-born population - Other South America (%)
Place of birth for the foreign-born population - Canada (%)
Place of birth for the foreign-born population - Other Northern America (%)
Place of birth for the foreign-born population - Other (%)
Latest news about races in Shakopee, MN collected exclusively by city-data.com from local newspapers, TV, and radio stations
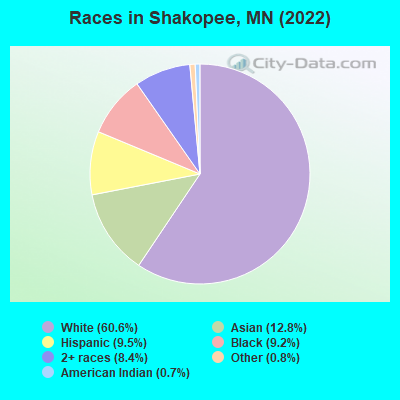
According to 2022 data, the most numerous races in Shakopee, MN are White alone (27,317 residents), Black alone (4,134 residents), and Hispanic (4,302 residents). 76.5% of Shakopee residents speak English at home. 18.4% of Shakopee, MN residents are foreign-born (6.9% born in Asia, 4.2% born in Latin America, 4.1% born in Africa, 2.9% born in Europe), which is 56.5% greater than the foreign-born rate of 8.0% across the entire state of Minnesota.
Race distribution in Shakopee
2000 2022
4,337,143 88.2% White alone 168,813 3.4% Black alone 143,382 2.9% Hispanic 141,083 2.9% Asian alone 70,304 1.4% Two or more races 52,009 1.1% American Indian alone 5,031 0.1% Other race alone 1,714 0.03% Native Hawaiian and Other
4,356,347 76.2% White alone 395,179 6.9% Black alone 333,830 5.8% Hispanic 294,800 5.2% Asian alone 259,649 4.5% Two or more races 42,125 0.7% American Indian alone 32,976 0.6% Other race alone 2,278 0.04% Native Hawaiian and Other
Income and house value in Shakopee Median household income in 2022 $95,843 White non-Hispanic householders$78,148 Black householdersover $200,000 American Indian and Alaska Native householders$128,854 Asian householders$150,850 Some other race householders$158,014 Two or more races householders$121,006 Hispanic or Latino race householdersMedian 2022 house value $365,049 White Non-Hispanic householders$233,175 Black or African American householders$356,240 American Indian or Alaska Native householders $478,787 Asian householders$413,497 Some other race householders$347,690 Two or more races householders$416,865 Hispanic or Latino householders
Median age by race in Shakopee
39.5 Median age for White residents40.0 39.0 27.5 Median age for Black or African American residents21.1 25.2 38.0 Median age for American Indian / Alaska Native residents26.1 43.6 34.0 Median age for Asian residents37.2 32.9 46.9 Median age for Native Hawaiian / Pacific Islander residents-856,799,036.4 33.7 30.0 Median age for Other race residents26.8 43.1 16.9 Median age for Two or more races residents17.7 15.9 40.1 Median age for White alone residents40.6 39.8 25.1 Median age for Hispanic or Latino residents21.2 30.0
Owner/renter occupied households by race in Shakopee
House owners and renters - White residents 8,819 74.8% Owner occupied2,972 25.2% Renter occupiedHouse owners and renters - Black or African American residents 607 51.3% Owner occupied576 48.7% Renter occupiedHouse owners and renters - American Indian / Alaska Native residents 108 100.0% Owner occupiedHouse owners and renters - Asian residents 1,328 86.6% Owner occupied205 13.4% Renter occupiedHouse owners and renters - Native Hawaiian / Pacific Islander residents 10 100.0% Owner occupiedHouse owners and renters - Other race residents 398 68.7% Owner occupied181 31.3% Renter occupiedHouse owners and renters - Two or more races residents 696 88.1% Owner occupied94 11.9% Renter occupiedHouse owners and renters - White alone residents 8,543 74.6% Owner occupied2,914 25.4% Renter occupiedHouse owners and renters - Hispanic or Latino residents 708 77.9% Owner occupied201 22.1% Renter occupied
Language usage in Shakopee
English speakers - Total 76.5% of residents of Shakopee speak English at home.
5.1% of residents speak Spanish at home 1,309 61.1% Speak English very well832 38.9% Speak English less than very well19.0% of residents speak other language at home 4,567 57.0% Speak English very well3,445 43.0% Speak English less than very well
English speakers - Born in the United States 93.5% of residents of Shakopee speak English at home.
3.2% of residents speak Spanish at home 211 91.7% Speak English very well19 8.3% Speak English less than very well2.6% of residents speak other language at home 117 63.6% Speak English very well67 36.4% Speak English less than very well
English speakers - Native, born elsewhere 33.0% of residents of Shakopee speak English at home.
4.2% of residents speak Spanish at home 21 100.0% Speak English very well35.0% of residents speak other language at home 138 78.9% Speak English very well37 21.1% Speak English less than very well
English speakers - Foreign-born 11.8% of residents of Shakopee speak English at home.
15.2% of residents speak Spanish at home 387 30.4% Speak English very well885 69.6% Speak English less than very well73.8% of residents speak other language at home 2,992 48.4% Speak English very well3,187 51.6% Speak English less than very well
White (Caucasian) - Speak only English Native:
97.6% (24,697)Foreign-born:
12.0% (166)
White (Caucasian) - Speak another language Native:
2.4% (601)Foreign-born:
75.5% (1,048)
Black or African American - Speak only English Native:
75.2% (1,133)Foreign-born:
16.5% (349)
Black or African American - Speak another language Native:
24.8% (373)Foreign-born:
83.6% (1,774)
American Indian / Alaska Native - Speak only English Native:
83.4% (265)Foreign-born:
41.9% (91)
American Indian / Alaska Native - Speak another language Native:
16.5% (53)Foreign-born:
39.8% (86)
Asian - Speak only English Native:
50.3% (859)Foreign-born:
8.7% (328)
Asian - Speak another language Native:
49.0% (836)Foreign-born:
92.9% (3,517)
Other race - Speak only English Native:
63.9% (699)Foreign-born:
15.5% (120)
Other race - Speak another language Native:
34.0% (372)Foreign-born:
100.0% (772)
Two or more races - Speak only English Native:
91.6% (3,638)Foreign-born:
2.5% (4)
Two or more races - Speak another language Native:
8.6% (341)Foreign-born:
100.0% (153)
White alone - Speak only English Native:
98.5% (24,288)Foreign-born:
14.5% (173)
White alone - Speak another language Native:
1.5% (369)Foreign-born:
76.0% (911)
Hispanic or Latino - Speak only English Native:
64.4% (1,640)Foreign-born:
11.2% (136)
Hispanic or Latino - Speak another language Native:
35.0% (889)Foreign-born:
100.0% (1,213)
Foreign-born residents in Shakopee 8,287 residents are foreign born (6.9% Asia , 4.2% Latin America , 4.1% Africa , 2.9% Europe ).
This city:
18.4%Minnesota:
8.5%
Marital status for residents in Shakopee Marital status - White (Caucasian) population 15 years and over
Males 31.2% Never married53.4% Now married0.1% Separated1.6% Widowed13.6% DivorcedFemales 29.5% Never married48.3% Now married0.7% Separated6.5% Widowed15.1% DivorcedWomen who gave birth in the past 12 months Now married:
87.5% (311)Unmarried:
12.5% (44)
Women who did not give birth in the past 12 months Now married:
43.7% (3,138)Unmarried:
56.3% (4,044)
Marital status - Black or African American population 15 years and over
Males 29.0% Never married50.3% Now married3.1% Separated0.0% Widowed17.6% DivorcedFemales 43.1% Never married27.6% Now married8.3% Separated5.5% Widowed15.5% DivorcedWomen who gave birth in the past 12 months Now married:
83.3% (41)Unmarried:
16.7% (8)
Women who did not give birth in the past 12 months Now married:
36.8% (465)Unmarried:
63.2% (799)
Marital status - American Indian / Alaska Native population 15 years and over
Males 80.7% Never married19.3% Now married0.0% Separated0.0% Widowed0.0% DivorcedFemales 60.2% Never married15.2% Now married2.5% Separated11.9% Widowed10.2% DivorcedWomen who gave birth in the past 12 months Now married:
0.0% (0)Unmarried:
100.0% (3)
Women who did not give birth in the past 12 months Now married:
19.1% (42)Unmarried:
80.9% (176)
Marital status - Asian population 15 years and over
Males 44.6% Never married52.1% Now married0.0% Separated2.2% Widowed1.1% DivorcedFemales 42.4% Never married39.8% Now married7.3% Separated2.4% Widowed8.1% DivorcedWomen who gave birth in the past 12 months Now married:
81.8% (30)Unmarried:
18.2% (7)
Women who did not give birth in the past 12 months Now married:
35.5% (663)Unmarried:
64.5% (1,203)
Marital status - Other race population 15 years and over
Males 48.8% Never married45.2% Now married5.2% Separated0.0% Widowed0.8% DivorcedFemales 21.3% Never married74.1% Now married0.0% Separated1.4% Widowed3.2% DivorcedWomen who gave birth in the past 12 months Now married:
100.0% (158)Unmarried:
0.0% (0)
Women who did not give birth in the past 12 months Now married:
68.6% (321)Unmarried:
31.4% (147)
Marital status - Two or more races population 15 years and over
Males 56.9% Never married40.5% Now married0.0% Separated0.0% Widowed2.6% DivorcedFemales 44.4% Never married30.0% Now married0.0% Separated1.2% Widowed24.4% DivorcedWomen who gave birth in the past 12 months Now married:
100.0% (33)Unmarried:
0.0% (0)
Women who did not give birth in the past 12 months Now married:
21.6% (269)Unmarried:
78.4% (980)
Marital status - White alone, not Hispanic / Latino population 15 years and over
Males 29.8% Never married54.4% Now married0.1% Separated1.7% Widowed14.0% DivorcedFemales 28.5% Never married48.4% Now married0.7% Separated6.7% Widowed15.7% DivorcedWomen who gave birth in the past 12 months Now married:
85.5% (262)Unmarried:
14.5% (44)
Women who did not give birth in the past 12 months Now married:
44.0% (2,977)Unmarried:
56.0% (3,783)
Marital status - Hispanic or Latino population 15 years and over
Males 52.1% Never married41.3% Now married2.8% Separated0.0% Widowed3.7% DivorcedFemales 37.9% Never married56.4% Now married0.0% Separated3.4% Widowed2.3% DivorcedWomen who gave birth in the past 12 months Now married:
100.0% (165)Unmarried:
0.0% (0)
Women who did not give birth in the past 12 months Now married:
50.3% (490)Unmarried:
49.7% (485)
Ancestries in Shakopee
4,654 21.8% German1,459 6.8% Somali1,233 5.8% Scandinavian808 3.8% Norwegian707 3.3% Irish569 2.7% American550 2.6% Ethiopian531 2.5% Italian503 2.4% European443 2.1% English418 2.0% Russian412 1.9% Polish333 1.6% Swedish189 0.9% Finnish187 0.9% Guyanese179 0.8% Ukrainian119 0.6% Czech109 0.5% African91 0.4% Dutch86 0.4% Eastern European58 0.3% Trinidadian and Tobagonian55 0.3% Scottish48 0.2% Ghanaian47 0.2% Danish43 0.2% French Canadian35 0.2% Northern European34 0.2% Portuguese27 0.1% Scotch-Irish25 0.1% Czechoslovakian23 0.1% Israeli23 0.1% French20 0.09% Latvian20 0.09% Slovak18 0.08% German Russian12 0.06% Pennsylvania German12 0.06% Kenyan11 0.05% Hungarian10 0.05% Belgian8 0.04% Romanian5 0.02% Canadian4 0.02% Armenian4 0.02% Swiss
Geographical mobility in Shakopee Same house 1 year ago 25,662 90.9% White (Caucasian)3,092 81.9% Black or African American434 89.3% American Indian / Alaska Native4,983 89.5% Asian6 50.5% Native Hawaiian / Pacific Islander2,290 99.2% Other race3,712 84.2% Two or more races24,650 91.0% White alone, not Hispanic / Latino3,464 89.0% Hispanic or LatinoMoved within same county 607 2.2% White / Caucasian63 1.7% Black or African American6 1.2% American Indian / Alaska Native78 1.4% Asian10 0.4% Other race12 0.3% Two or more races588 2.2% White alone, not Hispanic / Latino74 1.9% Hispanic or LatinoMoved within same state 1,544 5.5% White / Caucasian463 12.3% Black or African American52 10.7% American Indian / Alaska Native450 8.1% Asian7 52.4% Native Hawaiian / Pacific Islander30 1.3% Other race489 11.1% Two or more races1,517 5.6% White alone, not Hispanic / Latino165 4.2% Hispanic or LatinoMoved from different state 181 0.6% White / Caucasian131 3.5% Black or African American4 0.7% American Indian / Alaska Native55 1.0% Asian210 4.8% Two or more races183 0.7% White alone, not Hispanic / LatinoMoved from abroad 116 0.4% White4 0.1% Black or African American40 0.7% Asian30 1.3% Other race33 0.1% White alone, not Hispanic / Latino232 6.0% Hispanic or Latino
Children Nativity (place of birth) in Shakopee
Children under 6 years - Living with two parents Both parents native 1,320 100.0% NativeBoth parents foreign-born 833 100.0% NativeOne native, one foreign-born parent 199 100.0% NativeChildren under 6 years - Living with one parent Native parent 553 100.0% NativeForeign-born parent 540 90.8% Native54 9.2% Foreign-bornChildren 6 to 17 years - Living with two parents Both parents native 2,461 98.6% Native35 1.4% Foreign-bornBoth parents foreign-born 802 82.7% Native167 17.3% Foreign-bornOne native, one foreign-born parent 1,171 100.0% NativeChildren 6 to 17 years - Living with one parent Native parent 2,439 100.0% NativeForeign-born parent 588 54.0% Native502 46.0% Foreign-born
Place of birth for residents in Shakopee 3,154 Asia1,956 Americas1,932 Latin America1,866 South Eastern Asia1,855 Africa1,761 Eastern Africa1,706 Central America1,320 Europe1,123 Eastern Europe798 South Central Asia237 Eastern Asia221 China151 South America126 Northern Europe82 Western Africa74 Caribbean71 Western Europe23 Northern America11 Middle Africa3 Western Asia1,248 Vietnam1,131 Mexico881 Somalia742 India613 Ethiopia491 Guatemala404 Russia366 Cambodia317 Ukraine307 Poland221 China151 Guyana105 Kenya91 Indonesia89 United Kingdom82 Ghana74 Trinidad and Tobago73 Philippines68 Germany55 Uzbekistan51 El Salvador48 Thailand43 Moldova41 Eritrea38 Laos32 Latvia32 Honduras25 Denmark23 Uganda23 Canada17 Czechoslovakia15 Japan11 England11 Cameroon3 Armenia3 Switzerland
Grandparents responsible for own grandchildren in Shakopee
Grandparents (30 to 59 years) White / Caucasian 70 47.3% Responsible for grandchildren79 52.7% Not responsible for grandchildrenBlack or African American 79 100.0% Not responsible for grandchildrenAsian 104 100.0% Not responsible for grandchildrenTwo or more races 35 100.0% Responsible for grandchildrenWhite alone, not Hispanic / Latino 70 47.3% Responsible for grandchildren79 52.7% Not responsible for grandchildrenHispanic or Latino 32 100.0% Responsible for grandchildrenGrandparents (60 years and over) White / Caucasian 112 74.7% Responsible for grandchildren38 25.3% Not responsible for grandchildrenBlack or African American 11 42.5% Responsible for grandchildren15 57.5% Not responsible for grandchildrenAsian 66 45.1% Responsible for grandchildren81 54.9% Not responsible for grandchildrenWhite alone, not Hispanic / Latino 112 74.2% Responsible for grandchildren39 25.8% Not responsible for grandchildrenHispanic or Latino 11 100.0% Not responsible for grandchildren