Races in Sequim, Washington (WA) Detailed Stats
Ancestries, Foreign-born residents, place of birth
Settings
X


Recent posts about races in Sequim, Washington on our local forum with over 2,400,000 registered users:
 | The new Sequim (129 replies) |
| Sequim house hunting (23 replies) |
| Oh Sequim, Why? (89 replies) |
| We just spent a week in Sequim (66 replies) |
| Can a down-to-earth, yoga-loving & nature-loving conservative woman feel at home in Sequim or Port Townsend, WA? (37 replies) |
| I'm Torn Between Sequim and Spokane (54 replies) |
Latest news about races in Sequim, WA collected exclusively by city-data.com from local newspapers, TV, and radio stations
According to 2022 data, the most numerous races in Sequim, WA are White alone (6,539 residents), Hispanic (555 residents), and Asian alone (358 residents). 96.0% of Sequim residents speak English at home. 7.1% of Sequim, WA residents are foreign-born (2.5% born in Asia, 2.2% born in Latin America, 1.1% born in North America, 0.9% born in Europe), which is 111.1% less than the foreign-born rate of 15.0% across the entire state of Washington.
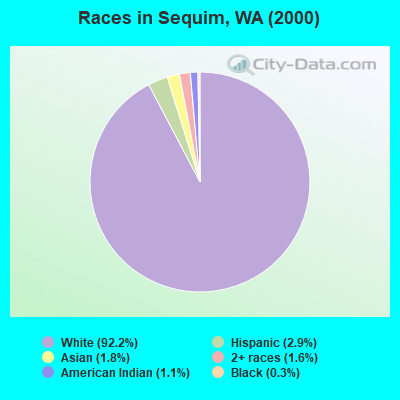
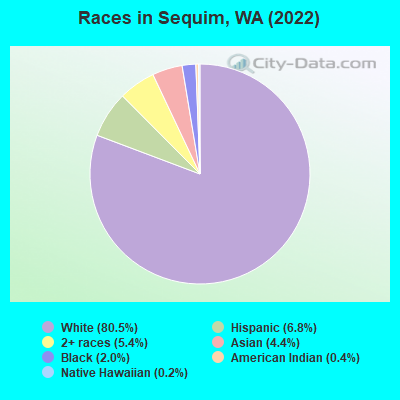
Race distribution in Sequim
2000
2022

- 3,99892.2%White alone
- 1242.9%Hispanic
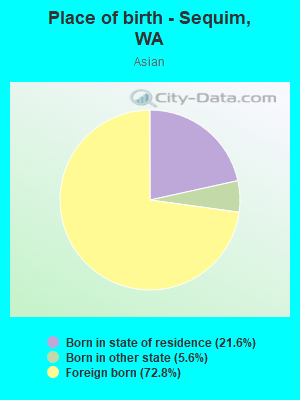
- 761.8%Asian alone
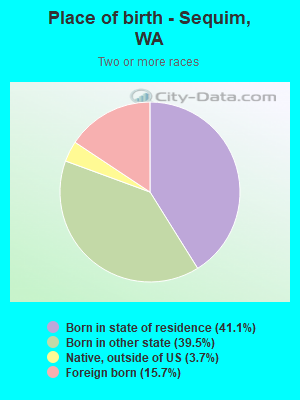
- 691.6%Two or more races
- 461.1%American Indian alone
- 130.3%Black alone
- 40.09%Native Hawaiian and Other
Pacific Islander alone - 40.09%Other race alone
-
- 6,53980.5%White alone
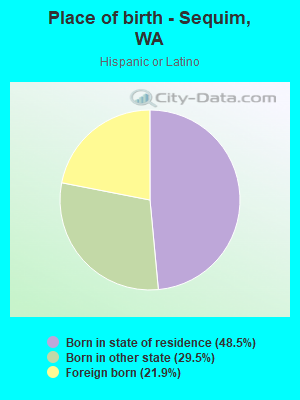
- 5556.8%Hispanic
- 4415.4%Two or more races
- 3584.4%Asian alone
- 1642.0%Black alone
- 300.4%American Indian alone
- 130.2%Native Hawaiian and Other
Pacific Islander alone
2000
2022
-
- 4,652,49078.9%White alone
- 441,5097.5%Hispanic
- 319,4015.4%Asian alone
- 184,6313.1%Black alone
- 175,9263.0%Two or more races
- 85,3961.4%American Indian alone
- 22,7790.4%Native Hawaiian and Other
Pacific Islander alone - 11,9890.2%Other race alone

-
- 4,941,45663.5%White alone
- 1,093,31314.0%Hispanic
- 755,8329.7%Asian alone
- 523,4486.7%Two or more races
- 299,5373.8%Black alone
- 69,0240.9%American Indian alone
- 52,2310.7%Native Hawaiian and Other
Pacific Islander alone - 50,9450.7%Other race alone

Income and house value in Sequim
- Median household income in 2022
- $47,442White non-Hispanic householders
- Median 2022 house value
- $464,707White Non-Hispanic householders
- $350,374American Indian or Alaska Native householders
- $487,942Asian householders
- $507,121Hispanic or Latino householders
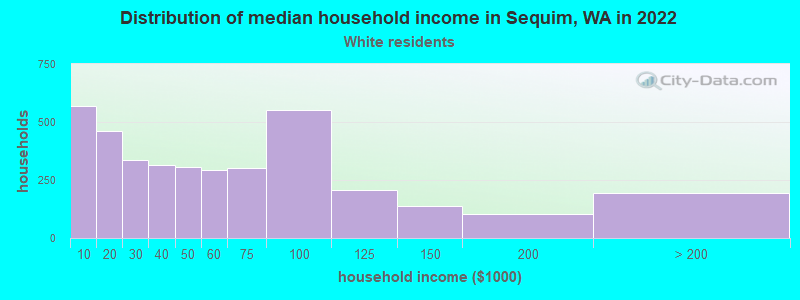
Household income for White non-Hispanic householders
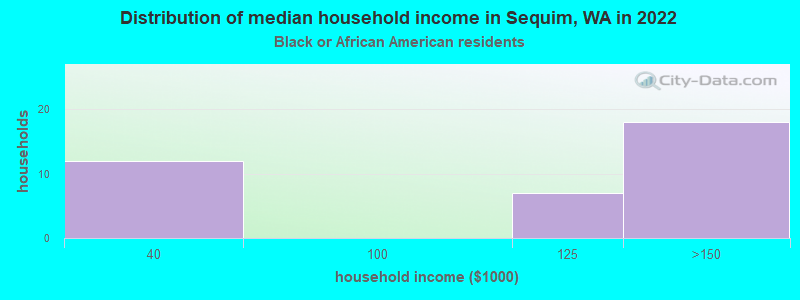
Household income for Black householders
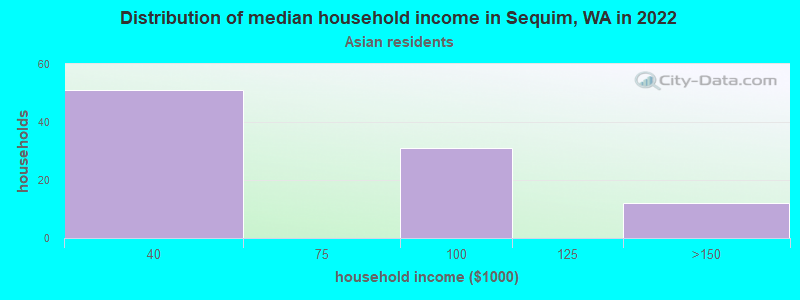
Household income for Asian householders
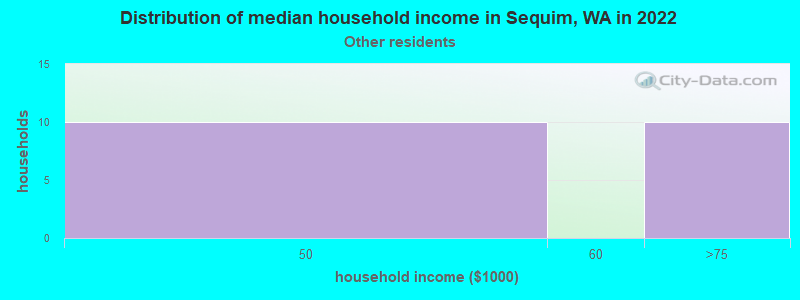
Household income for Some other race householders
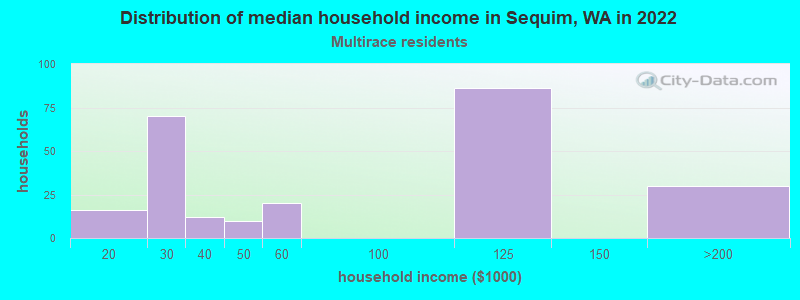
Household income for Two or more races householders
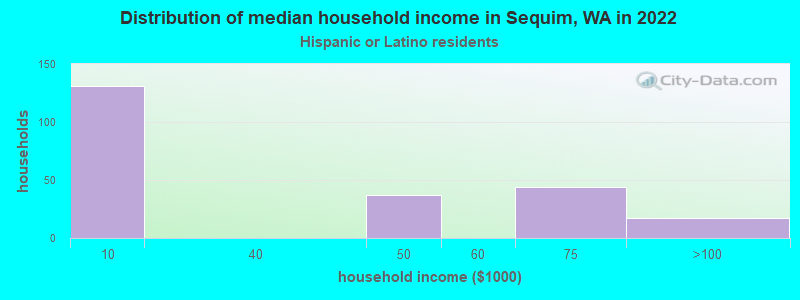
Household income for Hispanic or Latino race householders
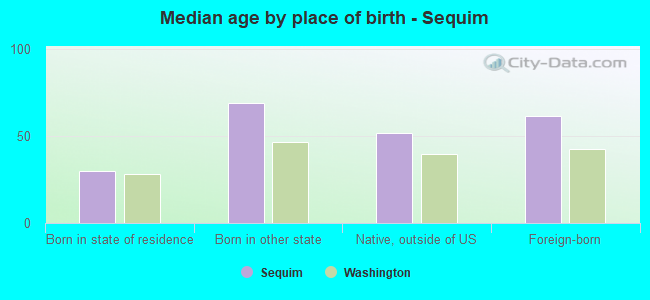
Median age by race in Sequim
- 61.9Median age for White residents
- 60.3Males
- 63.8Females
- 17.8Median age for Black or African American residents
- 18.3Males
- 16.4Females
- 27.5Median age for American Indian / Alaska Native residents
- -915,032,678.8Males
- 21.0Females
- 67.0Median age for Asian residents
- 56.3Males
- 66.4Females
- -666,666,666.0Median age for Native Hawaiian / Pacific Islander residents
- -666,666,666.0Males
- -666,666,666.0Females
- 24.7Median age for Other race residents
- 7.6Males
- 29.5Females
- 28.3Median age for Two or more races residents
- 17.4Males
- 56.0Females
- 62.6Median age for White alone residents
- 62.0Males
- 65.3Females
- 29.8Median age for Hispanic or Latino residents
- 13.1Males
- 33.5Females
Owner/renter occupied households by race in Sequim
- House owners and renters - White residents
- 2,30462.0%Owner occupied
- 1,41138.0%Renter occupied
- House owners and renters - Black or African American residents
- 818.9%Owner occupied
- 3381.1%Renter occupied
- House owners and renters - American Indian / Alaska Native residents
- 14100.0%Renter occupied
- House owners and renters - Asian residents
- 1213.4%Owner occupied
- 8086.6%Renter occupied
- House owners and renters - Other race residents
- 1249.9%Owner occupied
- 1250.1%Renter occupied
- House owners and renters - Two or more races residents
- 14962.8%Owner occupied
- 8837.2%Renter occupied
- House owners and renters - White alone residents
- 2,21562.2%Owner occupied
- 1,34537.8%Renter occupied
- House owners and renters - Hispanic or Latino residents
- 11452.9%Owner occupied
- 10247.1%Renter occupied
Language usage in Sequim
- English speakers - Total
- 96.0% of residents of Sequim speak English at home.
- 2.2% of residents speak Spanish at home
- 3721.3%Speak English very well
- 13778.7%Speak English less than very well
- 2.1% of residents speak other language at home
- 10865.9%Speak English very well
- 5634.1%Speak English less than very well
- English speakers - Born in the United States
- 98.8% of residents of Sequim speak English at home.
- 0.7% of residents speak Spanish at home
- 2281.5%Speak English very well
- 518.5%Speak English less than very well
- 1.4% of residents speak other language at home
- 2240.0%Speak English very well
- 3360.0%Speak English less than very well
- English speakers - Native, born elsewhere
- 53.1% of residents of Sequim speak English at home.
- English speakers - Foreign-born
- 61.8% of residents of Sequim speak English at home.
- 10.9% of residents speak Spanish at home
- 51100.0%Speak English less than very well
- 27.3% of residents speak other language at home
- 7458.3%Speak English very well
- 5341.7%Speak English less than very well
White (Caucasian) - Speak only English
| Native: | 99.0% (6,265) |
| Foreign-born: | 72.5% (130) |
White (Caucasian) - Speak another language
| Native: | 1.0% (65) |
| Foreign-born: | 26.9% (48) |
Black or African American - Speak only English
| Native: | 94.5% (176) |
| Foreign-born: | 100.0% (15) |
Asian - Speak only English
| Native: | 98.3% (68) |
| Foreign-born: | 47.8% (101) |
Other race - Speak only English
| Native: | 82.9% (54) |
| Foreign-born: | 27.2% (12) |
Other race - Speak another language
| Native: | 23.4% (15) |
| Foreign-born: | 72.5% (32) |
Two or more races - Speak only English
| Native: | 91.3% (484) |
| Foreign-born: | 62.3% (57) |
White alone - Speak only English
| Native: | 98.7% (6,093) |
| Foreign-born: | 73.9% (88) |
White alone - Speak another language
| Native: | 1.3% (78) |
| Foreign-born: | 26.4% (31) |
Hispanic or Latino - Speak only English
| Native: | 86.4% (366) |
| Foreign-born: | 52.3% (57) |
Hispanic or Latino - Speak another language
| Native: | 15.3% (65) |
| Foreign-born: | 48.4% (53) |
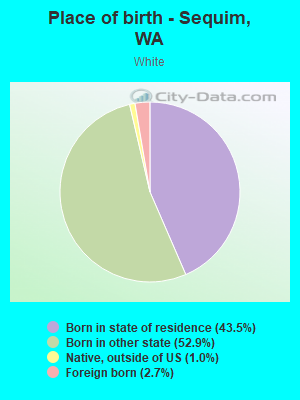
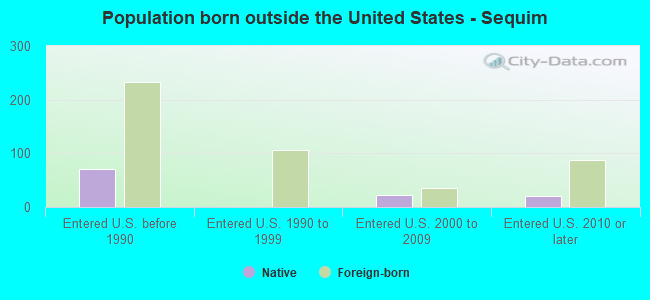
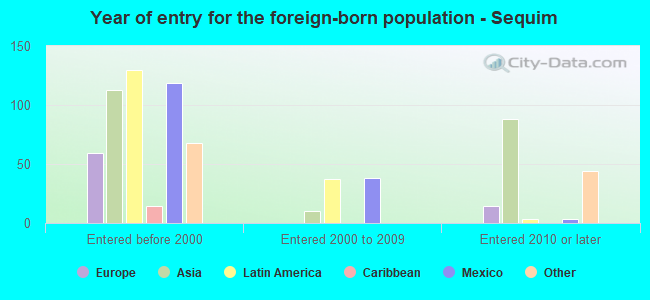
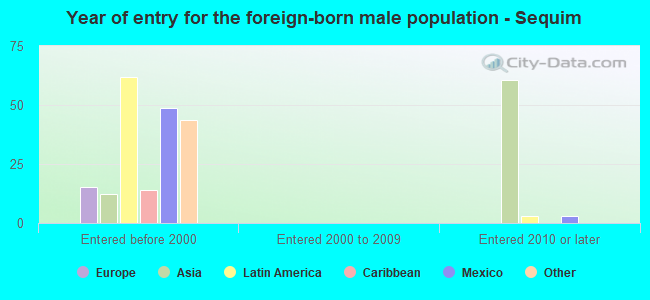
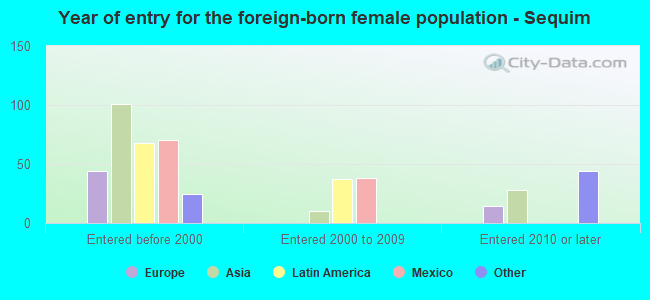
Foreign-born residents in Sequim
577 residents are foreign born (2.5% Asia, 2.2% Latin America, 1.1% North America, 0.9% Europe).
| This city: | 7.1% |
| Washington: | 14.9% |

Marital status for residents in Sequim
Marital status - White (Caucasian) population 15 years and over
- Males
- 26.2%Never married
- 51.1%Now married
- 0.4%Separated
- 7.3%Widowed
- 15.0%Divorced
- Females
- 17.3%Never married
- 43.9%Now married
- 0.9%Separated
- 17.8%Widowed
- 20.2%Divorced
Women who gave birth in the past 12 months
| Now married: | 40.0% (10) |
| Unmarried: | 60.0% (15) |
Women who did not give birth in the past 12 months
| Now married: | 40.2% (398) |
| Unmarried: | 59.8% (593) |
Marital status - Black or African American population 15 years and over
- Males
- 69.7%Never married
- 30.3%Now married
- 0.0%Separated
- 0.0%Widowed
- 0.0%Divorced
- Females
- 76.5%Never married
- 23.5%Now married
- 0.0%Separated
- 0.0%Widowed
- 0.0%Divorced
Women who did not give birth in the past 12 months
| Now married: | 23.5% (8) |
| Unmarried: | 76.5% (26) |
Marital status - American Indian / Alaska Native population 15 years and over
- Males
- 0.0%Never married
- 0.0%Now married
- 0.0%Separated
- 100.0%Widowed
- 0.0%Divorced
- Females
- 100.0%Never married
- 0.0%Now married
- 0.0%Separated
- 0.0%Widowed
- 0.0%Divorced
Women who did not give birth in the past 12 months
| Now married: | 0.0% (0) |
| Unmarried: | 100.0% (20) |
Marital status - Asian population 15 years and over
- Males
- 19.0%Never married
- 81.0%Now married
- 0.0%Separated
- 0.0%Widowed
- 0.0%Divorced
- Females
- 32.4%Never married
- 55.9%Now married
- 0.0%Separated
- 11.7%Widowed
- 0.0%Divorced
Women who did not give birth in the past 12 months
| Now married: | 26.5% (14) |
| Unmarried: | 73.5% (39) |
Marital status - Other race population 15 years and over
- Males
- 100.0%Never married
- 0.0%Now married
- 0.0%Separated
- 0.0%Widowed
- 0.0%Divorced
- Females
- 35.0%Never married
- 36.7%Now married
- 0.0%Separated
- 28.3%Widowed
- 0.0%Divorced
Women who did not give birth in the past 12 months
| Now married: | 60.7% (20) |
| Unmarried: | 39.3% (13) |
Marital status - Two or more races population 15 years and over
- Males
- 83.2%Never married
- 16.8%Now married
- 0.0%Separated
- 0.0%Widowed
- 0.0%Divorced
- Females
- 56.1%Never married
- 36.1%Now married
- 0.0%Separated
- 3.3%Widowed
- 4.5%Divorced
Women who did not give birth in the past 12 months
| Now married: | 26.2% (35) |
| Unmarried: | 73.8% (99) |
Marital status - White alone, not Hispanic / Latino population 15 years and over
- Males
- 25.5%Never married
- 51.5%Now married
- 0.0%Separated
- 7.5%Widowed
- 15.5%Divorced
- Females
- 17.8%Never married
- 41.8%Now married
- 0.9%Separated
- 18.5%Widowed
- 21.0%Divorced
Women who gave birth in the past 12 months
| Now married: | 40.0% (10) |
| Unmarried: | 60.0% (15) |
Women who did not give birth in the past 12 months
| Now married: | 33.4% (299) |
| Unmarried: | 66.6% (595) |
Marital status - Hispanic or Latino population 15 years and over
- Males
- 54.9%Never married
- 34.5%Now married
- 10.6%Separated
- 0.0%Widowed
- 0.0%Divorced
- Females
- 19.8%Never married
- 72.2%Now married
- 0.0%Separated
- 8.0%Widowed
- 0.0%Divorced
Women who did not give birth in the past 12 months
| Now married: | 79.2% (129) |
| Unmarried: | 20.8% (34) |
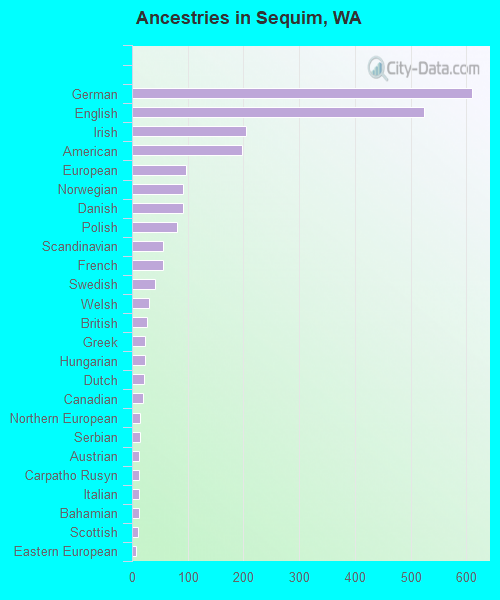
Ancestries in Sequim

- 61018.9%German
- 52416.2%English
- 2056.4%Irish
- 1976.1%American
- 963.0%European
- 922.8%Norwegian
- 912.8%Danish
- 812.5%Polish
- 561.7%Scandinavian
- 551.7%French
- 411.3%Swedish
- 300.9%Welsh
- 270.8%British
- 230.7%Greek
- 230.7%Hungarian
- 220.7%Dutch
- 190.6%Canadian
- 140.4%Northern European
- 140.4%Serbian
- 130.4%Austrian
- 120.4%Carpatho Rusyn
- 120.4%Italian
- 120.4%Bahamian
- 100.3%Scottish
- 70.2%Eastern European
- 70.2%Yugoslavian
- 50.2%Scotch-Irish
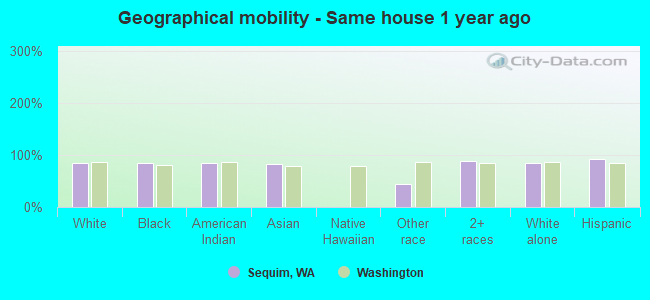
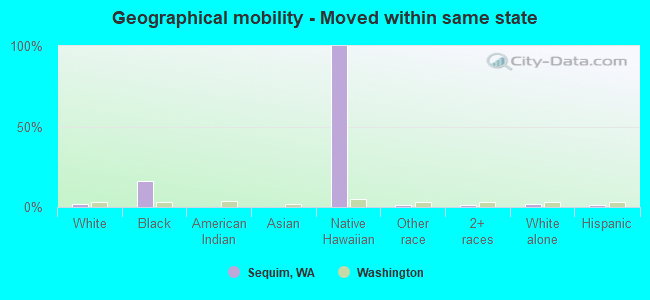
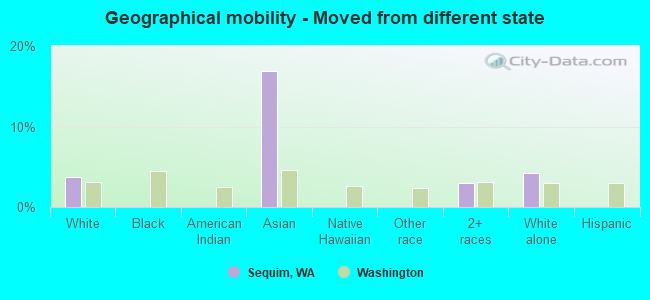
Geographical mobility in Sequim

- Same house 1 year ago
- 5,70984.8%White (Caucasian)
- 18785.6%Black or African American
- 4284.0%American Indian / Alaska Native
- 23483.3%Asian
- 6143.5%Other race
- 52288.9%Two or more races
- 5,46584.0%White alone, not Hispanic / Latino
- 51092.4%Hispanic or Latino
-
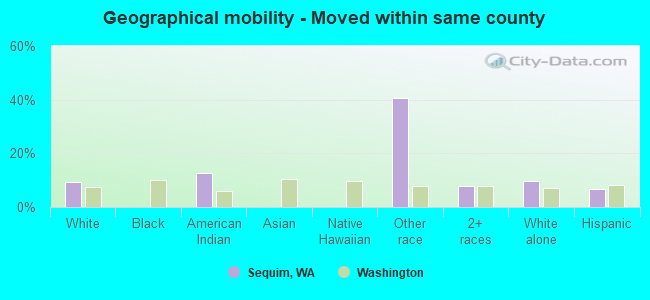
- Moved within same county
- 6349.4%White / Caucasian
- 612.5%American Indian / Alaska Native
- 5740.6%Other race
- 457.7%Two or more races
- 6429.9%White alone, not Hispanic / Latino
- 376.6%Hispanic or Latino
-
- Moved within same state
- 1071.6%White / Caucasian
- 3516.1%Black or African American
- 17100.0%Native Hawaiian / Pacific Islander
- 21.4%Other race
- 50.8%Two or more races
- 1021.6%White alone, not Hispanic / Latino
- 30.6%Hispanic or Latino
-
- Moved from different state
- 2503.7%White / Caucasian
- 4716.9%Asian
- 172.9%Two or more races
- 2744.2%White alone, not Hispanic / Latino
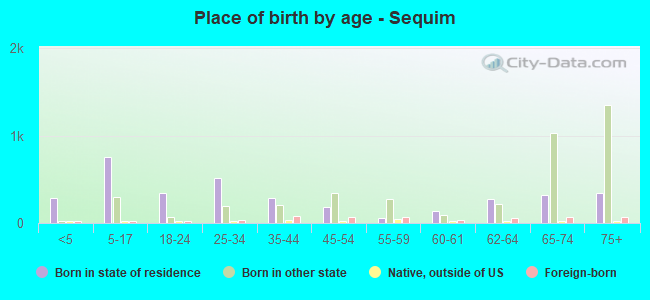
Children Nativity (place of birth) in Sequim
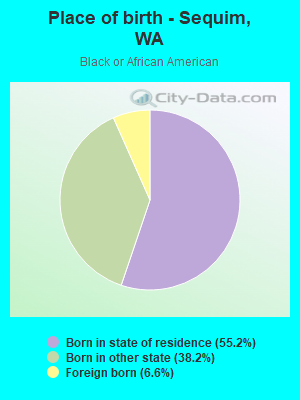
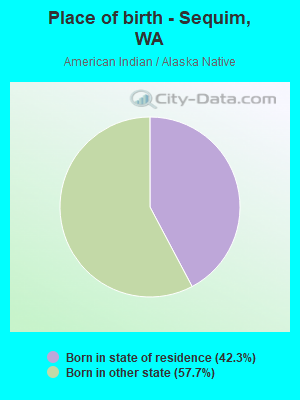
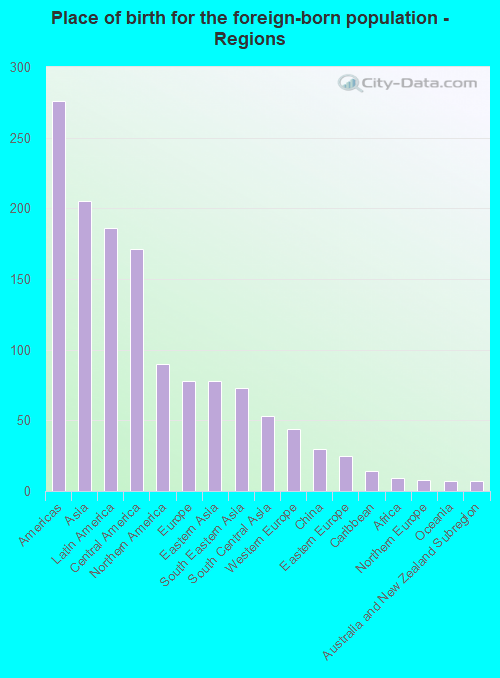
Place of birth for residents in Sequim
![Place of birth for the foreign-born population - Regions]()
- 276Americas
- 205Asia
- 186Latin America
- 171Central America
- 90Northern America
- 78Europe
- 78Eastern Asia
- 73South Eastern Asia
- 53South Central Asia
- 44Western Europe
- 30China
- 25Eastern Europe
- 14Caribbean
- 9Africa
- 8Northern Europe
- 7Oceania
- 7Australia and New Zealand Subregion
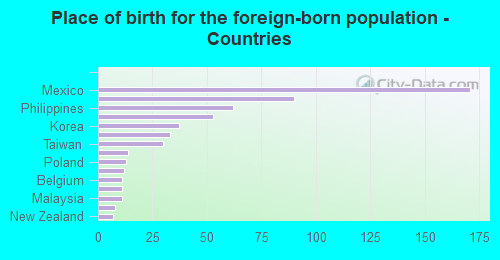
![Place of birth for the foreign-born population - Countries]()
- 171Mexico
- 90Canada
- 62Philippines
- 53India
- 37Korea
- 33Germany
- 30Taiwan
- 14Bahamas
- 13Poland
- 12Hungary
- 11Belgium
- 11Japan
- 11Malaysia
- 8England
- 7New Zealand
Grandparents responsible for own grandchildren in Sequim
Zip codes: 98382.