Races in Seminole, Florida (FL) Detailed Stats
Data:
Races - White alone (%)
Races - White alone (% change since 2000)
Races - Black alone (%)
Races - Black alone (% change since 2000)
Races - American Indian alone (%)
Races - American Indian alone (% change since 2000)
Races - Asian alone (%)
Races - Asian alone (% change since 2000)
Races - Hispanic (%)
Races - Hispanic (% change since 2000)
Races - Native Hawaiian and Other Pacific Islander alone (%)
Races - Native Hawaiian and Other Pacific Islander alone (% change since 2000)
Races - Two or more races(%)
Races - Two or more races(% change since 2000)
Races - Other race alone (%)
Races - Other race alone (% change since 2000)
Racial diversity
Place of birth - Born in state of residence (%)
Place of birth - Born in state of residence (%) - White
Place of birth - Born in state of residence (%) - Black or African American
Place of birth - Born in state of residence (%) - Asian
Place of birth - Born in state of residence (%) - Hispanic or Latino
Place of birth - Born in state of residence (%) - American Indian and Alaska Native
Place of birth - Born in state of residence (%) - Multirace
Place of birth - Born in state of residence (%) - Other Race
Place of birth - Born in other state (%)
Place of birth - Born in other state (%) - White
Place of birth - Born in other state (%) - Black or African American
Place of birth - Born in other state (%) - Asian
Place of birth - Born in other state (%) - Hispanic or Latino
Place of birth - Born in other state (%) - American Indian and Alaska Native
Place of birth - Born in other state (%) - Multirace
Place of birth - Born in other state (%) - Other Race
Place of birth - Native, outside of US (%)
Place of birth - Native, outside of US (%) - White
Place of birth - Native, outside of US (%) - Black or African American
Place of birth - Native, outside of US (%) - Asian
Place of birth - Native, outside of US (%) - Hispanic or Latino
Place of birth - Native, outside of US (%) - American Indian and Alaska Native
Place of birth - Native, outside of US (%) - Multirace
Place of birth - Native, outside of US (%) - Other Race
Place of birth - Foreign born (%)
Place of birth - Foreign born (%) - White
Place of birth - Foreign born (%) - Black or African American
Place of birth - Foreign born (%) - Asian
Place of birth - Foreign born (%) - Hispanic or Latino
Place of birth - Foreign born (%) - American Indian and Alaska Native
Place of birth - Foreign born (%) - Multirace
Place of birth - Foreign born (%) - Other Race
Residents speaking English at home (%)
Residents speaking English at home - Born in the United States (%)
Residents speaking English at home - Native, born elsewhere (%)
Residents speaking English at home - Foreign born (%)
Residents speaking Spanish at home (%)
Residents speaking Spanish at home - Born in the United States (%)
Residents speaking Spanish at home - Native, born elsewhere (%)
Residents speaking Spanish at home - Foreign born (%)
Residents speaking other language at home (%)
Residents speaking other language at home - Born in the United States (%)
Residents speaking other language at home - Native, born elsewhere (%)
Residents speaking other language at home - Foreign born (%)
Marital status - Never married (%)
Marital status - Now married (%)
Marital status - Separated (%)
Marital status - Widowed (%)
Marital status - Divorced (%)
Ancestries Reported - Arab (%)
Ancestries Reported - Czech (%)
Ancestries Reported - Danish (%)
Ancestries Reported - Dutch (%)
Ancestries Reported - English (%)
Ancestries Reported - French (%)
Ancestries Reported - French Canadian (%)
Ancestries Reported - German (%)
Ancestries Reported - Greek (%)
Ancestries Reported - Hungarian (%)
Ancestries Reported - Irish (%)
Ancestries Reported - Italian (%)
Ancestries Reported - Lithuanian (%)
Ancestries Reported - Norwegian (%)
Ancestries Reported - Polish (%)
Ancestries Reported - Portuguese (%)
Ancestries Reported - Russian (%)
Ancestries Reported - Scotch-Irish (%)
Ancestries Reported - Scottish (%)
Ancestries Reported - Slovak (%)
Ancestries Reported - Subsaharan African (%)
Ancestries Reported - Swedish (%)
Ancestries Reported - Swiss (%)
Ancestries Reported - Ukrainian (%)
Ancestries Reported - United States (%)
Ancestries Reported - Welsh (%)
Ancestries Reported - West Indian (%)
Ancestries Reported - Other (%)
Geographical mobility - Same house 1 year ago (%)
Geographical mobility - Same house 1 year ago (%) - White
Geographical mobility - Same house 1 year ago (%) - Black or African American
Geographical mobility - Same house 1 year ago (%) - Asian
Geographical mobility - Same house 1 year ago (%) - Hispanic or Latino
Geographical mobility - Same house 1 year ago (%) - American Indian and Alaska Native
Geographical mobility - Same house 1 year ago (%) - Multirace
Geographical mobility - Same house 1 year ago (%) - Other Race
Geographical mobility - Moved within same county (%)
Geographical mobility - Moved within same county (%) - White
Geographical mobility - Moved within same county (%) - Black or African American
Geographical mobility - Moved within same county (%) - Asian
Geographical mobility - Moved within same county (%) - Hispanic or Latino
Geographical mobility - Moved within same county (%) - American Indian and Alaska Native
Geographical mobility - Moved within same county (%) - Multirace
Geographical mobility - Moved within same county (%) - Other Race
Geographical mobility - Moved from different county within same state (%)
Geographical mobility - Moved from different county within same state (%) - White
Geographical mobility - Moved from different county within same state (%) - Black or African American
Geographical mobility - Moved from different county within same state (%) - Asian
Geographical mobility - Moved from different county within same state (%) - Hispanic or Latino
Geographical mobility - Moved from different county within same state (%) - American Indian and Alaska Native
Geographical mobility - Moved from different county within same state (%) - Multirace
Geographical mobility - Moved from different county within same state (%) - Other Race
Geographical mobility - Moved from different state (%)
Geographical mobility - Moved from different state (%) - White
Geographical mobility - Moved from different state (%) - Black or African American
Geographical mobility - Moved from different state (%) - Asian
Geographical mobility - Moved from different state (%) - Hispanic or Latino
Geographical mobility - Moved from different state (%) - American Indian and Alaska Native
Geographical mobility - Moved from different state (%) - Multirace
Geographical mobility - Moved from different state (%) - Other Race
Geographical mobility - Moved from abroad (%)
Geographical mobility - Moved from abroad (%) - White
Geographical mobility - Moved from abroad (%) - Black or African American
Geographical mobility - Moved from abroad (%) - Asian
Geographical mobility - Moved from abroad (%) - Hispanic or Latino
Geographical mobility - Moved from abroad (%) - American Indian and Alaska Native
Geographical mobility - Moved from abroad (%) - Multirace
Geographical mobility - Moved from abroad (%) - Other Race
Place of birth for the foreign-born population - Ireland (%)
Place of birth for the foreign-born population - Denmark (%)
Place of birth for the foreign-born population - Norway (%)
Place of birth for the foreign-born population - Sweden (%)
Place of birth for the foreign-born population - United Kingdom (%)
Place of birth for the foreign-born population - England (%)
Place of birth for the foreign-born population - Scotland (%)
Place of birth for the foreign-born population - Other Northern Europe (%)
Place of birth for the foreign-born population - Austria (%)
Place of birth for the foreign-born population - Belgium (%)
Place of birth for the foreign-born population - France (%)
Place of birth for the foreign-born population - Germany (%)
Place of birth for the foreign-born population - Netherlands (%)
Place of birth for the foreign-born population - Switzerland (%)
Place of birth for the foreign-born population - Other Western Europe (%)
Place of birth for the foreign-born population - Greece (%)
Place of birth for the foreign-born population - Italy (%)
Place of birth for the foreign-born population - Portugal (%)
Place of birth for the foreign-born population - Spain (%)
Place of birth for the foreign-born population - Other Southern Europe (%)
Place of birth for the foreign-born population - Albania (%)
Place of birth for the foreign-born population - Belarus (%)
Place of birth for the foreign-born population - Bosnia and Herzegovina (%)
Place of birth for the foreign-born population - Bulgaria (%)
Place of birth for the foreign-born population - Croatia (%)
Place of birth for the foreign-born population - Czechoslovakia (%)
Place of birth for the foreign-born population - Hungary (%)
Place of birth for the foreign-born population - Latvia (%)
Place of birth for the foreign-born population - Lithuania (%)
Place of birth for the foreign-born population - North Macedonia (Macedonia) (%)
Place of birth for the foreign-born population - Moldova (%)
Place of birth for the foreign-born population - Poland (%)
Place of birth for the foreign-born population - Romania (%)
Place of birth for the foreign-born population - Russia (%)
Place of birth for the foreign-born population - Serbia (%)
Place of birth for the foreign-born population - Ukraine (%)
Place of birth for the foreign-born population - Other Eastern Europe (%)
Place of birth for the foreign-born population - China (%)
Place of birth for the foreign-born population - Hong Kong (%)
Place of birth for the foreign-born population - Taiwan (%)
Place of birth for the foreign-born population - Japan (%)
Place of birth for the foreign-born population - Korea (%)
Place of birth for the foreign-born population - Other Eastern Asia (%)
Place of birth for the foreign-born population - Afghanistan (%)
Place of birth for the foreign-born population - Bangladesh (%)
Place of birth for the foreign-born population - India (%)
Place of birth for the foreign-born population - Iran (%)
Place of birth for the foreign-born population - Kazakhstan (%)
Place of birth for the foreign-born population - Nepal (%)
Place of birth for the foreign-born population - Pakistan (%)
Place of birth for the foreign-born population - Sri Lanka (%)
Place of birth for the foreign-born population - Uzbekistan (%)
Place of birth for the foreign-born population - Other South Central Asia (%)
Place of birth for the foreign-born population - Burma (%)
Place of birth for the foreign-born population - Cambodia (%)
Place of birth for the foreign-born population - Indonesia (%)
Place of birth for the foreign-born population - Laos (%)
Place of birth for the foreign-born population - Malaysia (%)
Place of birth for the foreign-born population - Philippines (%)
Place of birth for the foreign-born population - Singapore (%)
Place of birth for the foreign-born population - Thailand (%)
Place of birth for the foreign-born population - Vietnam (%)
Place of birth for the foreign-born population - Other South Eastern Asia (%)
Place of birth for the foreign-born population - Armenia (%)
Place of birth for the foreign-born population - Iraq (%)
Place of birth for the foreign-born population - Israel (%)
Place of birth for the foreign-born population - Jordan (%)
Place of birth for the foreign-born population - Kuwait (%)
Place of birth for the foreign-born population - Lebanon (%)
Place of birth for the foreign-born population - Saudi Arabia (%)
Place of birth for the foreign-born population - Syria (%)
Place of birth for the foreign-born population - Turkey (%)
Place of birth for the foreign-born population - Yemen (%)
Place of birth for the foreign-born population - Other Western Asia (%)
Place of birth for the foreign-born population - Eritrea (%)
Place of birth for the foreign-born population - Ethiopia (%)
Place of birth for the foreign-born population - Kenya (%)
Place of birth for the foreign-born population - Somalia (%)
Place of birth for the foreign-born population - Uganda (%)
Place of birth for the foreign-born population - Zimbabwe (%)
Place of birth for the foreign-born population - Other Eastern Africa (%)
Place of birth for the foreign-born population - Cameroon (%)
Place of birth for the foreign-born population - Congo (%)
Place of birth for the foreign-born population - Democratic Republic of Congo (Zaire) (%)
Place of birth for the foreign-born population - Other Middle Africa (%)
Place of birth for the foreign-born population - Egypt (%)
Place of birth for the foreign-born population - Morocco (%)
Place of birth for the foreign-born population - Sudan (%)
Place of birth for the foreign-born population - Other Northern Africa (%)
Place of birth for the foreign-born population - South Africa (%)
Place of birth for the foreign-born population - Other Southern Africa (%)
Place of birth for the foreign-born population - Cabo Verde (%)
Place of birth for the foreign-born population - Ghana (%)
Place of birth for the foreign-born population - Liberia (%)
Place of birth for the foreign-born population - Nigeria (%)
Place of birth for the foreign-born population - Senegal (%)
Place of birth for the foreign-born population - Sierra Leone (%)
Place of birth for the foreign-born population - Other Western Africa (%)
Place of birth for the foreign-born population - Australia (%)
Place of birth for the foreign-born population - New Zealand (%)
Place of birth for the foreign-born population - Fiji (%)
Place of birth for the foreign-born population - Micronesia (%)
Place of birth for the foreign-born population - Bahamas (%)
Place of birth for the foreign-born population - Barbados (%)
Place of birth for the foreign-born population - Cuba (%)
Place of birth for the foreign-born population - Dominica (%)
Place of birth for the foreign-born population - Dominican Republic (%)
Place of birth for the foreign-born population - Grenada (%)
Place of birth for the foreign-born population - Haiti (%)
Place of birth for the foreign-born population - Jamaica (%)
Place of birth for the foreign-born population - St. Vincent and the Grenadines (%)
Place of birth for the foreign-born population - Trinidad and Tobago (%)
Place of birth for the foreign-born population - West Indies (%)
Place of birth for the foreign-born population - Other Caribbean (%)
Place of birth for the foreign-born population - Belize (%)
Place of birth for the foreign-born population - Costa Rica (%)
Place of birth for the foreign-born population - El Salvador (%)
Place of birth for the foreign-born population - Guatemala (%)
Place of birth for the foreign-born population - Honduras (%)
Place of birth for the foreign-born population - Mexico (%)
Place of birth for the foreign-born population - Nicaragua (%)
Place of birth for the foreign-born population - Panama (%)
Place of birth for the foreign-born population - Other Central America (%)
Place of birth for the foreign-born population - Argentina (%)
Place of birth for the foreign-born population - Bolivia (%)
Place of birth for the foreign-born population - Brazil (%)
Place of birth for the foreign-born population - Chile (%)
Place of birth for the foreign-born population - Colombia (%)
Place of birth for the foreign-born population - Ecuador (%)
Place of birth for the foreign-born population - Guyana (%)
Place of birth for the foreign-born population - Peru (%)
Place of birth for the foreign-born population - Uruguay (%)
Place of birth for the foreign-born population - Venezuela (%)
Place of birth for the foreign-born population - Other South America (%)
Place of birth for the foreign-born population - Canada (%)
Place of birth for the foreign-born population - Other Northern America (%)
Place of birth for the foreign-born population - Other (%)
Latest news about races in Seminole, FL collected exclusively by city-data.com from local newspapers, TV, and radio stations
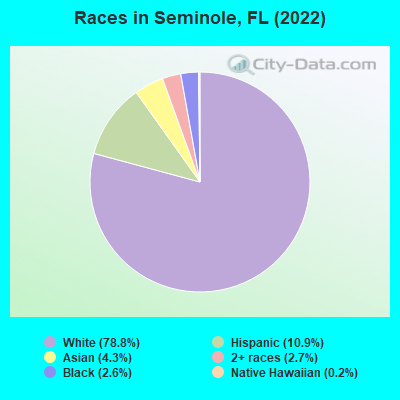
According to 2022 data, the most numerous races in Seminole, FL are White alone (15,235 residents), Hispanic (2,101 residents), and Black alone (507 residents). 86.3% of Seminole residents speak English at home. 11.5% of Seminole, FL residents are foreign-born (3.6% born in Asia, 3.4% born in Europe, 2.6% born in Latin America), which is 83.3% less than the foreign-born rate of 21.0% across the entire state of Florida.
Race distribution in Seminole
2000 2022
10,458,509 65.4% White alone 2,682,715 16.8% Hispanic 2,264,268 14.2% Black alone 261,693 1.6% Asian alone 236,954 1.5% Two or more races 42,358 0.3% American Indian alone 28,994 0.2% Other race alone 6,887 0.04% Native Hawaiian and Other
11,309,403 50.8% White alone 6,025,039 27.1% Hispanic 3,241,015 14.6% Black alone 861,630 3.9% Two or more races 623,692 2.8% Asian alone 152,054 0.7% Other race alone 22,504 0.1% American Indian alone 9,486 0.04% Native Hawaiian and Other
Income and house value in Seminole Median household income in 2022 $66,707 White non-Hispanic householders$64,572 Black householders$161,772 Asian householdersover $200,000 Some other race householders$93,034 Two or more races householders$101,848 Hispanic or Latino race householdersMedian 2022 house value $448,356 White Non-Hispanic householders$487,901 American Indian or Alaska Native householders $868,390 Asian householders$293,916 Some other race householders$427,515 Two or more races householders$381,022 Hispanic or Latino householders
Median age by race in Seminole
58.2 Median age for White residents53.9 60.3 61.0 Median age for Black or African American residents59.2 43.4 38.4 Median age for American Indian / Alaska Native residents-535,303,776.1 -323,863,636.0 39.4 Median age for Asian residents40.4 42.9 24.6 Median age for Native Hawaiian / Pacific Islander residents-663,446,054.1 16.4 40.1 Median age for Other race residents39.0 47.7 41.8 Median age for Two or more races residents31.7 46.0 58.0 Median age for White alone residents54.3 60.4 37.3 Median age for Hispanic or Latino residents34.9 40.1
Owner/renter occupied households by race in Seminole
House owners and renters - White residents 5,710 71.4% Owner occupied2,286 28.6% Renter occupiedHouse owners and renters - Black or African American residents 73 30.9% Owner occupied162 69.1% Renter occupiedHouse owners and renters - American Indian / Alaska Native residents 11 75.7% Owner occupied4 24.3% Renter occupiedHouse owners and renters - Asian residents 195 83.4% Owner occupied39 16.6% Renter occupiedHouse owners and renters - Native Hawaiian / Pacific Islander residents 14 100.0% Renter occupiedHouse owners and renters - Other race residents 56 71.3% Owner occupied22 28.7% Renter occupiedHouse owners and renters - Two or more races residents 362 77.3% Owner occupied106 22.7% Renter occupiedHouse owners and renters - White alone residents 5,636 70.4% Owner occupied2,368 29.6% Renter occupiedHouse owners and renters - Hispanic or Latino residents 411 90.9% Owner occupied41 9.1% Renter occupied
Language usage in Seminole
English speakers - Total 86.3% of residents of Seminole speak English at home.
5.0% of residents speak Spanish at home 601 63.9% Speak English very well339 36.1% Speak English less than very well8.3% of residents speak other language at home 1,017 65.0% Speak English very well547 35.0% Speak English less than very well
English speakers - Born in the United States 97.1% of residents of Seminole speak English at home.
1.9% of residents speak Spanish at home 169 81.6% Speak English very well38 18.4% Speak English less than very well1.0% of residents speak other language at home 108 100.0% Speak English very well
English speakers - Native, born elsewhere 42.3% of residents of Seminole speak English at home.
54.8% of residents speak Spanish at home 230 76.2% Speak English very well72 23.8% Speak English less than very well2.0% of residents speak other language at home 11 100.0% Speak English less than very well
English speakers - Foreign-born 26.7% of residents of Seminole speak English at home.
16.0% of residents speak Spanish at home 138 39.9% Speak English very well208 60.1% Speak English less than very well56.2% of residents speak other language at home 706 58.2% Speak English very well508 41.8% Speak English less than very well
White (Caucasian) - Speak only English Native:
99.5% (13,816)Foreign-born:
38.3% (420)
White (Caucasian) - Speak another language Native:
1.3% (180)Foreign-born:
61.8% (678)
Black or African American - Speak only English Native:
99.2% (471)Foreign-born:
57.3% (30)
Black or African American - Speak another language Native:
1.1% (5)Foreign-born:
40.6% (21)
Asian - Speak only English Native:
43.9% (142)Foreign-born:
10.7% (54)
Asian - Speak another language Native:
56.6% (183)Foreign-born:
89.2% (453)
Native Hawaiian / Pacific Islander - Speak another language Native:
100.0% (12)Foreign-born:
100.0% (18)
Other race - Speak only English Native:
55.4% (97)Foreign-born:
31.8% (32)
Other race - Speak another language Native:
44.6% (78)Foreign-born:
62.9% (63)
Two or more races - Speak only English Native:
63.3% (1,217)Foreign-born:
12.0% (38)
Two or more races - Speak another language Native:
36.2% (696)Foreign-born:
87.8% (276)
White alone - Speak only English Native:
99.3% (13,628)Foreign-born:
34.5% (397)
White alone - Speak another language Native:
1.1% (149)Foreign-born:
66.1% (761)
Hispanic or Latino - Speak only English Native:
61.8% (967)Foreign-born:
15.5% (66)
Hispanic or Latino - Speak another language Native:
37.3% (584)Foreign-born:
79.7% (339)
Foreign-born residents in Seminole 2,214 residents are foreign born (3.6% Asia , 3.4% Europe , 2.6% Latin America ).
This city:
11.5%Florida:
21.1%
Marital status for residents in Seminole Marital status - White (Caucasian) population 15 years and over
Males 28.8% Never married52.2% Now married0.1% Separated4.7% Widowed14.2% DivorcedFemales 18.7% Never married42.0% Now married1.5% Separated18.7% Widowed19.1% DivorcedWomen who gave birth in the past 12 months Now married:
42.2% (68)Unmarried:
57.8% (94)
Women who did not give birth in the past 12 months Now married:
48.1% (1,095)Unmarried:
51.9% (1,181)
Marital status - Black or African American population 15 years and over
Males 19.1% Never married70.1% Now married0.0% Separated0.0% Widowed10.7% DivorcedFemales 50.6% Never married27.3% Now married0.0% Separated22.0% Widowed0.0% DivorcedWomen who did not give birth in the past 12 months Now married:
30.4% (35)Unmarried:
69.6% (81)
Marital status - American Indian / Alaska Native population 15 years and over
Males 62.5% Never married37.5% Now married0.0% Separated0.0% Widowed0.0% DivorcedFemales 0.0% Never married100.0% Now married0.0% Separated0.0% Widowed0.0% DivorcedMarital status - Asian population 15 years and over
Males 30.3% Never married66.4% Now married0.0% Separated0.0% Widowed3.3% DivorcedFemales 24.4% Never married55.9% Now married3.8% Separated0.0% Widowed15.9% DivorcedWomen who gave birth in the past 12 months Now married:
100.0% (15)Unmarried:
0.0% (0)
Women who did not give birth in the past 12 months Now married:
54.5% (129)Unmarried:
45.5% (108)
Marital status - Native Hawaiian / Pacific Islander population 15 years and over
Males 100.0% Never married0.0% Now married0.0% Separated0.0% Widowed0.0% DivorcedFemales 78.9% Never married0.0% Now married0.0% Separated21.1% Widowed0.0% DivorcedWomen who did not give birth in the past 12 months Now married:
0.0% (0)Unmarried:
100.0% (11)
Marital status - Other race population 15 years and over
Males 56.7% Never married43.3% Now married0.0% Separated0.0% Widowed0.0% DivorcedFemales 31.7% Never married59.4% Now married0.0% Separated0.0% Widowed8.9% DivorcedWomen who did not give birth in the past 12 months Now married:
60.0% (70)Unmarried:
40.0% (46)
Marital status - Two or more races population 15 years and over
Males 42.6% Never married52.4% Now married0.0% Separated0.0% Widowed5.0% DivorcedFemales 25.5% Never married63.0% Now married0.0% Separated4.3% Widowed7.2% DivorcedWomen who gave birth in the past 12 months Now married:
100.0% (22)Unmarried:
0.0% (0)
Women who did not give birth in the past 12 months Now married:
50.7% (223)Unmarried:
49.3% (217)
Marital status - White alone, not Hispanic / Latino population 15 years and over
Males 28.6% Never married52.1% Now married0.1% Separated4.7% Widowed14.5% DivorcedFemales 18.4% Never married41.9% Now married1.5% Separated19.1% Widowed19.0% DivorcedWomen who gave birth in the past 12 months Now married:
42.2% (71)Unmarried:
57.8% (98)
Women who did not give birth in the past 12 months Now married:
48.8% (1,113)Unmarried:
51.2% (1,169)
Marital status - Hispanic or Latino population 15 years and over
Males 46.5% Never married48.5% Now married0.0% Separated0.9% Widowed4.1% DivorcedFemales 28.7% Never married57.7% Now married0.0% Separated3.5% Widowed10.1% DivorcedWomen who gave birth in the past 12 months Now married:
100.0% (16)Unmarried:
0.0% (0)
Women who did not give birth in the past 12 months Now married:
48.7% (245)Unmarried:
51.3% (258)
Ancestries in Seminole
1,144 11.9% Italian1,141 11.9% German943 9.8% Irish943 9.8% English879 9.2% American476 5.0% European299 3.1% Polish229 2.4% Ukrainian191 2.0% Scottish159 1.7% French145 1.5% Canadian130 1.4% Russian117 1.2% Lebanese96 1.0% British92 1.0% Dutch78 0.8% Portuguese58 0.6% Norwegian55 0.6% Swedish52 0.5% French Canadian50 0.5% Jamaican40 0.4% Greek38 0.4% Lithuanian36 0.4% Slovak35 0.4% Albanian34 0.4% Scotch-Irish33 0.3% Welsh28 0.3% Palestinian27 0.3% Syrian22 0.2% Northern European16 0.2% Scandinavian15 0.2% Eastern European14 0.1% Bulgarian14 0.1% Swiss11 0.1% Austrian9 0.09% Hungarian8 0.08% Danish8 0.08% Romanian5 0.05% Israeli5 0.05% Yugoslavian3 0.03% Brazilian
Geographical mobility in Seminole Same house 1 year ago 13,268 86.5% White (Caucasian)338 63.9% Black or African American62 100.0% American Indian / Alaska Native737 88.1% Asian48 100.0% Native Hawaiian / Pacific Islander198 72.7% Other race2,115 94.4% Two or more races13,118 86.4% White alone, not Hispanic / Latino1,901 91.4% Hispanic or LatinoMoved within same county 1,046 6.8% White / Caucasian73 13.8% Black or African American89 10.7% Asian32 11.6% Other race80 3.6% Two or more races1,044 6.9% White alone, not Hispanic / Latino96 4.6% Hispanic or LatinoMoved within same state 117 0.8% White / Caucasian42 7.9% Black or African American30 1.4% Two or more races119 0.8% White alone, not Hispanic / Latino23 1.1% Hispanic or LatinoMoved from different state 637 4.1% White / Caucasian80 15.2% Black or African American15 1.7% Asian19 7.1% Other race24 1.1% Two or more races619 4.1% White alone, not Hispanic / Latino58 2.8% Hispanic or LatinoMoved from abroad 302 2.0% White336 2.2% White alone, not Hispanic / Latino
Children Nativity (place of birth) in Seminole
Children under 6 years - Living with two parents Both parents native 323 100.0% NativeBoth parents foreign-born 5 15.6% Native27 84.4% Foreign-bornOne native, one foreign-born parent 37 100.0% NativeChildren under 6 years - Living with one parent Native parent 113 100.0% NativeForeign-born parent 52 100.0% NativeChildren 6 to 17 years - Living with two parents Both parents native 878 100.0% NativeBoth parents foreign-born 169 68.9% Native76 31.1% Foreign-bornOne native, one foreign-born parent 230 100.0% NativeChildren 6 to 17 years - Living with one parent Native parent 407 100.0% NativeForeign-born parent 11 50.7% Native11 49.3% Foreign-born
Grandparents responsible for own grandchildren in Seminole
Grandparents (30 to 59 years) White / Caucasian 10 40.9% Responsible for grandchildren14 59.1% Not responsible for grandchildrenTwo or more races 306 100.0% Not responsible for grandchildrenWhite alone, not Hispanic / Latino 11 44.5% Responsible for grandchildren14 55.5% Not responsible for grandchildrenHispanic or Latino 245 100.0% Not responsible for grandchildrenGrandparents (60 years and over) White / Caucasian 12 15.0% Responsible for grandchildren67 85.0% Not responsible for grandchildrenWhite alone, not Hispanic / Latino 11 14.5% Responsible for grandchildren67 85.5% Not responsible for grandchildren