Races in Secaucus, New Jersey (NJ) Detailed Stats
Data:
Races - White alone (%)
Races - White alone (% change since 2000)
Races - Black alone (%)
Races - Black alone (% change since 2000)
Races - American Indian alone (%)
Races - American Indian alone (% change since 2000)
Races - Asian alone (%)
Races - Asian alone (% change since 2000)
Races - Hispanic (%)
Races - Hispanic (% change since 2000)
Races - Native Hawaiian and Other Pacific Islander alone (%)
Races - Native Hawaiian and Other Pacific Islander alone (% change since 2000)
Races - Two or more races(%)
Races - Two or more races(% change since 2000)
Races - Other race alone (%)
Races - Other race alone (% change since 2000)
Racial diversity
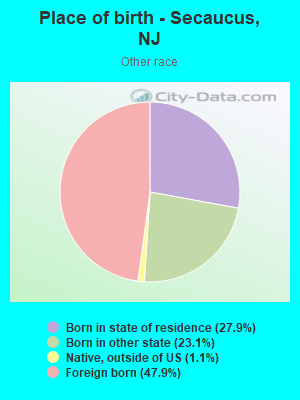
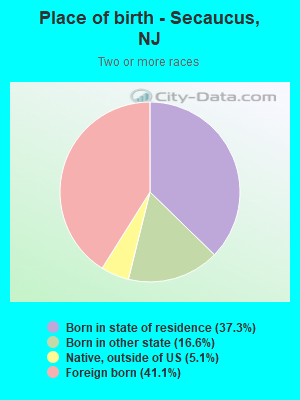
Place of birth - Born in state of residence (%)
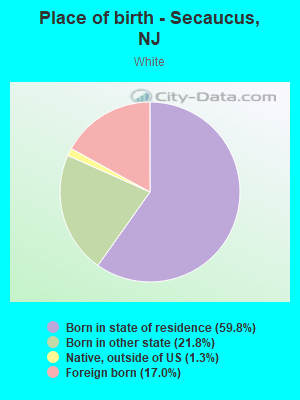
Place of birth - Born in state of residence (%) - White
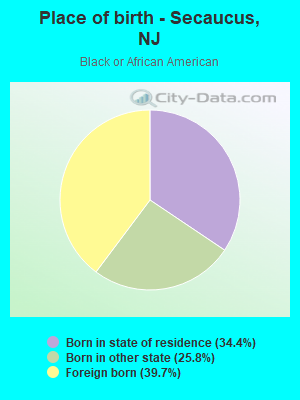
Place of birth - Born in state of residence (%) - Black or African American
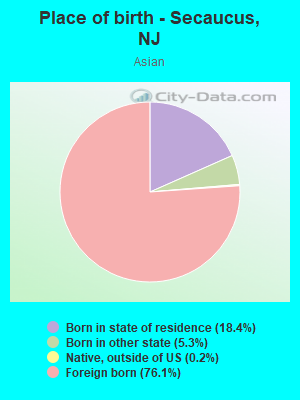
Place of birth - Born in state of residence (%) - Asian
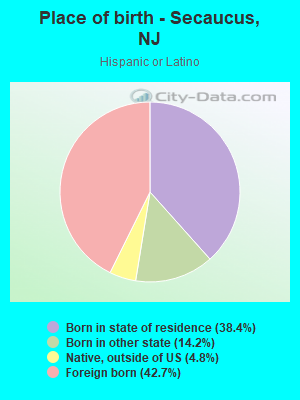
Place of birth - Born in state of residence (%) - Hispanic or Latino
Place of birth - Born in state of residence (%) - American Indian and Alaska Native
Place of birth - Born in state of residence (%) - Multirace
Place of birth - Born in state of residence (%) - Other Race
Place of birth - Born in other state (%)
Place of birth - Born in other state (%) - White
Place of birth - Born in other state (%) - Black or African American
Place of birth - Born in other state (%) - Asian
Place of birth - Born in other state (%) - Hispanic or Latino
Place of birth - Born in other state (%) - American Indian and Alaska Native
Place of birth - Born in other state (%) - Multirace
Place of birth - Born in other state (%) - Other Race
Place of birth - Native, outside of US (%)
Place of birth - Native, outside of US (%) - White
Place of birth - Native, outside of US (%) - Black or African American
Place of birth - Native, outside of US (%) - Asian
Place of birth - Native, outside of US (%) - Hispanic or Latino
Place of birth - Native, outside of US (%) - American Indian and Alaska Native
Place of birth - Native, outside of US (%) - Multirace
Place of birth - Native, outside of US (%) - Other Race
Place of birth - Foreign born (%)
Place of birth - Foreign born (%) - White
Place of birth - Foreign born (%) - Black or African American
Place of birth - Foreign born (%) - Asian
Place of birth - Foreign born (%) - Hispanic or Latino
Place of birth - Foreign born (%) - American Indian and Alaska Native
Place of birth - Foreign born (%) - Multirace
Place of birth - Foreign born (%) - Other Race
Residents speaking English at home (%)
Residents speaking English at home - Born in the United States (%)
Residents speaking English at home - Native, born elsewhere (%)
Residents speaking English at home - Foreign born (%)
Residents speaking Spanish at home (%)
Residents speaking Spanish at home - Born in the United States (%)
Residents speaking Spanish at home - Native, born elsewhere (%)
Residents speaking Spanish at home - Foreign born (%)
Residents speaking other language at home (%)
Residents speaking other language at home - Born in the United States (%)
Residents speaking other language at home - Native, born elsewhere (%)
Residents speaking other language at home - Foreign born (%)
Marital status - Never married (%)
Marital status - Now married (%)
Marital status - Separated (%)
Marital status - Widowed (%)
Marital status - Divorced (%)
Ancestries Reported - Arab (%)
Ancestries Reported - Czech (%)
Ancestries Reported - Danish (%)
Ancestries Reported - Dutch (%)
Ancestries Reported - English (%)
Ancestries Reported - French (%)
Ancestries Reported - French Canadian (%)
Ancestries Reported - German (%)
Ancestries Reported - Greek (%)
Ancestries Reported - Hungarian (%)
Ancestries Reported - Irish (%)
Ancestries Reported - Italian (%)
Ancestries Reported - Lithuanian (%)
Ancestries Reported - Norwegian (%)
Ancestries Reported - Polish (%)
Ancestries Reported - Portuguese (%)
Ancestries Reported - Russian (%)
Ancestries Reported - Scotch-Irish (%)
Ancestries Reported - Scottish (%)
Ancestries Reported - Slovak (%)
Ancestries Reported - Subsaharan African (%)
Ancestries Reported - Swedish (%)
Ancestries Reported - Swiss (%)
Ancestries Reported - Ukrainian (%)
Ancestries Reported - United States (%)
Ancestries Reported - Welsh (%)
Ancestries Reported - West Indian (%)
Ancestries Reported - Other (%)
Geographical mobility - Same house 1 year ago (%)
Geographical mobility - Same house 1 year ago (%) - White
Geographical mobility - Same house 1 year ago (%) - Black or African American
Geographical mobility - Same house 1 year ago (%) - Asian
Geographical mobility - Same house 1 year ago (%) - Hispanic or Latino
Geographical mobility - Same house 1 year ago (%) - American Indian and Alaska Native
Geographical mobility - Same house 1 year ago (%) - Multirace
Geographical mobility - Same house 1 year ago (%) - Other Race
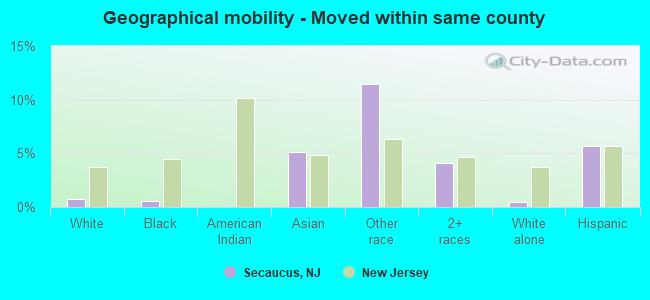
Geographical mobility - Moved within same county (%)
Geographical mobility - Moved within same county (%) - White
Geographical mobility - Moved within same county (%) - Black or African American
Geographical mobility - Moved within same county (%) - Asian
Geographical mobility - Moved within same county (%) - Hispanic or Latino
Geographical mobility - Moved within same county (%) - American Indian and Alaska Native
Geographical mobility - Moved within same county (%) - Multirace
Geographical mobility - Moved within same county (%) - Other Race
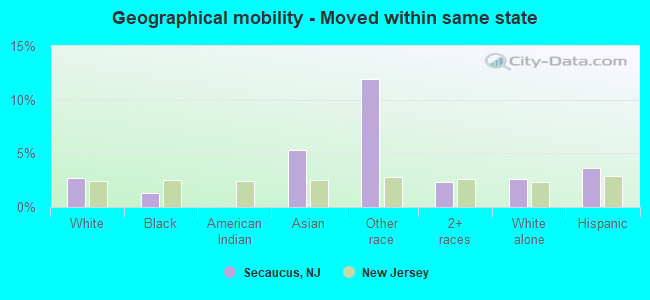
Geographical mobility - Moved from different county within same state (%)
Geographical mobility - Moved from different county within same state (%) - White
Geographical mobility - Moved from different county within same state (%) - Black or African American
Geographical mobility - Moved from different county within same state (%) - Asian
Geographical mobility - Moved from different county within same state (%) - Hispanic or Latino
Geographical mobility - Moved from different county within same state (%) - American Indian and Alaska Native
Geographical mobility - Moved from different county within same state (%) - Multirace
Geographical mobility - Moved from different county within same state (%) - Other Race
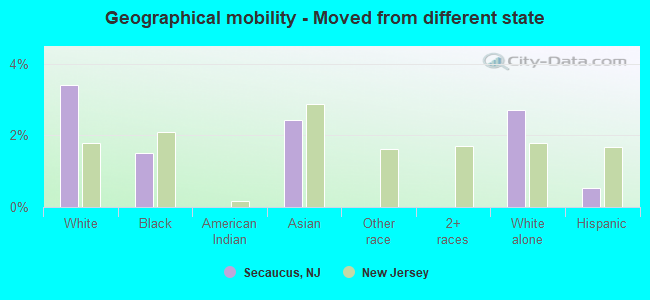
Geographical mobility - Moved from different state (%)
Geographical mobility - Moved from different state (%) - White
Geographical mobility - Moved from different state (%) - Black or African American
Geographical mobility - Moved from different state (%) - Asian
Geographical mobility - Moved from different state (%) - Hispanic or Latino
Geographical mobility - Moved from different state (%) - American Indian and Alaska Native
Geographical mobility - Moved from different state (%) - Multirace
Geographical mobility - Moved from different state (%) - Other Race
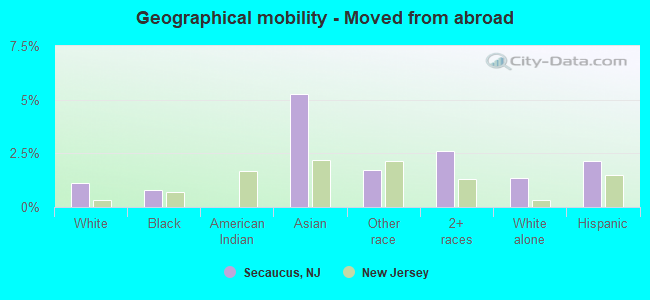
Geographical mobility - Moved from abroad (%)
Geographical mobility - Moved from abroad (%) - White
Geographical mobility - Moved from abroad (%) - Black or African American
Geographical mobility - Moved from abroad (%) - Asian
Geographical mobility - Moved from abroad (%) - Hispanic or Latino
Geographical mobility - Moved from abroad (%) - American Indian and Alaska Native
Geographical mobility - Moved from abroad (%) - Multirace
Geographical mobility - Moved from abroad (%) - Other Race
Place of birth for the foreign-born population - Ireland (%)
Place of birth for the foreign-born population - Denmark (%)
Place of birth for the foreign-born population - Norway (%)
Place of birth for the foreign-born population - Sweden (%)
Place of birth for the foreign-born population - United Kingdom (%)
Place of birth for the foreign-born population - England (%)
Place of birth for the foreign-born population - Scotland (%)
Place of birth for the foreign-born population - Other Northern Europe (%)
Place of birth for the foreign-born population - Austria (%)
Place of birth for the foreign-born population - Belgium (%)
Place of birth for the foreign-born population - France (%)
Place of birth for the foreign-born population - Germany (%)
Place of birth for the foreign-born population - Netherlands (%)
Place of birth for the foreign-born population - Switzerland (%)
Place of birth for the foreign-born population - Other Western Europe (%)
Place of birth for the foreign-born population - Greece (%)
Place of birth for the foreign-born population - Italy (%)
Place of birth for the foreign-born population - Portugal (%)
Place of birth for the foreign-born population - Spain (%)
Place of birth for the foreign-born population - Other Southern Europe (%)
Place of birth for the foreign-born population - Albania (%)
Place of birth for the foreign-born population - Belarus (%)
Place of birth for the foreign-born population - Bosnia and Herzegovina (%)
Place of birth for the foreign-born population - Bulgaria (%)
Place of birth for the foreign-born population - Croatia (%)
Place of birth for the foreign-born population - Czechoslovakia (%)
Place of birth for the foreign-born population - Hungary (%)
Place of birth for the foreign-born population - Latvia (%)
Place of birth for the foreign-born population - Lithuania (%)
Place of birth for the foreign-born population - North Macedonia (Macedonia) (%)
Place of birth for the foreign-born population - Moldova (%)
Place of birth for the foreign-born population - Poland (%)
Place of birth for the foreign-born population - Romania (%)
Place of birth for the foreign-born population - Russia (%)
Place of birth for the foreign-born population - Serbia (%)
Place of birth for the foreign-born population - Ukraine (%)
Place of birth for the foreign-born population - Other Eastern Europe (%)
Place of birth for the foreign-born population - China (%)
Place of birth for the foreign-born population - Hong Kong (%)
Place of birth for the foreign-born population - Taiwan (%)
Place of birth for the foreign-born population - Japan (%)
Place of birth for the foreign-born population - Korea (%)
Place of birth for the foreign-born population - Other Eastern Asia (%)
Place of birth for the foreign-born population - Afghanistan (%)
Place of birth for the foreign-born population - Bangladesh (%)
Place of birth for the foreign-born population - India (%)
Place of birth for the foreign-born population - Iran (%)
Place of birth for the foreign-born population - Kazakhstan (%)
Place of birth for the foreign-born population - Nepal (%)
Place of birth for the foreign-born population - Pakistan (%)
Place of birth for the foreign-born population - Sri Lanka (%)
Place of birth for the foreign-born population - Uzbekistan (%)
Place of birth for the foreign-born population - Other South Central Asia (%)
Place of birth for the foreign-born population - Burma (%)
Place of birth for the foreign-born population - Cambodia (%)
Place of birth for the foreign-born population - Indonesia (%)
Place of birth for the foreign-born population - Laos (%)
Place of birth for the foreign-born population - Malaysia (%)
Place of birth for the foreign-born population - Philippines (%)
Place of birth for the foreign-born population - Singapore (%)
Place of birth for the foreign-born population - Thailand (%)
Place of birth for the foreign-born population - Vietnam (%)
Place of birth for the foreign-born population - Other South Eastern Asia (%)
Place of birth for the foreign-born population - Armenia (%)
Place of birth for the foreign-born population - Iraq (%)
Place of birth for the foreign-born population - Israel (%)
Place of birth for the foreign-born population - Jordan (%)
Place of birth for the foreign-born population - Kuwait (%)
Place of birth for the foreign-born population - Lebanon (%)
Place of birth for the foreign-born population - Saudi Arabia (%)
Place of birth for the foreign-born population - Syria (%)
Place of birth for the foreign-born population - Turkey (%)
Place of birth for the foreign-born population - Yemen (%)
Place of birth for the foreign-born population - Other Western Asia (%)
Place of birth for the foreign-born population - Eritrea (%)
Place of birth for the foreign-born population - Ethiopia (%)
Place of birth for the foreign-born population - Kenya (%)
Place of birth for the foreign-born population - Somalia (%)
Place of birth for the foreign-born population - Uganda (%)
Place of birth for the foreign-born population - Zimbabwe (%)
Place of birth for the foreign-born population - Other Eastern Africa (%)
Place of birth for the foreign-born population - Cameroon (%)
Place of birth for the foreign-born population - Congo (%)
Place of birth for the foreign-born population - Democratic Republic of Congo (Zaire) (%)
Place of birth for the foreign-born population - Other Middle Africa (%)
Place of birth for the foreign-born population - Egypt (%)
Place of birth for the foreign-born population - Morocco (%)
Place of birth for the foreign-born population - Sudan (%)
Place of birth for the foreign-born population - Other Northern Africa (%)
Place of birth for the foreign-born population - South Africa (%)
Place of birth for the foreign-born population - Other Southern Africa (%)
Place of birth for the foreign-born population - Cabo Verde (%)
Place of birth for the foreign-born population - Ghana (%)
Place of birth for the foreign-born population - Liberia (%)
Place of birth for the foreign-born population - Nigeria (%)
Place of birth for the foreign-born population - Senegal (%)
Place of birth for the foreign-born population - Sierra Leone (%)
Place of birth for the foreign-born population - Other Western Africa (%)
Place of birth for the foreign-born population - Australia (%)
Place of birth for the foreign-born population - New Zealand (%)
Place of birth for the foreign-born population - Fiji (%)
Place of birth for the foreign-born population - Micronesia (%)
Place of birth for the foreign-born population - Bahamas (%)
Place of birth for the foreign-born population - Barbados (%)
Place of birth for the foreign-born population - Cuba (%)
Place of birth for the foreign-born population - Dominica (%)
Place of birth for the foreign-born population - Dominican Republic (%)
Place of birth for the foreign-born population - Grenada (%)
Place of birth for the foreign-born population - Haiti (%)
Place of birth for the foreign-born population - Jamaica (%)
Place of birth for the foreign-born population - St. Vincent and the Grenadines (%)
Place of birth for the foreign-born population - Trinidad and Tobago (%)
Place of birth for the foreign-born population - West Indies (%)
Place of birth for the foreign-born population - Other Caribbean (%)
Place of birth for the foreign-born population - Belize (%)
Place of birth for the foreign-born population - Costa Rica (%)
Place of birth for the foreign-born population - El Salvador (%)
Place of birth for the foreign-born population - Guatemala (%)
Place of birth for the foreign-born population - Honduras (%)
Place of birth for the foreign-born population - Mexico (%)
Place of birth for the foreign-born population - Nicaragua (%)
Place of birth for the foreign-born population - Panama (%)
Place of birth for the foreign-born population - Other Central America (%)
Place of birth for the foreign-born population - Argentina (%)
Place of birth for the foreign-born population - Bolivia (%)
Place of birth for the foreign-born population - Brazil (%)
Place of birth for the foreign-born population - Chile (%)
Place of birth for the foreign-born population - Colombia (%)
Place of birth for the foreign-born population - Ecuador (%)
Place of birth for the foreign-born population - Guyana (%)
Place of birth for the foreign-born population - Peru (%)
Place of birth for the foreign-born population - Uruguay (%)
Place of birth for the foreign-born population - Venezuela (%)
Place of birth for the foreign-born population - Other South America (%)
Place of birth for the foreign-born population - Canada (%)
Place of birth for the foreign-born population - Other Northern America (%)
Place of birth for the foreign-born population - Other (%)
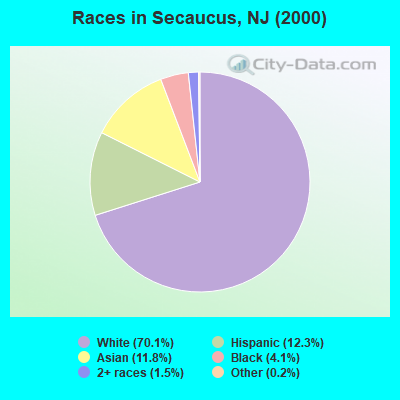
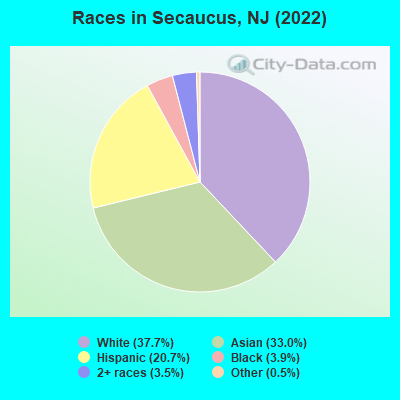
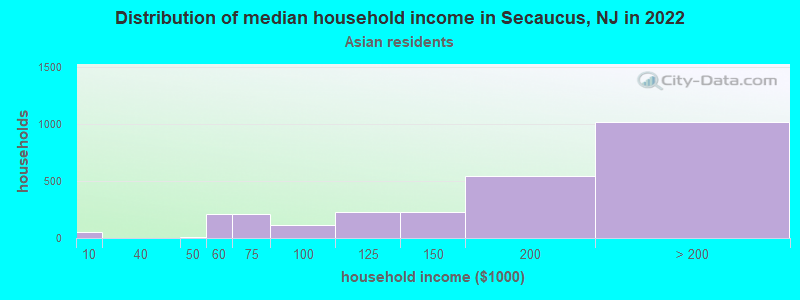
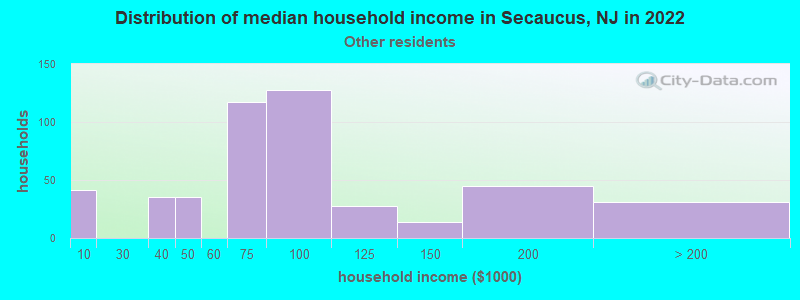
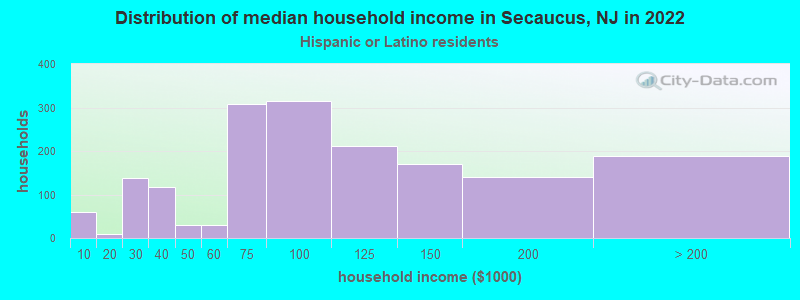
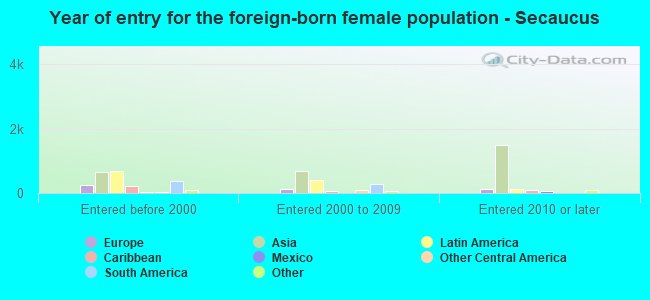
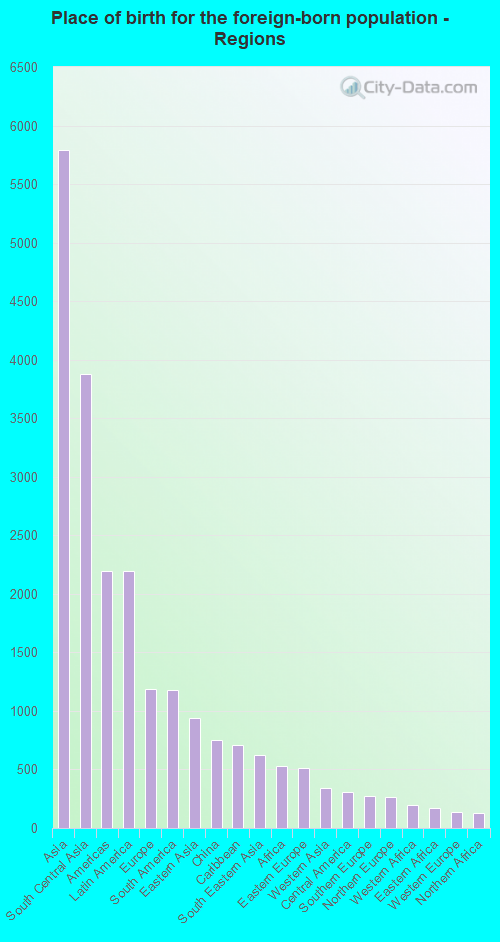
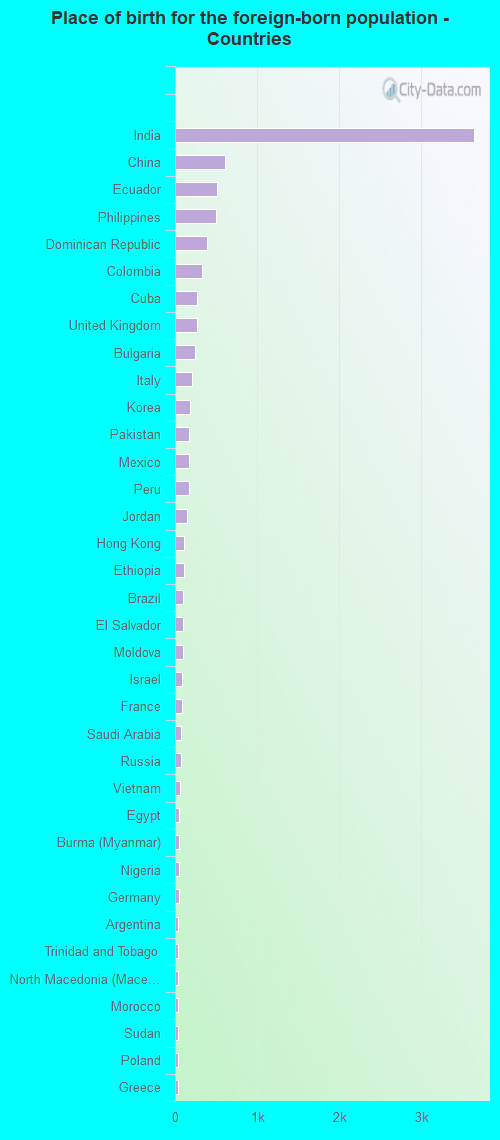
According to 2022 data, the most numerous races in Secaucus, NJ are White alone (7,995 residents), Hispanic (4,386 residents), and Black alone (818 residents). 48.7% of Secaucus residents speak English at home. 45.9% of Secaucus, NJ residents are foreign-born (26.5% born in Asia, 10.1% born in Latin America, 5.5% born in Europe), which is 49.8% greater than the foreign-born rate of 23.0% across the entire state of New Jersey.
Race distribution in Secaucus
2000 2022
5,557,209 66.0% White alone 1,117,191 13.3% Hispanic 1,096,171 13.0% Black alone 477,012 5.7% Asian alone 133,689 1.6% Two or more races 19,565 0.2% Other race alone 11,338 0.1% American Indian alone 2,175 0.03% Native Hawaiian and Other
4,766,476 51.5% White alone 2,028,470 21.9% Hispanic 1,111,632 12.0% Black alone 923,546 10.0% Asian alone 332,237 3.6% Two or more races 89,847 1.0% Other race alone 8,557 0.09% American Indian alone 934 0.01% Native Hawaiian and Other
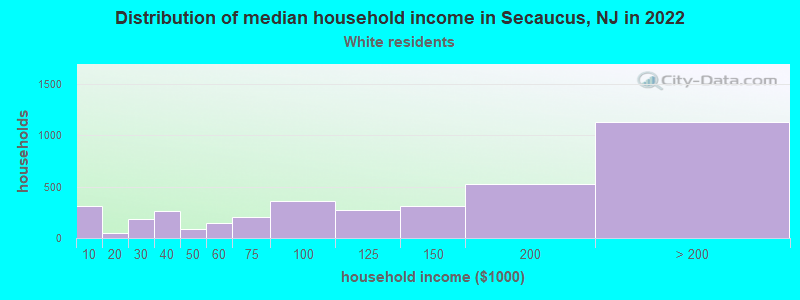
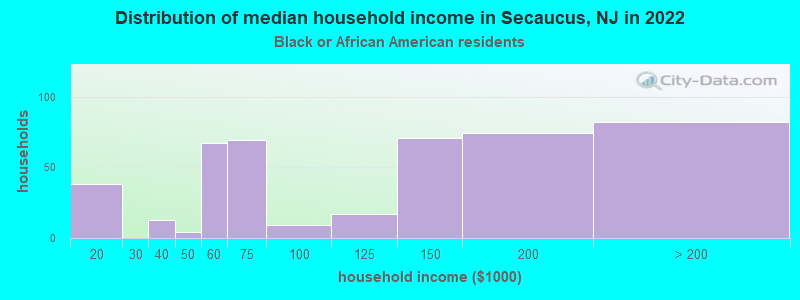
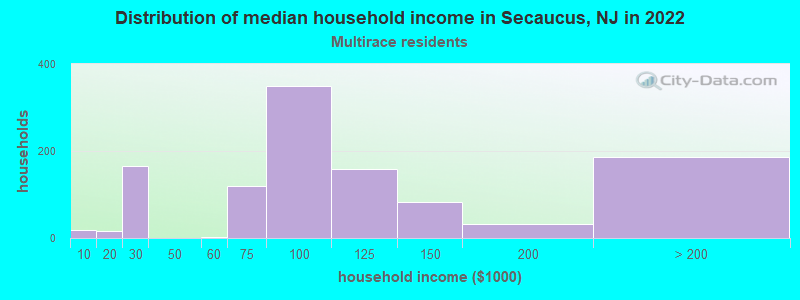
Income and house value in Secaucus Median household income in 2022 $118,609 White non-Hispanic householders$125,987 Black householders$175,512 Asian householders$81,268 Some other race householders$91,210 Two or more races householders$88,501 Hispanic or Latino race householdersMedian 2022 house value $609,546 White Non-Hispanic householders$605,453 Black or African American householders $607,500 Asian householders$485,590 Some other race householders$603,992 Two or more races householders$708,945 Hispanic or Latino householders
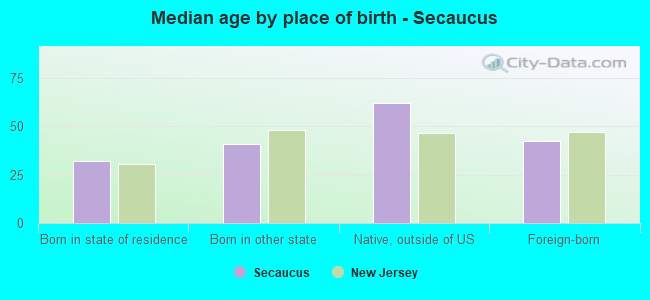
Median age by race in Secaucus
48.6 Median age for White residents45.2 51.6 38.0 Median age for Black or African American residents37.2 44.9 -705,128,204.4 Median age for American Indian / Alaska Native residents-666,666,666.0 -678,632,478.0 33.6 Median age for Asian residents34.6 32.8 -804,177,544.9 Median age for Native Hawaiian / Pacific Islander residents-860,335,194.7 -713,070,378.3 34.1 Median age for Other race residents33.1 35.0 40.8 Median age for Two or more races residents38.3 44.0 51.1 Median age for White alone residents47.0 54.5 36.1 Median age for Hispanic or Latino residents32.3 45.0
Owner/renter occupied households by race in Secaucus
House owners and renters - White residents 2,340 62.0% Owner occupied1,437 38.0% Renter occupiedHouse owners and renters - Black or African American residents 76 16.6% Owner occupied380 83.4% Renter occupiedHouse owners and renters - American Indian / Alaska Native residents 25 100.0% Renter occupiedHouse owners and renters - Asian residents 1,143 43.6% Owner occupied1,478 56.4% Renter occupiedHouse owners and renters - Other race residents 242 46.3% Owner occupied280 53.7% Renter occupiedHouse owners and renters - Two or more races residents 463 39.4% Owner occupied713 60.6% Renter occupiedHouse owners and renters - White alone residents 2,536 64.0% Owner occupied1,428 36.0% Renter occupiedHouse owners and renters - Hispanic or Latino residents 691 40.2% Owner occupied1,029 59.8% Renter occupied
Language usage in Secaucus
English speakers - Total 48.7% of residents of Secaucus speak English at home.
15.2% of residents speak Spanish at home 2,031 66.0% Speak English very well1,046 34.0% Speak English less than very well36.1% of residents speak other language at home 5,581 76.4% Speak English very well1,721 23.6% Speak English less than very well
English speakers - Born in the United States 69.5% of residents of Secaucus speak English at home.
19.6% of residents speak Spanish at home 593 100.0% Speak English very well9.6% of residents speak other language at home 283 97.9% Speak English very well6 2.1% Speak English less than very well
English speakers - Native, born elsewhere 50.3% of residents of Secaucus speak English at home.
21.2% of residents speak Spanish at home 46 68.7% Speak English very well21 31.3% Speak English less than very well27.5% of residents speak other language at home 79 90.8% Speak English very well8 9.2% Speak English less than very well
English speakers - Foreign-born 12.3% of residents of Secaucus speak English at home.
19.9% of residents speak Spanish at home 852 46.6% Speak English very well976 53.4% Speak English less than very well66.9% of residents speak other language at home 4,530 73.6% Speak English very well1,628 26.4% Speak English less than very well
White (Caucasian) - Speak only English Native:
100.0% (6,125)Foreign-born:
37.7% (485)
White (Caucasian) - Speak another language Native:
6.4% (392)Foreign-born:
70.5% (908)
Black or African American - Speak only English Native:
98.5% (440)Foreign-born:
54.5% (183)
Black or African American - Speak another language Native:
3.6% (16)Foreign-born:
46.5% (156)
Asian - Speak only English Native:
41.5% (555)Foreign-born:
4.5% (243)
Asian - Speak another language Native:
54.2% (723)Foreign-born:
95.0% (5,102)
Other race - Speak only English Native:
18.3% (124)Foreign-born:
3.4% (25)
Other race - Speak another language Native:
82.5% (559)Foreign-born:
95.9% (700)
Two or more races - Speak only English Native:
57.4% (967)Foreign-born:
11.4% (139)
Two or more races - Speak another language Native:
42.7% (720)Foreign-born:
88.8% (1,088)
White alone - Speak only English Native:
94.4% (5,901)Foreign-born:
36.4% (542)
White alone - Speak another language Native:
5.8% (363)Foreign-born:
66.5% (988)
Hispanic or Latino - Speak only English Native:
52.7% (1,245)Foreign-born:
4.6% (87)
Hispanic or Latino - Speak another language Native:
49.4% (1,168)Foreign-born:
94.9% (1,780)
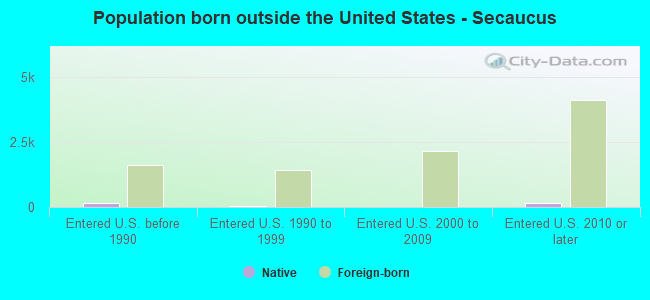
Foreign-born residents in Secaucus 9,725 residents are foreign born (26.5% Asia , 10.1% Latin America , 5.5% Europe ).
This city:
45.9%New Jersey:
23.2%
Marital status for residents in Secaucus Marital status - White (Caucasian) population 15 years and over
Males 42.1% Never married45.3% Now married0.0% Separated3.1% Widowed9.5% DivorcedFemales 25.8% Never married47.2% Now married1.9% Separated15.0% Widowed10.2% DivorcedWomen who gave birth in the past 12 months Now married:
100.0% (117)Unmarried:
0.0% (0)
Women who did not give birth in the past 12 months Now married:
49.9% (580)Unmarried:
50.1% (583)
Marital status - Black or African American population 15 years and over
Males 62.7% Never married17.6% Now married5.4% Separated1.6% Widowed12.7% DivorcedFemales 58.3% Never married26.8% Now married0.0% Separated1.1% Widowed13.8% DivorcedWomen who gave birth in the past 12 months Now married:
25.0% (15)Unmarried:
75.0% (44)
Women who did not give birth in the past 12 months Now married:
38.5% (82)Unmarried:
61.5% (131)
Marital status - Asian population 15 years and over
Males 15.1% Never married84.7% Now married0.2% Separated0.0% Widowed0.0% DivorcedFemales 13.5% Never married74.7% Now married0.6% Separated6.0% Widowed5.2% DivorcedWomen who gave birth in the past 12 months Now married:
100.0% (105)Unmarried:
0.0% (0)
Women who did not give birth in the past 12 months Now married:
78.6% (1,755)Unmarried:
21.4% (478)
Marital status - Other race population 15 years and over
Males 47.7% Never married52.3% Now married0.0% Separated0.0% Widowed0.0% DivorcedFemales 36.6% Never married28.5% Now married11.5% Separated5.7% Widowed17.8% DivorcedWomen who did not give birth in the past 12 months Now married:
46.2% (153)Unmarried:
53.8% (178)
Marital status - Two or more races population 15 years and over
Males 30.8% Never married54.6% Now married0.5% Separated3.1% Widowed11.1% DivorcedFemales 23.9% Never married29.1% Now married0.9% Separated17.0% Widowed29.2% DivorcedWomen who did not give birth in the past 12 months Now married:
42.4% (248)Unmarried:
57.6% (337)
Marital status - White alone, not Hispanic / Latino population 15 years and over
Males 39.9% Never married45.9% Now married0.0% Separated3.5% Widowed10.7% DivorcedFemales 25.7% Never married49.7% Now married1.0% Separated15.4% Widowed8.2% DivorcedWomen who gave birth in the past 12 months Now married:
100.0% (145)Unmarried:
0.0% (0)
Women who did not give birth in the past 12 months Now married:
51.1% (572)Unmarried:
48.9% (547)
Marital status - Hispanic or Latino population 15 years and over
Males 50.3% Never married42.3% Now married0.2% Separated1.1% Widowed6.0% DivorcedFemales 29.1% Never married26.2% Now married5.7% Separated12.2% Widowed26.8% DivorcedWomen who did not give birth in the past 12 months Now married:
36.1% (315)Unmarried:
63.9% (559)
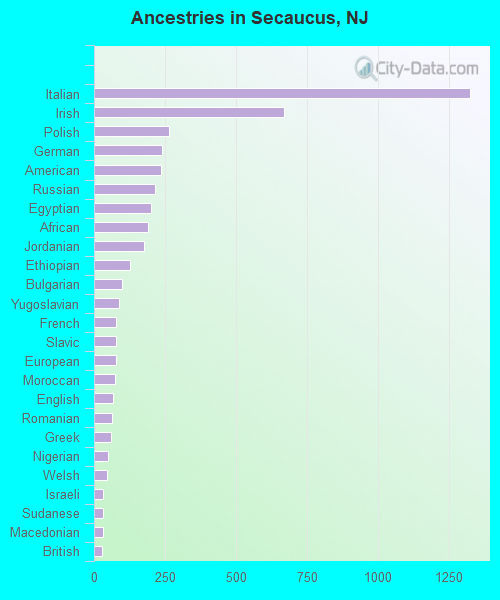
Ancestries in Secaucus
1,326 9.7% Italian669 4.9% Irish263 1.9% Polish240 1.7% German236 1.7% American216 1.6% Russian200 1.5% Egyptian191 1.4% African176 1.3% Jordanian127 0.9% Ethiopian98 0.7% Bulgarian87 0.6% Yugoslavian78 0.6% French78 0.6% Slavic78 0.6% European73 0.5% Moroccan66 0.5% English63 0.5% Romanian59 0.4% Greek48 0.3% Nigerian46 0.3% Welsh33 0.2% Israeli31 0.2% Sudanese30 0.2% Macedonian27 0.2% British27 0.2% Eastern European26 0.2% Trinidadian and Tobagonian25 0.2% Albanian21 0.2% Syrian21 0.2% Iranian17 0.1% Portuguese13 0.09% Palestinian8 0.06% Jamaican6 0.04% Arab5 0.04% Scotch-Irish
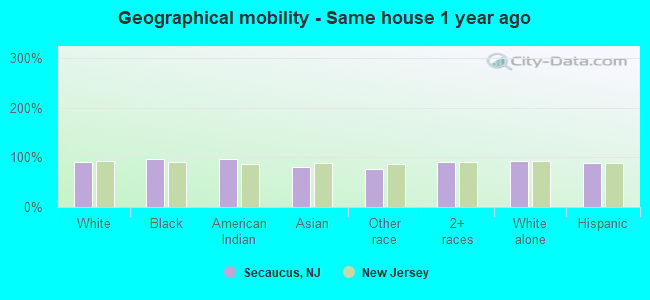
Geographical mobility in Secaucus Same house 1 year ago 6,689 90.9% White (Caucasian)897 96.4% Black or African American27 96.6% American Indian / Alaska Native5,666 80.9% Asian1,179 76.7% Other race2,700 90.7% Two or more races7,307 92.2% White alone, not Hispanic / Latino3,848 88.1% Hispanic or LatinoMoved within same county 54 0.7% White / Caucasian5 0.5% Black or African American359 5.1% Asian176 11.4% Other race123 4.1% Two or more races38 0.5% White alone, not Hispanic / Latino249 5.7% Hispanic or LatinoMoved within same state 202 2.7% White / Caucasian12 1.3% Black or African American374 5.3% Asian183 11.9% Other race70 2.3% Two or more races208 2.6% White alone, not Hispanic / Latino158 3.6% Hispanic or LatinoMoved from different state 250 3.4% White / Caucasian14 1.5% Black or African American170 2.4% Asian216 2.7% White alone, not Hispanic / Latino23 0.5% Hispanic or LatinoMoved from abroad 83 1.1% White7 0.8% Black or African American367 5.2% Asian26 1.7% Other race77 2.6% Two or more races106 1.3% White alone, not Hispanic / Latino94 2.2% Hispanic or Latino
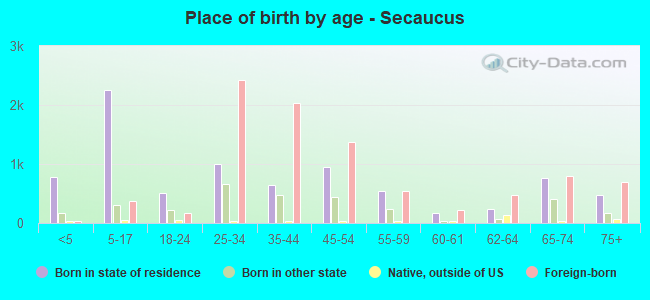
Children Nativity (place of birth) in Secaucus
Children under 6 years - Living with two parents Both parents native 176 100.0% NativeBoth parents foreign-born 692 96.1% Native28 3.9% Foreign-bornOne native, one foreign-born parent 57 62.9% Native34 37.1% Foreign-bornChildren under 6 years - Living with one parent Native parent 51 100.0% NativeForeign-born parent 102 100.0% NativeChildren 6 to 17 years - Living with two parents Both parents native 708 100.0% NativeBoth parents foreign-born 1,070 83.3% Native215 16.7% Foreign-bornOne native, one foreign-born parent 288 100.0% NativeChildren 6 to 17 years - Living with one parent Native parent 287 88.1% Native39 11.9% Foreign-bornForeign-born parent 124 68.0% Native58 32.0% Foreign-born
Grandparents responsible for own grandchildren in Secaucus
Grandparents (30 to 59 years) White / Caucasian 34 100.0% Not responsible for grandchildrenAsian 8 100.0% Responsible for grandchildrenWhite alone, not Hispanic / Latino 45 100.0% Not responsible for grandchildrenGrandparents (60 years and over) White / Caucasian 91 100.0% Not responsible for grandchildrenAsian 22 10.5% Responsible for grandchildren186 89.5% Not responsible for grandchildrenWhite alone, not Hispanic / Latino 84 100.0% Not responsible for grandchildren