Races in Sauk Rapids, Minnesota (MN) Detailed Stats
Ancestries, Foreign-born residents, place of birth
Settings
X


Recent posts about races in Sauk Rapids, Minnesota on our local forum with over 2,400,000 registered users:
 | What’s Saint Cloud like? (37 replies) |
| Where to live(St Cloud area)? (5 replies) |
| St. Cloud, Minnesota: Large family relocation? (40 replies) |
| ***How is the Princeton, Monticello, Zimmerman areas for retirement? (25 replies) |
| Annandale? Becker? Big Lake? Kimball? (15 replies) |
| St. Cloud area, looking to rent, maybe rent-to-buy (10 replies) |
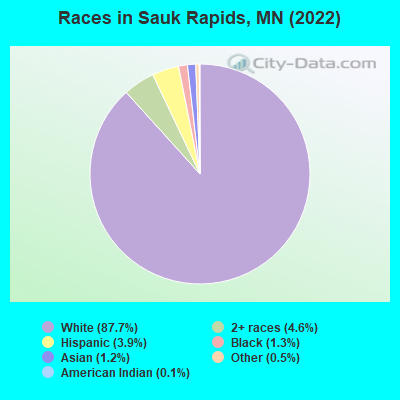
According to 2022 data, the most numerous races in Sauk Rapids, MN are White alone (12,181 residents), Black alone (181 residents), and Hispanic (542 residents). 94.2% of Sauk Rapids residents speak English at home. 4.3% of Sauk Rapids, MN residents are foreign-born (1.6% born in Asia, 1.6% born in Latin America, 0.6% born in Europe), which is 86.3% less than the foreign-born rate of 8.0% across the entire state of Minnesota.
Race distribution in Sauk Rapids
2000
2022

- 9,84896.4%White alone
- 1101.1%Hispanic
- 800.8%Asian alone
- 830.8%Two or more races
- 580.6%Black alone
- 270.3%American Indian alone
- 40.04%Native Hawaiian and Other
Pacific Islander alone - 30.03%Other race alone

-
- 12,18187.7%White alone
- 6424.6%Two or more races
- 5423.9%Hispanic
- 1811.3%Black alone
- 1631.2%Asian alone
- 760.5%Other race alone
- 140.1%American Indian alone
2000
2022
-
- 4,337,14388.2%White alone
- 168,8133.4%Black alone
- 143,3822.9%Hispanic
- 141,0832.9%Asian alone
- 70,3041.4%Two or more races
- 52,0091.1%American Indian alone
- 5,0310.1%Other race alone
- 1,7140.03%Native Hawaiian and Other
Pacific Islander alone

-
- 4,356,34776.2%White alone
- 395,1796.9%Black alone
- 333,8305.8%Hispanic
- 294,8005.2%Asian alone
- 259,6494.5%Two or more races
- 42,1250.7%American Indian alone
- 32,9760.6%Other race alone
- 2,2780.04%Native Hawaiian and Other
Pacific Islander alone

Income and house value in Sauk Rapids
- Median household income in 2022
- $63,367White non-Hispanic householders
- $50,300Black householders
- $74,153Some other race householders
- $48,028Two or more races householders
- $69,238Hispanic or Latino race householders
- Median 2022 house value
- $249,644White Non-Hispanic householders
- $223,761Black or African American householders
- $287,381American Indian or Alaska Native householders
- $332,617Asian householders
- $272,141Some other race householders
- $330,198Two or more races householders
- $332,617Hispanic or Latino householders
Household income for White non-Hispanic householders

Household income for Black householders

Household income for Asian householders

Household income for Some other race householders

Household income for Two or more races householders

Household income for Hispanic or Latino race householders

Median age by race in Sauk Rapids
- 36.7Median age for White residents
- 36.1Males
- 37.0Females
- 30.6Median age for Black or African American residents
- 31.3Males
- 15.1Females
- 21.9Median age for American Indian / Alaska Native residents
- 21.2Males
- -677,852,348.3Females
- 31.2Median age for Asian residents
- 21.1Males
- 31.7Females
- -744,336,568.8Median age for Native Hawaiian / Pacific Islander residents
- -856,799,036.4Males
- -534,959,349.1Females
- 27.4Median age for Other race residents
- 30.0Males
- 22.9Females
- 14.3Median age for Two or more races residents
- 15.0Males
- 14.8Females
- 36.6Median age for White alone residents
- 36.2Males
- 36.7Females
- 25.4Median age for Hispanic or Latino residents
- 24.3Males
- 30.4Females
Owner/renter occupied households by race in Sauk Rapids
- House owners and renters - White residents
- 3,21963.9%Owner occupied
- 1,81836.1%Renter occupied
- House owners and renters - Black or African American residents
- 1922.6%Owner occupied
- 6677.4%Renter occupied
- House owners and renters - American Indian / Alaska Native residents
- 3100.0%Renter occupied
- House owners and renters - Asian residents
- 6478.9%Owner occupied
- 1721.1%Renter occupied
- House owners and renters - Other race residents
- 3222.9%Owner occupied
- 10677.1%Renter occupied
- House owners and renters - Two or more races residents
- 6051.0%Owner occupied
- 5849.0%Renter occupied
- House owners and renters - White alone residents
- 3,22464.1%Owner occupied
- 1,80535.9%Renter occupied
- House owners and renters - Hispanic or Latino residents
- 3221.1%Owner occupied
- 12078.9%Renter occupied
Language usage in Sauk Rapids
- English speakers - Total
- 94.2% of residents of Sauk Rapids speak English at home.
- 2.4% of residents speak Spanish at home
- 17254.8%Speak English very well
- 14245.2%Speak English less than very well
- 3.2% of residents speak other language at home
- 36185.5%Speak English very well
- 6114.5%Speak English less than very well
- English speakers - Born in the United States
- 96.7% of residents of Sauk Rapids speak English at home.
- 1.1% of residents speak Spanish at home
- 1043.5%Speak English very well
- 1356.5%Speak English less than very well
- 2.0% of residents speak other language at home
- 43100.0%Speak English very well
- English speakers - Native, born elsewhere
- 68.0% of residents of Sauk Rapids speak English at home.
- 36.0% of residents speak Spanish at home
- 1222.2%Speak English very well
- 4277.8%Speak English less than very well
- English speakers - Foreign-born
- 33.9% of residents of Sauk Rapids speak English at home.
- 27.9% of residents speak Spanish at home
- 13279.5%Speak English very well
- 3420.5%Speak English less than very well
- 34.9% of residents speak other language at home
- 17282.7%Speak English very well
- 3617.3%Speak English less than very well
White (Caucasian) - Speak only English
| Native: | 98.2% (11,144) |
| Foreign-born: | 49.3% (86) |
White (Caucasian) - Speak another language
| Native: | 1.8% (210) |
| Foreign-born: | 53.6% (93) |
Asian - Speak only English
| Native: | 76.1% (61) |
| Foreign-born: | 80.1% (63) |
Asian - Speak another language
| Native: | 28.1% (22) |
| Foreign-born: | 17.0% (13) |
Other race - Speak only English
| Native: | 52.4% (82) |
| Foreign-born: | 22.6% (62) |
Other race - Speak another language
| Native: | 47.8% (74) |
| Foreign-born: | 78.8% (218) |
White alone - Speak only English
| Native: | 98.3% (11,079) |
| Foreign-born: | 40.9% (90) |
White alone - Speak another language
| Native: | 1.7% (194) |
| Foreign-born: | 58.9% (130) |
Hispanic or Latino - Speak only English
| Native: | 54.5% (137) |
| Foreign-born: | 24.3% (56) |
Hispanic or Latino - Speak another language
| Native: | 45.2% (114) |
| Foreign-born: | 78.3% (180) |
Foreign-born residents in Sauk Rapids
596 residents are foreign born (1.6% Asia, 1.6% Latin America, 0.6% Europe).
| This city: | 4.3% |
| Minnesota: | 8.5% |


Marital status for residents in Sauk Rapids
Marital status - White (Caucasian) population 15 years and over
- Males
- 36.9%Never married
- 49.1%Now married
- 0.0%Separated
- 2.2%Widowed
- 11.7%Divorced
- Females
- 32.5%Never married
- 46.1%Now married
- 0.7%Separated
- 7.5%Widowed
- 13.2%Divorced
Women who gave birth in the past 12 months
| Now married: | 81.2% (88) |
| Unmarried: | 18.8% (20) |
Women who did not give birth in the past 12 months
| Now married: | 43.3% (1,243) |
| Unmarried: | 56.7% (1,629) |
Marital status - Black or African American population 15 years and over
- Males
- 66.0%Never married
- 0.0%Now married
- 17.0%Separated
- 17.0%Widowed
- 0.0%Divorced
- Females
- 31.4%Never married
- 68.6%Now married
- 0.0%Separated
- 0.0%Widowed
- 0.0%Divorced
Women who did not give birth in the past 12 months
| Now married: | 68.6% (25) |
| Unmarried: | 31.4% (11) |
Marital status - American Indian / Alaska Native population 15 years and over
- Males
- 100.0%Never married
- 0.0%Now married
- 0.0%Separated
- 0.0%Widowed
- 0.0%Divorced
- Females
- 66.7%Never married
- 33.3%Now married
- 0.0%Separated
- 0.0%Widowed
- 0.0%Divorced
Women who did not give birth in the past 12 months
| Now married: | 0.0% (0) |
| Unmarried: | 100.0% (2) |
Marital status - Asian population 15 years and over
- Males
- 69.0%Never married
- 31.0%Now married
- 0.0%Separated
- 0.0%Widowed
- 0.0%Divorced
- Females
- 33.0%Never married
- 44.7%Now married
- 0.0%Separated
- 0.0%Widowed
- 22.3%Divorced
Women who did not give birth in the past 12 months
| Now married: | 51.2% (43) |
| Unmarried: | 48.8% (41) |
Marital status - Other race population 15 years and over
- Males
- 43.0%Never married
- 50.9%Now married
- 6.1%Separated
- 0.0%Widowed
- 0.0%Divorced
- Females
- 53.7%Never married
- 46.3%Now married
- 0.0%Separated
- 0.0%Widowed
- 0.0%Divorced
Women who did not give birth in the past 12 months
| Now married: | 46.3% (81) |
| Unmarried: | 53.7% (94) |
Marital status - Two or more races population 15 years and over
- Males
- 76.3%Never married
- 15.1%Now married
- 0.0%Separated
- 0.0%Widowed
- 8.6%Divorced
- Females
- 45.3%Never married
- 54.7%Now married
- 0.0%Separated
- 0.0%Widowed
- 0.0%Divorced
Women who did not give birth in the past 12 months
| Now married: | 44.7% (55) |
| Unmarried: | 55.3% (68) |
Marital status - White alone, not Hispanic / Latino population 15 years and over
- Males
- 36.5%Never married
- 49.4%Now married
- 0.0%Separated
- 2.3%Widowed
- 11.9%Divorced
- Females
- 32.4%Never married
- 46.2%Now married
- 0.5%Separated
- 7.6%Widowed
- 13.4%Divorced
Women who gave birth in the past 12 months
| Now married: | 81.2% (89) |
| Unmarried: | 18.8% (21) |
Women who did not give birth in the past 12 months
| Now married: | 43.3% (1,243) |
| Unmarried: | 56.7% (1,628) |
Marital status - Hispanic or Latino population 15 years and over
- Males
- 51.8%Never married
- 43.9%Now married
- 4.4%Separated
- 0.0%Widowed
- 0.0%Divorced
- Females
- 49.7%Never married
- 45.2%Now married
- 5.1%Separated
- 0.0%Widowed
- 0.0%Divorced
Women who did not give birth in the past 12 months
| Now married: | 46.0% (80) |
| Unmarried: | 54.0% (94) |
Ancestries in Sauk Rapids

- 2,43146.4%German
- 3526.7%Norwegian
- 2013.8%American
- 1933.7%Polish
- 1873.6%English
- 1482.8%Scandinavian
- 1282.4%Irish
- 1222.3%Finnish
- 1011.9%Italian
- 831.6%European
- 711.4%Nigerian
- 601.1%Swedish
- 480.9%Czech
- 410.8%Danish
- 370.7%Iraqi
- 340.6%Portuguese
- 330.6%Slovene
- 280.5%French
- 230.4%Russian
- 200.4%French Canadian
- 170.3%Arab
- 170.3%Somali
- 150.3%Swiss
- 90.2%Dutch
- 90.2%Scottish
- 70.1%Serbian

Geographical mobility in Sauk Rapids

- Same house 1 year ago
- 10,45386.6%White (Caucasian)
- 6334.8%Black or African American
- 1965.5%American Indian / Alaska Native
- 12375.5%Asian
- 34767.2%Other race
- 57184.2%Two or more races
- 10,47987.0%White alone, not Hispanic / Latino
- 33361.3%Hispanic or Latino

-
- Moved within same county
- 4523.8%White / Caucasian
- 489.3%Other race
- 344.9%Two or more races
- 4453.7%White alone, not Hispanic / Latino
- 6612.1%Hispanic or Latino

-
- Moved within same state
- 7846.5%White / Caucasian
- 10558.3%Black or African American
- 1138.1%American Indian / Alaska Native
- 4124.9%Asian
- 8616.6%Other race
- 679.9%Two or more races
- 7456.2%White alone, not Hispanic / Latino
- 12723.3%Hispanic or Latino

-
- Moved from different state
- 3993.3%White / Caucasian
- 244.7%Other race
- 4073.4%White alone, not Hispanic / Latino
- 244.5%Hispanic or Latino

-
- Moved from abroad
- 30.0%White
- 30.0%White alone, not Hispanic / Latino

Children Nativity (place of birth) in Sauk Rapids
Place of birth for residents in Sauk Rapids
![Place of birth for the foreign-born population - Regions]()
- 242Americas
- 231Asia
- 231Latin America
- 213Central America
- 141Western Asia
- 86Europe
- 52Eastern Europe
- 46Eastern Asia
- 35Africa
- 33South Eastern Asia
- 23China
- 20Western Europe
- 18South America
- 17Eastern Africa
- 17Western Africa
- 13Northern Europe
- 10South Central Asia
- 10Northern America

![Place of birth for the foreign-born population - Countries]()
- 187Mexico
- 122Iraq
- 43Russia
- 33Vietnam
- 25Guatemala
- 23China
- 22Korea
- 20Germany
- 19Lebanon
- 18Brazil
- 17Somalia
- 17Nigeria
- 10Ireland
- 10Kazakhstan
- 10Canada
- 9Serbia
- 3Denmark

Grandparents responsible for own grandchildren in Sauk Rapids
Zip codes: 56379.