Races in Sanford, Florida (FL) Detailed Stats
Data:
Races - White alone (%)
Races - White alone (% change since 2000)
Races - Black alone (%)
Races - Black alone (% change since 2000)
Races - American Indian alone (%)
Races - American Indian alone (% change since 2000)
Races - Asian alone (%)
Races - Asian alone (% change since 2000)
Races - Hispanic (%)
Races - Hispanic (% change since 2000)
Races - Native Hawaiian and Other Pacific Islander alone (%)
Races - Native Hawaiian and Other Pacific Islander alone (% change since 2000)
Races - Two or more races(%)
Races - Two or more races(% change since 2000)
Races - Other race alone (%)
Races - Other race alone (% change since 2000)
Racial diversity
Place of birth - Born in state of residence (%)
Place of birth - Born in state of residence (%) - White
Place of birth - Born in state of residence (%) - Black or African American
Place of birth - Born in state of residence (%) - Asian
Place of birth - Born in state of residence (%) - Hispanic or Latino
Place of birth - Born in state of residence (%) - American Indian and Alaska Native
Place of birth - Born in state of residence (%) - Multirace
Place of birth - Born in state of residence (%) - Other Race
Place of birth - Born in other state (%)
Place of birth - Born in other state (%) - White
Place of birth - Born in other state (%) - Black or African American
Place of birth - Born in other state (%) - Asian
Place of birth - Born in other state (%) - Hispanic or Latino
Place of birth - Born in other state (%) - American Indian and Alaska Native
Place of birth - Born in other state (%) - Multirace
Place of birth - Born in other state (%) - Other Race
Place of birth - Native, outside of US (%)
Place of birth - Native, outside of US (%) - White
Place of birth - Native, outside of US (%) - Black or African American
Place of birth - Native, outside of US (%) - Asian
Place of birth - Native, outside of US (%) - Hispanic or Latino
Place of birth - Native, outside of US (%) - American Indian and Alaska Native
Place of birth - Native, outside of US (%) - Multirace
Place of birth - Native, outside of US (%) - Other Race
Place of birth - Foreign born (%)
Place of birth - Foreign born (%) - White
Place of birth - Foreign born (%) - Black or African American
Place of birth - Foreign born (%) - Asian
Place of birth - Foreign born (%) - Hispanic or Latino
Place of birth - Foreign born (%) - American Indian and Alaska Native
Place of birth - Foreign born (%) - Multirace
Place of birth - Foreign born (%) - Other Race
Residents speaking English at home (%)
Residents speaking English at home - Born in the United States (%)
Residents speaking English at home - Native, born elsewhere (%)
Residents speaking English at home - Foreign born (%)
Residents speaking Spanish at home (%)
Residents speaking Spanish at home - Born in the United States (%)
Residents speaking Spanish at home - Native, born elsewhere (%)
Residents speaking Spanish at home - Foreign born (%)
Residents speaking other language at home (%)
Residents speaking other language at home - Born in the United States (%)
Residents speaking other language at home - Native, born elsewhere (%)
Residents speaking other language at home - Foreign born (%)
Marital status - Never married (%)
Marital status - Now married (%)
Marital status - Separated (%)
Marital status - Widowed (%)
Marital status - Divorced (%)
Ancestries Reported - Arab (%)
Ancestries Reported - Czech (%)
Ancestries Reported - Danish (%)
Ancestries Reported - Dutch (%)
Ancestries Reported - English (%)
Ancestries Reported - French (%)
Ancestries Reported - French Canadian (%)
Ancestries Reported - German (%)
Ancestries Reported - Greek (%)
Ancestries Reported - Hungarian (%)
Ancestries Reported - Irish (%)
Ancestries Reported - Italian (%)
Ancestries Reported - Lithuanian (%)
Ancestries Reported - Norwegian (%)
Ancestries Reported - Polish (%)
Ancestries Reported - Portuguese (%)
Ancestries Reported - Russian (%)
Ancestries Reported - Scotch-Irish (%)
Ancestries Reported - Scottish (%)
Ancestries Reported - Slovak (%)
Ancestries Reported - Subsaharan African (%)
Ancestries Reported - Swedish (%)
Ancestries Reported - Swiss (%)
Ancestries Reported - Ukrainian (%)
Ancestries Reported - United States (%)
Ancestries Reported - Welsh (%)
Ancestries Reported - West Indian (%)
Ancestries Reported - Other (%)
Geographical mobility - Same house 1 year ago (%)
Geographical mobility - Same house 1 year ago (%) - White
Geographical mobility - Same house 1 year ago (%) - Black or African American
Geographical mobility - Same house 1 year ago (%) - Asian
Geographical mobility - Same house 1 year ago (%) - Hispanic or Latino
Geographical mobility - Same house 1 year ago (%) - American Indian and Alaska Native
Geographical mobility - Same house 1 year ago (%) - Multirace
Geographical mobility - Same house 1 year ago (%) - Other Race
Geographical mobility - Moved within same county (%)
Geographical mobility - Moved within same county (%) - White
Geographical mobility - Moved within same county (%) - Black or African American
Geographical mobility - Moved within same county (%) - Asian
Geographical mobility - Moved within same county (%) - Hispanic or Latino
Geographical mobility - Moved within same county (%) - American Indian and Alaska Native
Geographical mobility - Moved within same county (%) - Multirace
Geographical mobility - Moved within same county (%) - Other Race
Geographical mobility - Moved from different county within same state (%)
Geographical mobility - Moved from different county within same state (%) - White
Geographical mobility - Moved from different county within same state (%) - Black or African American
Geographical mobility - Moved from different county within same state (%) - Asian
Geographical mobility - Moved from different county within same state (%) - Hispanic or Latino
Geographical mobility - Moved from different county within same state (%) - American Indian and Alaska Native
Geographical mobility - Moved from different county within same state (%) - Multirace
Geographical mobility - Moved from different county within same state (%) - Other Race
Geographical mobility - Moved from different state (%)
Geographical mobility - Moved from different state (%) - White
Geographical mobility - Moved from different state (%) - Black or African American
Geographical mobility - Moved from different state (%) - Asian
Geographical mobility - Moved from different state (%) - Hispanic or Latino
Geographical mobility - Moved from different state (%) - American Indian and Alaska Native
Geographical mobility - Moved from different state (%) - Multirace
Geographical mobility - Moved from different state (%) - Other Race
Geographical mobility - Moved from abroad (%)
Geographical mobility - Moved from abroad (%) - White
Geographical mobility - Moved from abroad (%) - Black or African American
Geographical mobility - Moved from abroad (%) - Asian
Geographical mobility - Moved from abroad (%) - Hispanic or Latino
Geographical mobility - Moved from abroad (%) - American Indian and Alaska Native
Geographical mobility - Moved from abroad (%) - Multirace
Geographical mobility - Moved from abroad (%) - Other Race
Place of birth for the foreign-born population - Ireland (%)
Place of birth for the foreign-born population - Denmark (%)
Place of birth for the foreign-born population - Norway (%)
Place of birth for the foreign-born population - Sweden (%)
Place of birth for the foreign-born population - United Kingdom (%)
Place of birth for the foreign-born population - England (%)
Place of birth for the foreign-born population - Scotland (%)
Place of birth for the foreign-born population - Other Northern Europe (%)
Place of birth for the foreign-born population - Austria (%)
Place of birth for the foreign-born population - Belgium (%)
Place of birth for the foreign-born population - France (%)
Place of birth for the foreign-born population - Germany (%)
Place of birth for the foreign-born population - Netherlands (%)
Place of birth for the foreign-born population - Switzerland (%)
Place of birth for the foreign-born population - Other Western Europe (%)
Place of birth for the foreign-born population - Greece (%)
Place of birth for the foreign-born population - Italy (%)
Place of birth for the foreign-born population - Portugal (%)
Place of birth for the foreign-born population - Spain (%)
Place of birth for the foreign-born population - Other Southern Europe (%)
Place of birth for the foreign-born population - Albania (%)
Place of birth for the foreign-born population - Belarus (%)
Place of birth for the foreign-born population - Bosnia and Herzegovina (%)
Place of birth for the foreign-born population - Bulgaria (%)
Place of birth for the foreign-born population - Croatia (%)
Place of birth for the foreign-born population - Czechoslovakia (%)
Place of birth for the foreign-born population - Hungary (%)
Place of birth for the foreign-born population - Latvia (%)
Place of birth for the foreign-born population - Lithuania (%)
Place of birth for the foreign-born population - North Macedonia (Macedonia) (%)
Place of birth for the foreign-born population - Moldova (%)
Place of birth for the foreign-born population - Poland (%)
Place of birth for the foreign-born population - Romania (%)
Place of birth for the foreign-born population - Russia (%)
Place of birth for the foreign-born population - Serbia (%)
Place of birth for the foreign-born population - Ukraine (%)
Place of birth for the foreign-born population - Other Eastern Europe (%)
Place of birth for the foreign-born population - China (%)
Place of birth for the foreign-born population - Hong Kong (%)
Place of birth for the foreign-born population - Taiwan (%)
Place of birth for the foreign-born population - Japan (%)
Place of birth for the foreign-born population - Korea (%)
Place of birth for the foreign-born population - Other Eastern Asia (%)
Place of birth for the foreign-born population - Afghanistan (%)
Place of birth for the foreign-born population - Bangladesh (%)
Place of birth for the foreign-born population - India (%)
Place of birth for the foreign-born population - Iran (%)
Place of birth for the foreign-born population - Kazakhstan (%)
Place of birth for the foreign-born population - Nepal (%)
Place of birth for the foreign-born population - Pakistan (%)
Place of birth for the foreign-born population - Sri Lanka (%)
Place of birth for the foreign-born population - Uzbekistan (%)
Place of birth for the foreign-born population - Other South Central Asia (%)
Place of birth for the foreign-born population - Burma (%)
Place of birth for the foreign-born population - Cambodia (%)
Place of birth for the foreign-born population - Indonesia (%)
Place of birth for the foreign-born population - Laos (%)
Place of birth for the foreign-born population - Malaysia (%)
Place of birth for the foreign-born population - Philippines (%)
Place of birth for the foreign-born population - Singapore (%)
Place of birth for the foreign-born population - Thailand (%)
Place of birth for the foreign-born population - Vietnam (%)
Place of birth for the foreign-born population - Other South Eastern Asia (%)
Place of birth for the foreign-born population - Armenia (%)
Place of birth for the foreign-born population - Iraq (%)
Place of birth for the foreign-born population - Israel (%)
Place of birth for the foreign-born population - Jordan (%)
Place of birth for the foreign-born population - Kuwait (%)
Place of birth for the foreign-born population - Lebanon (%)
Place of birth for the foreign-born population - Saudi Arabia (%)
Place of birth for the foreign-born population - Syria (%)
Place of birth for the foreign-born population - Turkey (%)
Place of birth for the foreign-born population - Yemen (%)
Place of birth for the foreign-born population - Other Western Asia (%)
Place of birth for the foreign-born population - Eritrea (%)
Place of birth for the foreign-born population - Ethiopia (%)
Place of birth for the foreign-born population - Kenya (%)
Place of birth for the foreign-born population - Somalia (%)
Place of birth for the foreign-born population - Uganda (%)
Place of birth for the foreign-born population - Zimbabwe (%)
Place of birth for the foreign-born population - Other Eastern Africa (%)
Place of birth for the foreign-born population - Cameroon (%)
Place of birth for the foreign-born population - Congo (%)
Place of birth for the foreign-born population - Democratic Republic of Congo (Zaire) (%)
Place of birth for the foreign-born population - Other Middle Africa (%)
Place of birth for the foreign-born population - Egypt (%)
Place of birth for the foreign-born population - Morocco (%)
Place of birth for the foreign-born population - Sudan (%)
Place of birth for the foreign-born population - Other Northern Africa (%)
Place of birth for the foreign-born population - South Africa (%)
Place of birth for the foreign-born population - Other Southern Africa (%)
Place of birth for the foreign-born population - Cabo Verde (%)
Place of birth for the foreign-born population - Ghana (%)
Place of birth for the foreign-born population - Liberia (%)
Place of birth for the foreign-born population - Nigeria (%)
Place of birth for the foreign-born population - Senegal (%)
Place of birth for the foreign-born population - Sierra Leone (%)
Place of birth for the foreign-born population - Other Western Africa (%)
Place of birth for the foreign-born population - Australia (%)
Place of birth for the foreign-born population - New Zealand (%)
Place of birth for the foreign-born population - Fiji (%)
Place of birth for the foreign-born population - Micronesia (%)
Place of birth for the foreign-born population - Bahamas (%)
Place of birth for the foreign-born population - Barbados (%)
Place of birth for the foreign-born population - Cuba (%)
Place of birth for the foreign-born population - Dominica (%)
Place of birth for the foreign-born population - Dominican Republic (%)
Place of birth for the foreign-born population - Grenada (%)
Place of birth for the foreign-born population - Haiti (%)
Place of birth for the foreign-born population - Jamaica (%)
Place of birth for the foreign-born population - St. Vincent and the Grenadines (%)
Place of birth for the foreign-born population - Trinidad and Tobago (%)
Place of birth for the foreign-born population - West Indies (%)
Place of birth for the foreign-born population - Other Caribbean (%)
Place of birth for the foreign-born population - Belize (%)
Place of birth for the foreign-born population - Costa Rica (%)
Place of birth for the foreign-born population - El Salvador (%)
Place of birth for the foreign-born population - Guatemala (%)
Place of birth for the foreign-born population - Honduras (%)
Place of birth for the foreign-born population - Mexico (%)
Place of birth for the foreign-born population - Nicaragua (%)
Place of birth for the foreign-born population - Panama (%)
Place of birth for the foreign-born population - Other Central America (%)
Place of birth for the foreign-born population - Argentina (%)
Place of birth for the foreign-born population - Bolivia (%)
Place of birth for the foreign-born population - Brazil (%)
Place of birth for the foreign-born population - Chile (%)
Place of birth for the foreign-born population - Colombia (%)
Place of birth for the foreign-born population - Ecuador (%)
Place of birth for the foreign-born population - Guyana (%)
Place of birth for the foreign-born population - Peru (%)
Place of birth for the foreign-born population - Uruguay (%)
Place of birth for the foreign-born population - Venezuela (%)
Place of birth for the foreign-born population - Other South America (%)
Place of birth for the foreign-born population - Canada (%)
Place of birth for the foreign-born population - Other Northern America (%)
Place of birth for the foreign-born population - Other (%)
Latest news about races in Sanford, FL collected exclusively by city-data.com from local newspapers, TV, and radio stations
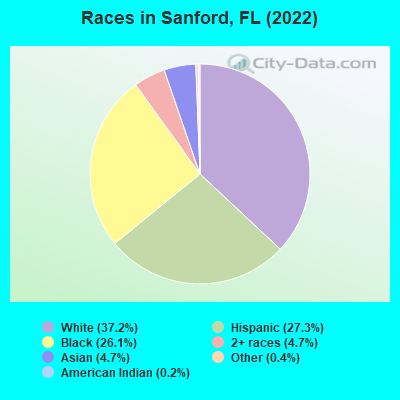
According to 2022 data, the most numerous races in Sanford, FL are White alone (23,157 residents), Hispanic (16,999 residents), and Black alone (16,237 residents). 72.8% of Sanford residents speak English at home. 18.1% of Sanford, FL residents are foreign-born (12.7% born in Latin America, 2.7% born in Asia), which is 15.9% less than the foreign-born rate of 21.0% across the entire state of Florida.
Race distribution in Sanford
2000 2022
10,458,509 65.4% White alone 2,682,715 16.8% Hispanic 2,264,268 14.2% Black alone 261,693 1.6% Asian alone 236,954 1.5% Two or more races 42,358 0.3% American Indian alone 28,994 0.2% Other race alone 6,887 0.04% Native Hawaiian and Other
11,309,403 50.8% White alone 6,025,039 27.1% Hispanic 3,241,015 14.6% Black alone 861,630 3.9% Two or more races 623,692 2.8% Asian alone 152,054 0.7% Other race alone 22,504 0.1% American Indian alone 9,486 0.04% Native Hawaiian and Other
Income and house value in Sanford Median household income in 2022 $61,979 White non-Hispanic householders$51,181 Black householders$81,678 Asian householders$99,609 Some other race householders$78,536 Two or more races householders$68,183 Hispanic or Latino race householdersMedian 2022 house value $305,746 White Non-Hispanic householders$247,008 Black or African American householders$437,614 American Indian or Alaska Native householders $334,142 Asian householders$291,742 Some other race householders$294,465 Two or more races householders$311,970 Hispanic or Latino householders
Median age by race in Sanford
41.0 Median age for White residents39.6 42.1 33.2 Median age for Black or African American residents31.9 34.1 40.1 Median age for American Indian / Alaska Native residents38.1 37.3 31.5 Median age for Asian residents26.0 35.1 -679,849,340.2 Median age for Native Hawaiian / Pacific Islander residents-858,307,848.3 -443,298,968.6 37.5 Median age for Other race residents30.7 40.1 33.1 Median age for Two or more races residents31.5 34.4 41.8 Median age for White alone residents40.8 43.3 34.5 Median age for Hispanic or Latino residents32.0 36.6
Owner/renter occupied households by race in Sanford
House owners and renters - White residents 7,056 58.7% Owner occupied4,957 41.3% Renter occupiedHouse owners and renters - Black or African American residents 2,805 42.8% Owner occupied3,747 57.2% Renter occupiedHouse owners and renters - American Indian / Alaska Native residents 48 72.6% Owner occupied18 27.4% Renter occupiedHouse owners and renters - Asian residents 322 31.4% Owner occupied703 68.6% Renter occupiedHouse owners and renters - Native Hawaiian / Pacific Islander residents 5 100.0% Renter occupiedHouse owners and renters - Other race residents 604 40.3% Owner occupied894 59.7% Renter occupiedHouse owners and renters - Two or more races residents 1,748 44.1% Owner occupied2,213 55.9% Renter occupiedHouse owners and renters - White alone residents 6,285 58.1% Owner occupied4,535 41.9% Renter occupiedHouse owners and renters - Hispanic or Latino residents 2,686 46.4% Owner occupied3,098 53.6% Renter occupied
Language usage in Sanford
English speakers - Total 72.8% of residents of Sanford speak English at home.
20.3% of residents speak Spanish at home 6,985 58.6% Speak English very well4,932 41.4% Speak English less than very well6.6% of residents speak other language at home 2,273 58.8% Speak English very well1,591 41.2% Speak English less than very well
English speakers - Born in the United States 88.6% of residents of Sanford speak English at home.
9.9% of residents speak Spanish at home 1,854 91.3% Speak English very well177 8.7% Speak English less than very well1.3% of residents speak other language at home 217 84.4% Speak English very well40 15.6% Speak English less than very well
English speakers - Native, born elsewhere 29.3% of residents of Sanford speak English at home.
63.3% of residents speak Spanish at home 1,457 59.2% Speak English very well1,004 40.8% Speak English less than very well3.7% of residents speak other language at home 75 52.8% Speak English very well67 47.2% Speak English less than very well
English speakers - Foreign-born 17.2% of residents of Sanford speak English at home.
54.0% of residents speak Spanish at home 2,751 44.6% Speak English very well3,424 55.4% Speak English less than very well28.1% of residents speak other language at home 1,819 56.6% Speak English very well1,392 43.4% Speak English less than very well
White (Caucasian) - Speak only English Native:
94.7% (21,249)Foreign-born:
18.1% (387)
White (Caucasian) - Speak another language Native:
5.1% (1,151)Foreign-born:
83.1% (1,773)
Black or African American - Speak only English Native:
96.0% (13,443)Foreign-born:
43.4% (570)
Black or African American - Speak another language Native:
2.5% (344)Foreign-born:
58.2% (765)
American Indian / Alaska Native - Speak only English Native:
51.7% (43)Foreign-born:
4.5% (6)
American Indian / Alaska Native - Speak another language Native:
48.2% (40)Foreign-born:
96.9% (137)
Asian - Speak only English Native:
72.3% (625)Foreign-born:
15.6% (283)
Asian - Speak another language Native:
26.4% (229)Foreign-born:
84.7% (1,534)
Other race - Speak only English Native:
33.3% (1,141)Foreign-born:
15.1% (197)
Other race - Speak another language Native:
65.5% (2,242)Foreign-born:
99.4% (1,294)
Two or more races - Speak only English Native:
58.1% (4,167)Foreign-born:
17.6% (976)
Two or more races - Speak another language Native:
42.5% (3,048)Foreign-born:
82.3% (4,558)
White alone - Speak only English Native:
97.8% (20,608)Foreign-born:
33.3% (411)
White alone - Speak another language Native:
2.3% (476)Foreign-born:
63.9% (788)
Hispanic or Latino - Speak only English Native:
37.7% (3,474)Foreign-born:
8.9% (602)
Hispanic or Latino - Speak another language Native:
59.3% (5,463)Foreign-born:
91.0% (6,164)
Foreign-born residents in Sanford 11,277 residents are foreign born (12.7% Latin America , 2.7% Asia ).
This city:
18.1%Florida:
21.1%
Marital status for residents in Sanford Marital status - White (Caucasian) population 15 years and over
Males 39.2% Never married40.4% Now married1.5% Separated4.2% Widowed14.8% DivorcedFemales 28.5% Never married40.0% Now married2.8% Separated11.5% Widowed17.1% DivorcedWomen who gave birth in the past 12 months Now married:
76.2% (117)Unmarried:
23.8% (37)
Women who did not give birth in the past 12 months Now married:
44.0% (2,655)Unmarried:
56.0% (3,381)
Marital status - Black or African American population 15 years and over
Males 47.1% Never married33.0% Now married2.5% Separated3.8% Widowed13.6% DivorcedFemales 45.2% Never married26.7% Now married6.9% Separated7.7% Widowed13.5% DivorcedWomen who gave birth in the past 12 months Now married:
82.6% (120)Unmarried:
17.4% (25)
Women who did not give birth in the past 12 months Now married:
27.1% (1,229)Unmarried:
72.9% (3,299)
Marital status - American Indian / Alaska Native population 15 years and over
Males 8.0% Never married4.0% Now married0.0% Separated25.3% Widowed62.7% DivorcedFemales 0.0% Never married78.9% Now married0.0% Separated0.0% Widowed21.1% DivorcedWomen who did not give birth in the past 12 months Now married:
73.5% (41)Unmarried:
26.5% (15)
Marital status - Asian population 15 years and over
Males 38.8% Never married52.7% Now married0.0% Separated0.0% Widowed8.5% DivorcedFemales 10.3% Never married68.5% Now married5.4% Separated4.4% Widowed11.4% DivorcedWomen who gave birth in the past 12 months Now married:
100.0% (6)Unmarried:
0.0% (0)
Women who did not give birth in the past 12 months Now married:
80.5% (556)Unmarried:
19.5% (134)
Marital status - Other race population 15 years and over
Males 39.8% Never married52.6% Now married0.4% Separated0.0% Widowed7.2% DivorcedFemales 25.2% Never married51.1% Now married1.7% Separated11.9% Widowed10.1% DivorcedWomen who gave birth in the past 12 months Now married:
39.7% (20)Unmarried:
60.3% (30)
Women who did not give birth in the past 12 months Now married:
51.1% (520)Unmarried:
48.9% (498)
Marital status - Two or more races population 15 years and over
Males 50.7% Never married42.4% Now married0.7% Separated0.7% Widowed5.5% DivorcedFemales 41.9% Never married38.7% Now married2.0% Separated4.7% Widowed12.7% DivorcedWomen who gave birth in the past 12 months Now married:
13.0% (39)Unmarried:
87.0% (262)
Women who did not give birth in the past 12 months Now married:
39.8% (1,282)Unmarried:
60.2% (1,942)
Marital status - White alone, not Hispanic / Latino population 15 years and over
Males 38.2% Never married39.6% Now married1.6% Separated4.7% Widowed15.9% DivorcedFemales 28.2% Never married39.2% Now married2.0% Separated12.7% Widowed17.9% DivorcedWomen who gave birth in the past 12 months Now married:
72.7% (106)Unmarried:
27.3% (40)
Women who did not give birth in the past 12 months Now married:
41.8% (2,187)Unmarried:
58.2% (3,049)
Marital status - Hispanic or Latino population 15 years and over
Males 47.3% Never married45.7% Now married0.3% Separated1.0% Widowed5.7% DivorcedFemales 33.1% Never married44.0% Now married3.5% Separated7.7% Widowed11.7% DivorcedWomen who gave birth in the past 12 months Now married:
49.6% (58)Unmarried:
50.4% (59)
Women who did not give birth in the past 12 months Now married:
44.8% (1,976)Unmarried:
55.2% (2,434)
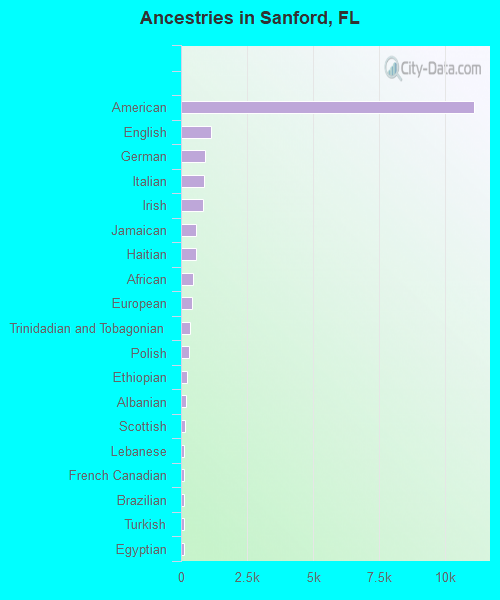
Ancestries in Sanford
9,510 23.8% American1,219 3.1% English860 2.2% German837 2.1% Irish748 1.9% Jamaican733 1.8% Italian542 1.4% Haitian417 1.0% African405 1.0% European338 0.8% Nigerian261 0.7% Polish223 0.6% Ethiopian222 0.6% Trinidadian and Tobagonian211 0.5% Albanian179 0.4% Egyptian157 0.4% French Canadian155 0.4% Lebanese125 0.3% Brazilian119 0.3% Scottish110 0.3% Ukrainian96 0.2% Turkish89 0.2% West Indian78 0.2% Scotch-Irish72 0.2% Iranian66 0.2% Russian63 0.2% Hungarian53 0.1% Welsh51 0.1% Romanian46 0.1% French45 0.1% Guyanese39 0.10% British36 0.09% Greek36 0.09% Swedish35 0.09% Eastern European24 0.06% Portuguese24 0.06% Dutch20 0.05% U.S. Virgin Islander19 0.05% Austrian17 0.04% Czech16 0.04% Israeli16 0.04% Arab15 0.04% Danish13 0.03% Norwegian13 0.03% Bahamian11 0.03% Canadian11 0.03% British West Indian10 0.03% Ghanaian9 0.02% Palestinian9 0.02% Croatian4 0.01% Northern European4 0.01% German Russian3 0.01% Syrian2 0.01% Lithuanian
Geographical mobility in Sanford Same house 1 year ago 21,056 82.3% White (Caucasian)13,201 80.2% Black or African American155 76.7% American Indian / Alaska Native2,164 72.7% Asian5 100.0% Native Hawaiian / Pacific Islander4,000 82.6% Other race11,338 85.9% Two or more races18,977 82.5% White alone, not Hispanic / Latino13,897 83.0% Hispanic or LatinoMoved within same county 2,100 8.2% White / Caucasian1,344 8.2% Black or African American18 8.8% American Indian / Alaska Native164 5.5% Asian215 4.4% Other race835 6.3% Two or more races1,935 8.4% White alone, not Hispanic / Latino1,175 7.0% Hispanic or LatinoMoved within same state 1,128 4.4% White / Caucasian629 3.8% Black or African American25 12.4% American Indian / Alaska Native41 1.4% Asian251 5.2% Other race716 5.4% Two or more races1,229 5.3% White alone, not Hispanic / Latino688 4.1% Hispanic or LatinoMoved from different state 950 3.7% White / Caucasian905 5.5% Black or African American282 9.5% Asian512 10.6% Other race114 0.9% Two or more races637 2.8% White alone, not Hispanic / Latino657 3.9% Hispanic or LatinoMoved from abroad 327 1.3% White47 0.3% Black or African American200 6.7% Asian118 2.4% Other race140 1.1% Two or more races62 0.3% White alone, not Hispanic / Latino210 1.3% Hispanic or Latino
Children Nativity (place of birth) in Sanford
Children under 6 years - Living with two parents Both parents native 925 100.0% NativeBoth parents foreign-born 493 52.2% Native451 47.8% Foreign-bornOne native, one foreign-born parent 677 100.0% NativeChildren under 6 years - Living with one parent Native parent 1,678 99.6% Native8 0.4% Foreign-bornForeign-born parent 152 91.0% Native15 9.0% Foreign-bornChildren 6 to 17 years - Living with two parents Both parents native 2,759 100.0% NativeBoth parents foreign-born 521 46.4% Native602 53.6% Foreign-bornOne native, one foreign-born parent 636 100.0% NativeChildren 6 to 17 years - Living with one parent Native parent 2,581 100.0% NativeForeign-born parent 890 58.3% Native637 41.7% Foreign-born
Grandparents responsible for own grandchildren in Sanford
Grandparents (30 to 59 years) White / Caucasian 18 18.6% Responsible for grandchildren81 81.4% Not responsible for grandchildrenBlack or African American 186 72.8% Responsible for grandchildren70 27.2% Not responsible for grandchildrenAsian 72 100.0% Not responsible for grandchildrenOther race 16 100.0% Not responsible for grandchildrenTwo or more races 355 100.0% Responsible for grandchildrenWhite alone, not Hispanic / Latino 23 18.7% Responsible for grandchildren100 81.3% Not responsible for grandchildrenHispanic or Latino 175 93.9% Responsible for grandchildren11 6.1% Not responsible for grandchildrenGrandparents (60 years and over) White / Caucasian 119 32.2% Responsible for grandchildren252 67.8% Not responsible for grandchildrenBlack or African American 199 50.8% Responsible for grandchildren193 49.2% Not responsible for grandchildrenOther race 44 27.4% Responsible for grandchildren117 72.6% Not responsible for grandchildrenTwo or more races 36 14.1% Responsible for grandchildren222 85.9% Not responsible for grandchildrenWhite alone, not Hispanic / Latino 121 32.0% Responsible for grandchildren259 68.0% Not responsible for grandchildrenHispanic or Latino 64 21.5% Responsible for grandchildren233 78.5% Not responsible for grandchildren