Races in San Juan Pueblo, New Mexico (NM) Detailed Stats
Ancestries, Foreign-born residents, place of birth
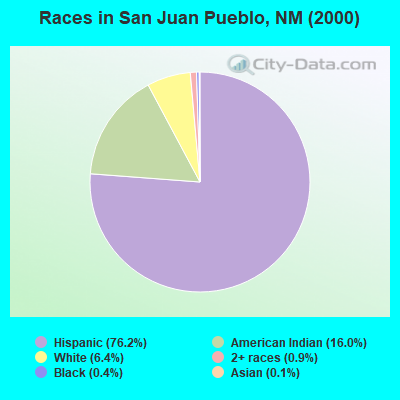
Race distribution in San Juan Pueblo

- 5,14376.2%Hispanic
- 1,07816.0%American Indian alone
- 4326.4%White alone
- 590.9%Two or more races
- 260.4%Black alone
- 100.1%Asian alone
2000
2022
-
- 813,49544.7%White alone
- 765,38642.1%Hispanic
- 161,4608.9%American Indian alone
- 30,6541.7%Black alone
- 25,7931.4%Two or more races
- 18,2571.0%Asian alone
- 3,0090.2%Other race alone
- 9920.05%Native Hawaiian and Other
Pacific Islander alone

-
- 1,059,86750.2%Hispanic
- 735,47834.8%White alone
- 171,8088.1%American Indian alone
- 65,0843.1%Two or more races
- 36,8701.7%Black alone
- 35,8701.7%Asian alone
- 7,5820.4%Other race alone
- 7850.04%Native Hawaiian and Other
Pacific Islander alone

Income and house value in San Juan Pueblo
- Median household income in 2022
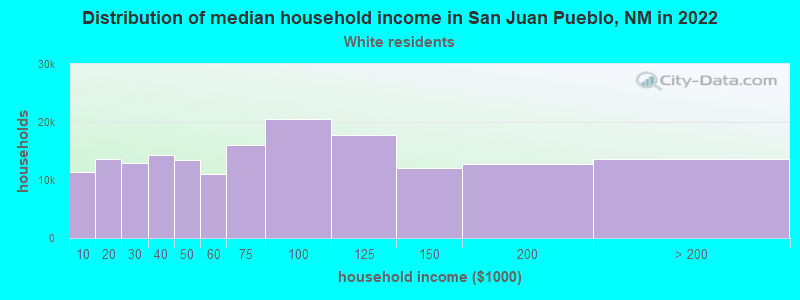
- $66,922White non-Hispanic householders
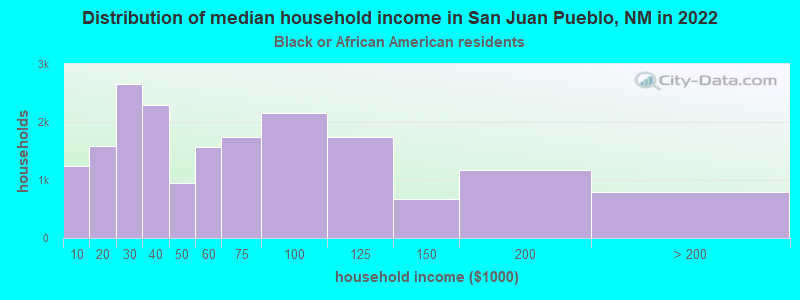
- $55,657Black householders
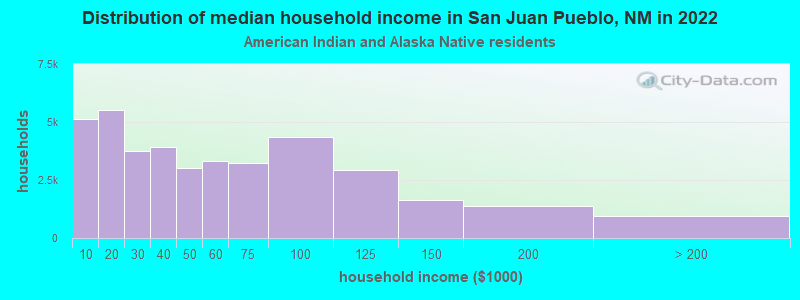
- $56,579American Indian and Alaska Native householders
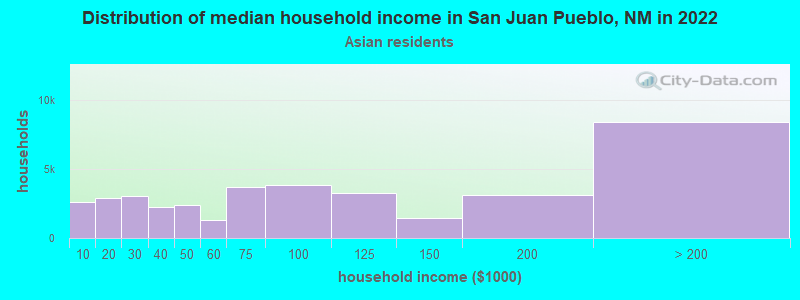
- over $200,000Asian householders
- $50,151Some other race householders
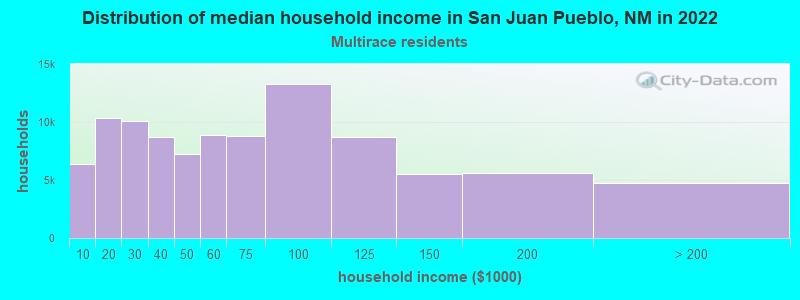
- $59,252Two or more races householders
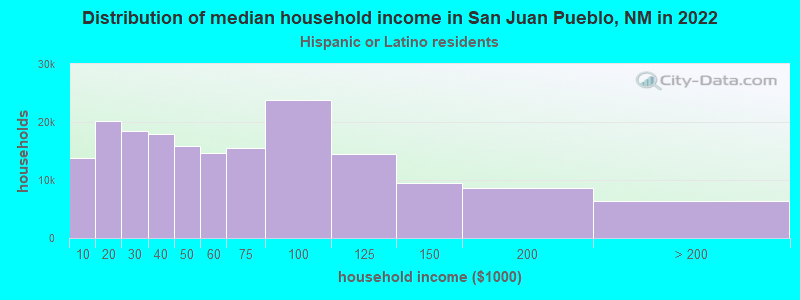
- $50,477Hispanic or Latino race householders
- Median 2022 house value
- $342,867White Non-Hispanic householders
- $200,749American Indian or Alaska Native householders
- $303,960Asian householders
- $256,677Some other race householders
- $427,706Two or more races householders
- $295,044Hispanic or Latino householders
Household income for White non-Hispanic householders
Household income for Black householders
Household income for American Indian and Alaska Native householders
Household income for Asian householders
Household income for Native Hawaiian and other Pacific Islander householders

Household income for Two or more races householders
Household income for Hispanic or Latino race householders
Zip code: 87566