Races in San Carlos Park, Florida (FL) Detailed Stats
Data:
Races - White alone (%)
Races - White alone (% change since 2000)
Races - Black alone (%)
Races - Black alone (% change since 2000)
Races - American Indian alone (%)
Races - American Indian alone (% change since 2000)
Races - Asian alone (%)
Races - Asian alone (% change since 2000)
Races - Hispanic (%)
Races - Hispanic (% change since 2000)
Races - Native Hawaiian and Other Pacific Islander alone (%)
Races - Native Hawaiian and Other Pacific Islander alone (% change since 2000)
Races - Two or more races(%)
Races - Two or more races(% change since 2000)
Races - Other race alone (%)
Races - Other race alone (% change since 2000)
Racial diversity
Place of birth - Born in state of residence (%)
Place of birth - Born in state of residence (%) - White
Place of birth - Born in state of residence (%) - Black or African American
Place of birth - Born in state of residence (%) - Asian
Place of birth - Born in state of residence (%) - Hispanic or Latino
Place of birth - Born in state of residence (%) - American Indian and Alaska Native
Place of birth - Born in state of residence (%) - Multirace
Place of birth - Born in state of residence (%) - Other Race
Place of birth - Born in other state (%)
Place of birth - Born in other state (%) - White
Place of birth - Born in other state (%) - Black or African American
Place of birth - Born in other state (%) - Asian
Place of birth - Born in other state (%) - Hispanic or Latino
Place of birth - Born in other state (%) - American Indian and Alaska Native
Place of birth - Born in other state (%) - Multirace
Place of birth - Born in other state (%) - Other Race
Place of birth - Native, outside of US (%)
Place of birth - Native, outside of US (%) - White
Place of birth - Native, outside of US (%) - Black or African American
Place of birth - Native, outside of US (%) - Asian
Place of birth - Native, outside of US (%) - Hispanic or Latino
Place of birth - Native, outside of US (%) - American Indian and Alaska Native
Place of birth - Native, outside of US (%) - Multirace
Place of birth - Native, outside of US (%) - Other Race
Place of birth - Foreign born (%)
Place of birth - Foreign born (%) - White
Place of birth - Foreign born (%) - Black or African American
Place of birth - Foreign born (%) - Asian
Place of birth - Foreign born (%) - Hispanic or Latino
Place of birth - Foreign born (%) - American Indian and Alaska Native
Place of birth - Foreign born (%) - Multirace
Place of birth - Foreign born (%) - Other Race
Residents speaking English at home (%)
Residents speaking English at home - Born in the United States (%)
Residents speaking English at home - Native, born elsewhere (%)
Residents speaking English at home - Foreign born (%)
Residents speaking Spanish at home (%)
Residents speaking Spanish at home - Born in the United States (%)
Residents speaking Spanish at home - Native, born elsewhere (%)
Residents speaking Spanish at home - Foreign born (%)
Residents speaking other language at home (%)
Residents speaking other language at home - Born in the United States (%)
Residents speaking other language at home - Native, born elsewhere (%)
Residents speaking other language at home - Foreign born (%)
Marital status - Never married (%)
Marital status - Now married (%)
Marital status - Separated (%)
Marital status - Widowed (%)
Marital status - Divorced (%)
Ancestries Reported - Arab (%)
Ancestries Reported - Czech (%)
Ancestries Reported - Danish (%)
Ancestries Reported - Dutch (%)
Ancestries Reported - English (%)
Ancestries Reported - French (%)
Ancestries Reported - French Canadian (%)
Ancestries Reported - German (%)
Ancestries Reported - Greek (%)
Ancestries Reported - Hungarian (%)
Ancestries Reported - Irish (%)
Ancestries Reported - Italian (%)
Ancestries Reported - Lithuanian (%)
Ancestries Reported - Norwegian (%)
Ancestries Reported - Polish (%)
Ancestries Reported - Portuguese (%)
Ancestries Reported - Russian (%)
Ancestries Reported - Scotch-Irish (%)
Ancestries Reported - Scottish (%)
Ancestries Reported - Slovak (%)
Ancestries Reported - Subsaharan African (%)
Ancestries Reported - Swedish (%)
Ancestries Reported - Swiss (%)
Ancestries Reported - Ukrainian (%)
Ancestries Reported - United States (%)
Ancestries Reported - Welsh (%)
Ancestries Reported - West Indian (%)
Ancestries Reported - Other (%)
Geographical mobility - Same house 1 year ago (%)
Geographical mobility - Same house 1 year ago (%) - White
Geographical mobility - Same house 1 year ago (%) - Black or African American
Geographical mobility - Same house 1 year ago (%) - Asian
Geographical mobility - Same house 1 year ago (%) - Hispanic or Latino
Geographical mobility - Same house 1 year ago (%) - American Indian and Alaska Native
Geographical mobility - Same house 1 year ago (%) - Multirace
Geographical mobility - Same house 1 year ago (%) - Other Race
Geographical mobility - Moved within same county (%)
Geographical mobility - Moved within same county (%) - White
Geographical mobility - Moved within same county (%) - Black or African American
Geographical mobility - Moved within same county (%) - Asian
Geographical mobility - Moved within same county (%) - Hispanic or Latino
Geographical mobility - Moved within same county (%) - American Indian and Alaska Native
Geographical mobility - Moved within same county (%) - Multirace
Geographical mobility - Moved within same county (%) - Other Race
Geographical mobility - Moved from different county within same state (%)
Geographical mobility - Moved from different county within same state (%) - White
Geographical mobility - Moved from different county within same state (%) - Black or African American
Geographical mobility - Moved from different county within same state (%) - Asian
Geographical mobility - Moved from different county within same state (%) - Hispanic or Latino
Geographical mobility - Moved from different county within same state (%) - American Indian and Alaska Native
Geographical mobility - Moved from different county within same state (%) - Multirace
Geographical mobility - Moved from different county within same state (%) - Other Race
Geographical mobility - Moved from different state (%)
Geographical mobility - Moved from different state (%) - White
Geographical mobility - Moved from different state (%) - Black or African American
Geographical mobility - Moved from different state (%) - Asian
Geographical mobility - Moved from different state (%) - Hispanic or Latino
Geographical mobility - Moved from different state (%) - American Indian and Alaska Native
Geographical mobility - Moved from different state (%) - Multirace
Geographical mobility - Moved from different state (%) - Other Race
Geographical mobility - Moved from abroad (%)
Geographical mobility - Moved from abroad (%) - White
Geographical mobility - Moved from abroad (%) - Black or African American
Geographical mobility - Moved from abroad (%) - Asian
Geographical mobility - Moved from abroad (%) - Hispanic or Latino
Geographical mobility - Moved from abroad (%) - American Indian and Alaska Native
Geographical mobility - Moved from abroad (%) - Multirace
Geographical mobility - Moved from abroad (%) - Other Race
Place of birth for the foreign-born population - Ireland (%)
Place of birth for the foreign-born population - Denmark (%)
Place of birth for the foreign-born population - Norway (%)
Place of birth for the foreign-born population - Sweden (%)
Place of birth for the foreign-born population - United Kingdom (%)
Place of birth for the foreign-born population - England (%)
Place of birth for the foreign-born population - Scotland (%)
Place of birth for the foreign-born population - Other Northern Europe (%)
Place of birth for the foreign-born population - Austria (%)
Place of birth for the foreign-born population - Belgium (%)
Place of birth for the foreign-born population - France (%)
Place of birth for the foreign-born population - Germany (%)
Place of birth for the foreign-born population - Netherlands (%)
Place of birth for the foreign-born population - Switzerland (%)
Place of birth for the foreign-born population - Other Western Europe (%)
Place of birth for the foreign-born population - Greece (%)
Place of birth for the foreign-born population - Italy (%)
Place of birth for the foreign-born population - Portugal (%)
Place of birth for the foreign-born population - Spain (%)
Place of birth for the foreign-born population - Other Southern Europe (%)
Place of birth for the foreign-born population - Albania (%)
Place of birth for the foreign-born population - Belarus (%)
Place of birth for the foreign-born population - Bosnia and Herzegovina (%)
Place of birth for the foreign-born population - Bulgaria (%)
Place of birth for the foreign-born population - Croatia (%)
Place of birth for the foreign-born population - Czechoslovakia (%)
Place of birth for the foreign-born population - Hungary (%)
Place of birth for the foreign-born population - Latvia (%)
Place of birth for the foreign-born population - Lithuania (%)
Place of birth for the foreign-born population - North Macedonia (Macedonia) (%)
Place of birth for the foreign-born population - Moldova (%)
Place of birth for the foreign-born population - Poland (%)
Place of birth for the foreign-born population - Romania (%)
Place of birth for the foreign-born population - Russia (%)
Place of birth for the foreign-born population - Serbia (%)
Place of birth for the foreign-born population - Ukraine (%)
Place of birth for the foreign-born population - Other Eastern Europe (%)
Place of birth for the foreign-born population - China (%)
Place of birth for the foreign-born population - Hong Kong (%)
Place of birth for the foreign-born population - Taiwan (%)
Place of birth for the foreign-born population - Japan (%)
Place of birth for the foreign-born population - Korea (%)
Place of birth for the foreign-born population - Other Eastern Asia (%)
Place of birth for the foreign-born population - Afghanistan (%)
Place of birth for the foreign-born population - Bangladesh (%)
Place of birth for the foreign-born population - India (%)
Place of birth for the foreign-born population - Iran (%)
Place of birth for the foreign-born population - Kazakhstan (%)
Place of birth for the foreign-born population - Nepal (%)
Place of birth for the foreign-born population - Pakistan (%)
Place of birth for the foreign-born population - Sri Lanka (%)
Place of birth for the foreign-born population - Uzbekistan (%)
Place of birth for the foreign-born population - Other South Central Asia (%)
Place of birth for the foreign-born population - Burma (%)
Place of birth for the foreign-born population - Cambodia (%)
Place of birth for the foreign-born population - Indonesia (%)
Place of birth for the foreign-born population - Laos (%)
Place of birth for the foreign-born population - Malaysia (%)
Place of birth for the foreign-born population - Philippines (%)
Place of birth for the foreign-born population - Singapore (%)
Place of birth for the foreign-born population - Thailand (%)
Place of birth for the foreign-born population - Vietnam (%)
Place of birth for the foreign-born population - Other South Eastern Asia (%)
Place of birth for the foreign-born population - Armenia (%)
Place of birth for the foreign-born population - Iraq (%)
Place of birth for the foreign-born population - Israel (%)
Place of birth for the foreign-born population - Jordan (%)
Place of birth for the foreign-born population - Kuwait (%)
Place of birth for the foreign-born population - Lebanon (%)
Place of birth for the foreign-born population - Saudi Arabia (%)
Place of birth for the foreign-born population - Syria (%)
Place of birth for the foreign-born population - Turkey (%)
Place of birth for the foreign-born population - Yemen (%)
Place of birth for the foreign-born population - Other Western Asia (%)
Place of birth for the foreign-born population - Eritrea (%)
Place of birth for the foreign-born population - Ethiopia (%)
Place of birth for the foreign-born population - Kenya (%)
Place of birth for the foreign-born population - Somalia (%)
Place of birth for the foreign-born population - Uganda (%)
Place of birth for the foreign-born population - Zimbabwe (%)
Place of birth for the foreign-born population - Other Eastern Africa (%)
Place of birth for the foreign-born population - Cameroon (%)
Place of birth for the foreign-born population - Congo (%)
Place of birth for the foreign-born population - Democratic Republic of Congo (Zaire) (%)
Place of birth for the foreign-born population - Other Middle Africa (%)
Place of birth for the foreign-born population - Egypt (%)
Place of birth for the foreign-born population - Morocco (%)
Place of birth for the foreign-born population - Sudan (%)
Place of birth for the foreign-born population - Other Northern Africa (%)
Place of birth for the foreign-born population - South Africa (%)
Place of birth for the foreign-born population - Other Southern Africa (%)
Place of birth for the foreign-born population - Cabo Verde (%)
Place of birth for the foreign-born population - Ghana (%)
Place of birth for the foreign-born population - Liberia (%)
Place of birth for the foreign-born population - Nigeria (%)
Place of birth for the foreign-born population - Senegal (%)
Place of birth for the foreign-born population - Sierra Leone (%)
Place of birth for the foreign-born population - Other Western Africa (%)
Place of birth for the foreign-born population - Australia (%)
Place of birth for the foreign-born population - New Zealand (%)
Place of birth for the foreign-born population - Fiji (%)
Place of birth for the foreign-born population - Micronesia (%)
Place of birth for the foreign-born population - Bahamas (%)
Place of birth for the foreign-born population - Barbados (%)
Place of birth for the foreign-born population - Cuba (%)
Place of birth for the foreign-born population - Dominica (%)
Place of birth for the foreign-born population - Dominican Republic (%)
Place of birth for the foreign-born population - Grenada (%)
Place of birth for the foreign-born population - Haiti (%)
Place of birth for the foreign-born population - Jamaica (%)
Place of birth for the foreign-born population - St. Vincent and the Grenadines (%)
Place of birth for the foreign-born population - Trinidad and Tobago (%)
Place of birth for the foreign-born population - West Indies (%)
Place of birth for the foreign-born population - Other Caribbean (%)
Place of birth for the foreign-born population - Belize (%)
Place of birth for the foreign-born population - Costa Rica (%)
Place of birth for the foreign-born population - El Salvador (%)
Place of birth for the foreign-born population - Guatemala (%)
Place of birth for the foreign-born population - Honduras (%)
Place of birth for the foreign-born population - Mexico (%)
Place of birth for the foreign-born population - Nicaragua (%)
Place of birth for the foreign-born population - Panama (%)
Place of birth for the foreign-born population - Other Central America (%)
Place of birth for the foreign-born population - Argentina (%)
Place of birth for the foreign-born population - Bolivia (%)
Place of birth for the foreign-born population - Brazil (%)
Place of birth for the foreign-born population - Chile (%)
Place of birth for the foreign-born population - Colombia (%)
Place of birth for the foreign-born population - Ecuador (%)
Place of birth for the foreign-born population - Guyana (%)
Place of birth for the foreign-born population - Peru (%)
Place of birth for the foreign-born population - Uruguay (%)
Place of birth for the foreign-born population - Venezuela (%)
Place of birth for the foreign-born population - Other South America (%)
Place of birth for the foreign-born population - Canada (%)
Place of birth for the foreign-born population - Other Northern America (%)
Place of birth for the foreign-born population - Other (%)
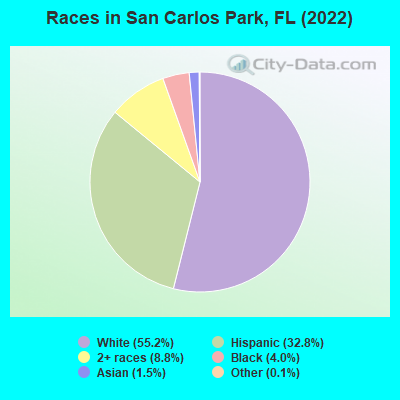
According to 2022 data, the most numerous races in San Carlos Park, FL are White alone (11,101 residents), Hispanic (6,595 residents), and Black alone (798 residents). 72.9% of San Carlos Park residents speak English at home. 17.1% of San Carlos Park, FL residents are foreign-born (14.0% born in Latin America), which is 22.5% less than the foreign-born rate of 21.0% across the entire state of Florida.
Race distribution in San Carlos Park
2000 2022
10,458,509 65.4% White alone 2,682,715 16.8% Hispanic 2,264,268 14.2% Black alone 261,693 1.6% Asian alone 236,954 1.5% Two or more races 42,358 0.3% American Indian alone 28,994 0.2% Other race alone 6,887 0.04% Native Hawaiian and Other
11,309,403 50.8% White alone 6,025,039 27.1% Hispanic 3,241,015 14.6% Black alone 861,630 3.9% Two or more races 623,692 2.8% Asian alone 152,054 0.7% Other race alone 22,504 0.1% American Indian alone 9,486 0.04% Native Hawaiian and Other
Income and house value in San Carlos Park Median household income in 2022 $85,056 White non-Hispanic householders$77,680 Black householders$82,997 Some other race householders$74,500 Two or more races householders$77,790 Hispanic or Latino race householdersMedian 2022 house value $334,864 White Non-Hispanic householders$42,931 Black or African American householders$264,800 American Indian or Alaska Native householders $386,382 Asian householders$643,970 Native Hawaiian and other Pacific Islander householders$351,350 Some other race householders$293,650 Two or more races householders$330,743 Hispanic or Latino householders
Median age by race in San Carlos Park
40.6 Median age for White residents37.8 43.5 23.8 Median age for Black or African American residents22.5 39.6 -562,189,054.2 Median age for American Indian / Alaska Native residents-558,080,807.5 -402,449,693.4 39.4 Median age for Asian residents78.8 37.0 -1,092,290,987.0 Median age for Native Hawaiian / Pacific Islander residents-858,307,848.3 -800,880,087.2 34.1 Median age for Other race residents31.1 36.0 21.1 Median age for Two or more races residents23.6 17.5 43.6 Median age for White alone residents39.5 46.4 31.3 Median age for Hispanic or Latino residents27.3 33.6
Owner/renter occupied households by race in San Carlos Park
House owners and renters - White residents 3,853 78.2% Owner occupied1,073 21.8% Renter occupiedHouse owners and renters - Black or African American residents 239 89.0% Owner occupied30 11.0% Renter occupiedHouse owners and renters - Asian residents 39 47.4% Owner occupied43 52.6% Renter occupiedHouse owners and renters - Native Hawaiian / Pacific Islander residents 8 100.0% Owner occupiedHouse owners and renters - Other race residents 223 68.8% Owner occupied101 31.2% Renter occupiedHouse owners and renters - Two or more races residents 908 62.4% Owner occupied547 37.6% Renter occupiedHouse owners and renters - White alone residents 3,591 79.8% Owner occupied907 20.2% Renter occupiedHouse owners and renters - Hispanic or Latino residents 1,038 57.7% Owner occupied760 42.3% Renter occupied
Language usage in San Carlos Park
English speakers - Total 72.9% of residents of San Carlos Park speak English at home.
23.3% of residents speak Spanish at home 2,641 59.8% Speak English very well1,775 40.2% Speak English less than very well3.6% of residents speak other language at home 458 67.7% Speak English very well219 32.3% Speak English less than very well
English speakers - Born in the United States 90.6% of residents of San Carlos Park speak English at home.
9.0% of residents speak Spanish at home 743 98.9% Speak English very well8 1.1% Speak English less than very well0.5% of residents speak other language at home 26 57.8% Speak English very well19 42.2% Speak English less than very well
English speakers - Native, born elsewhere 62.1% of residents of San Carlos Park speak English at home.
30.9% of residents speak Spanish at home 157 62.1% Speak English very well96 37.9% Speak English less than very well0.5% of residents speak other language at home 4 100.0% Speak English very well
English speakers - Foreign-born 20.5% of residents of San Carlos Park speak English at home.
63.7% of residents speak Spanish at home 795 33.2% Speak English very well1,601 66.8% Speak English less than very well14.3% of residents speak other language at home 327 60.8% Speak English very well211 39.2% Speak English less than very well
White (Caucasian) - Speak only English Native:
96.7% (10,895)Foreign-born:
41.7% (253)
White (Caucasian) - Speak another language Native:
3.8% (429)Foreign-born:
57.9% (352)
Black or African American - Speak only English Native:
97.8% (475)Foreign-born:
100.0% (322)
Asian - Speak only English Native:
78.7% (100)Foreign-born:
5.6% (14)
Asian - Speak another language Native:
21.2% (27)Foreign-born:
90.9% (223)
Other race - Speak only English Native:
8.2% (40)Foreign-born:
10.6% (99)
Other race - Speak another language Native:
99.1% (477)Foreign-born:
89.4% (837)
Two or more races - Speak only English Native:
53.1% (1,899)Foreign-born:
7.1% (117)
Two or more races - Speak another language Native:
43.1% (1,542)Foreign-born:
92.9% (1,526)
White alone - Speak only English Native:
97.4% (9,971)Foreign-born:
43.7% (170)
White alone - Speak another language Native:
2.6% (266)Foreign-born:
55.3% (215)
Hispanic or Latino - Speak only English Native:
46.8% (1,591)Foreign-born:
9.2% (249)
Hispanic or Latino - Speak another language Native:
50.8% (1,729)Foreign-born:
90.4% (2,443)
Foreign-born residents in San Carlos Park 3,446 residents are foreign born (14.0% Latin America ).
This city:
17.1%Florida:
21.1%
Marital status for residents in San Carlos Park Marital status - White (Caucasian) population 15 years and over
Males 38.8% Never married43.8% Now married1.5% Separated0.9% Widowed14.9% DivorcedFemales 29.9% Never married42.7% Now married3.4% Separated8.7% Widowed15.2% DivorcedWomen who gave birth in the past 12 months Now married:
63.6% (81)Unmarried:
36.4% (46)
Women who did not give birth in the past 12 months Now married:
43.8% (1,144)Unmarried:
56.2% (1,468)
Marital status - Black or African American population 15 years and over
Males 84.3% Never married13.5% Now married0.0% Separated0.0% Widowed2.3% DivorcedFemales 55.6% Never married22.5% Now married0.0% Separated18.1% Widowed3.8% DivorcedWomen who gave birth in the past 12 months Now married:
0.0% (0)Unmarried:
100.0% (11)
Women who did not give birth in the past 12 months Now married:
25.5% (64)Unmarried:
74.5% (186)
Marital status - Asian population 15 years and over
Males 23.7% Never married24.6% Now married0.0% Separated51.8% Widowed0.0% DivorcedFemales 13.3% Never married61.4% Now married0.0% Separated0.0% Widowed25.3% DivorcedWomen who did not give birth in the past 12 months Now married:
56.2% (47)Unmarried:
43.8% (37)
Marital status - Other race population 15 years and over
Males 51.8% Never married41.6% Now married0.0% Separated0.0% Widowed6.6% DivorcedFemales 30.6% Never married54.8% Now married3.6% Separated0.0% Widowed11.0% DivorcedWomen who gave birth in the past 12 months Now married:
52.9% (8)Unmarried:
47.1% (7)
Women who did not give birth in the past 12 months Now married:
59.4% (187)Unmarried:
40.6% (128)
Marital status - Two or more races population 15 years and over
Males 53.8% Never married41.4% Now married0.0% Separated0.1% Widowed4.7% DivorcedFemales 49.4% Never married38.9% Now married0.0% Separated3.1% Widowed8.6% DivorcedWomen who did not give birth in the past 12 months Now married:
25.6% (335)Unmarried:
74.4% (975)
Marital status - White alone, not Hispanic / Latino population 15 years and over
Males 34.5% Never married46.5% Now married1.8% Separated1.0% Widowed16.2% DivorcedFemales 27.2% Never married46.4% Now married2.8% Separated7.4% Widowed16.2% DivorcedWomen who gave birth in the past 12 months Now married:
63.6% (91)Unmarried:
36.4% (52)
Women who did not give birth in the past 12 months Now married:
45.8% (1,001)Unmarried:
54.2% (1,186)
Marital status - Hispanic or Latino population 15 years and over
Males 57.0% Never married36.4% Now married0.0% Separated0.0% Widowed6.7% DivorcedFemales 38.4% Never married39.0% Now married3.7% Separated8.0% Widowed10.9% DivorcedWomen who gave birth in the past 12 months Now married:
52.9% (10)Unmarried:
47.1% (9)
Women who did not give birth in the past 12 months Now married:
39.5% (708)Unmarried:
60.5% (1,084)
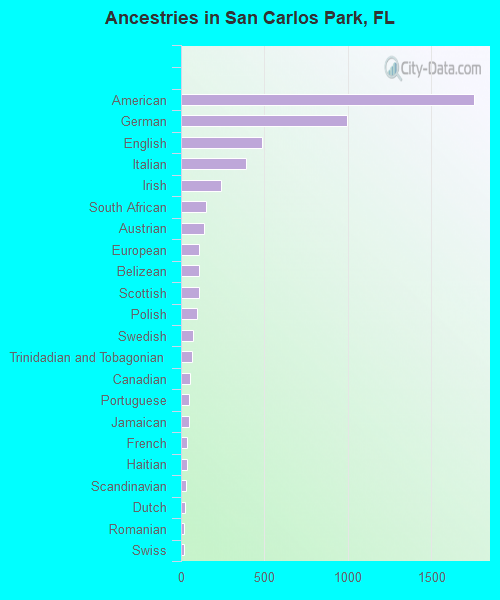
Ancestries in San Carlos Park
1,757 17.7% American993 10.0% German484 4.9% English392 3.9% Italian237 2.4% Irish148 1.5% South African136 1.4% Austrian110 1.1% European110 1.1% Belizean107 1.1% Scottish98 1.0% Polish71 0.7% Swedish65 0.7% Trinidadian and Tobagonian53 0.5% Canadian47 0.5% Portuguese47 0.5% Jamaican37 0.4% French35 0.4% Haitian30 0.3% Scandinavian23 0.2% Dutch17 0.2% Romanian16 0.2% Swiss14 0.1% Lithuanian12 0.1% Israeli12 0.1% Ukrainian10 0.1% Czech9 0.09% Finnish9 0.09% Greek9 0.09% Scotch-Irish9 0.09% African8 0.08% Norwegian7 0.07% British
Geographical mobility in San Carlos Park Same house 1 year ago 11,135 90.3% White (Caucasian)823 100.0% Black or African American307 83.4% Asian13 100.0% Native Hawaiian / Pacific Islander1,225 82.5% Other race4,445 81.7% Two or more races9,836 89.4% White alone, not Hispanic / Latino5,554 85.6% Hispanic or LatinoMoved within same county 329 2.7% White / Caucasian56 6.8% Black or African American11 3.1% Asian179 12.0% Other race694 12.7% Two or more races307 2.8% White alone, not Hispanic / Latino581 9.0% Hispanic or LatinoMoved within same state 575 4.7% White / Caucasian43 11.6% Asian7 0.4% Other race12 0.2% Two or more races581 5.3% White alone, not Hispanic / Latino70 1.1% Hispanic or LatinoMoved from different state 245 2.0% White / Caucasian43 2.9% Other race33 0.6% Two or more races232 2.1% White alone, not Hispanic / Latino42 0.6% Hispanic or LatinoMoved from abroad 134 1.1% White76 1.4% Two or more races114 1.0% White alone, not Hispanic / Latino60 0.9% Hispanic or Latino
Children Nativity (place of birth) in San Carlos Park
Children under 6 years - Living with two parents Both parents native 465 100.0% NativeBoth parents foreign-born 148 100.0% NativeOne native, one foreign-born parent 167 100.0% NativeChildren under 6 years - Living with one parent Native parent 354 100.0% NativeForeign-born parent 73 100.0% NativeChildren 6 to 17 years - Living with two parents Both parents native 716 99.8% Native2 0.2% Foreign-bornBoth parents foreign-born 712 97.8% Native16 2.2% Foreign-bornOne native, one foreign-born parent 403 97.6% Native10 2.4% Foreign-bornChildren 6 to 17 years - Living with one parent Native parent 570 100.0% NativeForeign-born parent 255 60.3% Native168 39.7% Foreign-born
Grandparents responsible for own grandchildren in San Carlos Park
Grandparents (30 to 59 years) White / Caucasian 37 57.5% Responsible for grandchildren28 42.5% Not responsible for grandchildrenWhite alone, not Hispanic / Latino 30 46.1% Responsible for grandchildren35 53.9% Not responsible for grandchildrenHispanic or Latino 15 100.0% Responsible for grandchildrenGrandparents (60 years and over) White / Caucasian 42 20.9% Responsible for grandchildren159 79.1% Not responsible for grandchildrenWhite alone, not Hispanic / Latino 32 15.5% Responsible for grandchildren173 84.5% Not responsible for grandchildrenHispanic or Latino 30 44.5% Responsible for grandchildren37 55.5% Not responsible for grandchildren