Races in Salisbury, North Carolina (NC) Detailed Stats
Data:
Races - White alone (%)
Races - White alone (% change since 2000)
Races - Black alone (%)
Races - Black alone (% change since 2000)
Races - American Indian alone (%)
Races - American Indian alone (% change since 2000)
Races - Asian alone (%)
Races - Asian alone (% change since 2000)
Races - Hispanic (%)
Races - Hispanic (% change since 2000)
Races - Native Hawaiian and Other Pacific Islander alone (%)
Races - Native Hawaiian and Other Pacific Islander alone (% change since 2000)
Races - Two or more races(%)
Races - Two or more races(% change since 2000)
Races - Other race alone (%)
Races - Other race alone (% change since 2000)
Racial diversity
Place of birth - Born in state of residence (%)
Place of birth - Born in state of residence (%) - White
Place of birth - Born in state of residence (%) - Black or African American
Place of birth - Born in state of residence (%) - Asian
Place of birth - Born in state of residence (%) - Hispanic or Latino
Place of birth - Born in state of residence (%) - American Indian and Alaska Native
Place of birth - Born in state of residence (%) - Multirace
Place of birth - Born in state of residence (%) - Other Race
Place of birth - Born in other state (%)
Place of birth - Born in other state (%) - White
Place of birth - Born in other state (%) - Black or African American
Place of birth - Born in other state (%) - Asian
Place of birth - Born in other state (%) - Hispanic or Latino
Place of birth - Born in other state (%) - American Indian and Alaska Native
Place of birth - Born in other state (%) - Multirace
Place of birth - Born in other state (%) - Other Race
Place of birth - Native, outside of US (%)
Place of birth - Native, outside of US (%) - White
Place of birth - Native, outside of US (%) - Black or African American
Place of birth - Native, outside of US (%) - Asian
Place of birth - Native, outside of US (%) - Hispanic or Latino
Place of birth - Native, outside of US (%) - American Indian and Alaska Native
Place of birth - Native, outside of US (%) - Multirace
Place of birth - Native, outside of US (%) - Other Race
Place of birth - Foreign born (%)
Place of birth - Foreign born (%) - White
Place of birth - Foreign born (%) - Black or African American
Place of birth - Foreign born (%) - Asian
Place of birth - Foreign born (%) - Hispanic or Latino
Place of birth - Foreign born (%) - American Indian and Alaska Native
Place of birth - Foreign born (%) - Multirace
Place of birth - Foreign born (%) - Other Race
Residents speaking English at home (%)
Residents speaking English at home - Born in the United States (%)
Residents speaking English at home - Native, born elsewhere (%)
Residents speaking English at home - Foreign born (%)
Residents speaking Spanish at home (%)
Residents speaking Spanish at home - Born in the United States (%)
Residents speaking Spanish at home - Native, born elsewhere (%)
Residents speaking Spanish at home - Foreign born (%)
Residents speaking other language at home (%)
Residents speaking other language at home - Born in the United States (%)
Residents speaking other language at home - Native, born elsewhere (%)
Residents speaking other language at home - Foreign born (%)
Marital status - Never married (%)
Marital status - Now married (%)
Marital status - Separated (%)
Marital status - Widowed (%)
Marital status - Divorced (%)
Ancestries Reported - Arab (%)
Ancestries Reported - Czech (%)
Ancestries Reported - Danish (%)
Ancestries Reported - Dutch (%)
Ancestries Reported - English (%)
Ancestries Reported - French (%)
Ancestries Reported - French Canadian (%)
Ancestries Reported - German (%)
Ancestries Reported - Greek (%)
Ancestries Reported - Hungarian (%)
Ancestries Reported - Irish (%)
Ancestries Reported - Italian (%)
Ancestries Reported - Lithuanian (%)
Ancestries Reported - Norwegian (%)
Ancestries Reported - Polish (%)
Ancestries Reported - Portuguese (%)
Ancestries Reported - Russian (%)
Ancestries Reported - Scotch-Irish (%)
Ancestries Reported - Scottish (%)
Ancestries Reported - Slovak (%)
Ancestries Reported - Subsaharan African (%)
Ancestries Reported - Swedish (%)
Ancestries Reported - Swiss (%)
Ancestries Reported - Ukrainian (%)
Ancestries Reported - United States (%)
Ancestries Reported - Welsh (%)
Ancestries Reported - West Indian (%)
Ancestries Reported - Other (%)
Geographical mobility - Same house 1 year ago (%)
Geographical mobility - Same house 1 year ago (%) - White
Geographical mobility - Same house 1 year ago (%) - Black or African American
Geographical mobility - Same house 1 year ago (%) - Asian
Geographical mobility - Same house 1 year ago (%) - Hispanic or Latino
Geographical mobility - Same house 1 year ago (%) - American Indian and Alaska Native
Geographical mobility - Same house 1 year ago (%) - Multirace
Geographical mobility - Same house 1 year ago (%) - Other Race
Geographical mobility - Moved within same county (%)
Geographical mobility - Moved within same county (%) - White
Geographical mobility - Moved within same county (%) - Black or African American
Geographical mobility - Moved within same county (%) - Asian
Geographical mobility - Moved within same county (%) - Hispanic or Latino
Geographical mobility - Moved within same county (%) - American Indian and Alaska Native
Geographical mobility - Moved within same county (%) - Multirace
Geographical mobility - Moved within same county (%) - Other Race
Geographical mobility - Moved from different county within same state (%)
Geographical mobility - Moved from different county within same state (%) - White
Geographical mobility - Moved from different county within same state (%) - Black or African American
Geographical mobility - Moved from different county within same state (%) - Asian
Geographical mobility - Moved from different county within same state (%) - Hispanic or Latino
Geographical mobility - Moved from different county within same state (%) - American Indian and Alaska Native
Geographical mobility - Moved from different county within same state (%) - Multirace
Geographical mobility - Moved from different county within same state (%) - Other Race
Geographical mobility - Moved from different state (%)
Geographical mobility - Moved from different state (%) - White
Geographical mobility - Moved from different state (%) - Black or African American
Geographical mobility - Moved from different state (%) - Asian
Geographical mobility - Moved from different state (%) - Hispanic or Latino
Geographical mobility - Moved from different state (%) - American Indian and Alaska Native
Geographical mobility - Moved from different state (%) - Multirace
Geographical mobility - Moved from different state (%) - Other Race
Geographical mobility - Moved from abroad (%)
Geographical mobility - Moved from abroad (%) - White
Geographical mobility - Moved from abroad (%) - Black or African American
Geographical mobility - Moved from abroad (%) - Asian
Geographical mobility - Moved from abroad (%) - Hispanic or Latino
Geographical mobility - Moved from abroad (%) - American Indian and Alaska Native
Geographical mobility - Moved from abroad (%) - Multirace
Geographical mobility - Moved from abroad (%) - Other Race
Place of birth for the foreign-born population - Ireland (%)
Place of birth for the foreign-born population - Denmark (%)
Place of birth for the foreign-born population - Norway (%)
Place of birth for the foreign-born population - Sweden (%)
Place of birth for the foreign-born population - United Kingdom (%)
Place of birth for the foreign-born population - England (%)
Place of birth for the foreign-born population - Scotland (%)
Place of birth for the foreign-born population - Other Northern Europe (%)
Place of birth for the foreign-born population - Austria (%)
Place of birth for the foreign-born population - Belgium (%)
Place of birth for the foreign-born population - France (%)
Place of birth for the foreign-born population - Germany (%)
Place of birth for the foreign-born population - Netherlands (%)
Place of birth for the foreign-born population - Switzerland (%)
Place of birth for the foreign-born population - Other Western Europe (%)
Place of birth for the foreign-born population - Greece (%)
Place of birth for the foreign-born population - Italy (%)
Place of birth for the foreign-born population - Portugal (%)
Place of birth for the foreign-born population - Spain (%)
Place of birth for the foreign-born population - Other Southern Europe (%)
Place of birth for the foreign-born population - Albania (%)
Place of birth for the foreign-born population - Belarus (%)
Place of birth for the foreign-born population - Bosnia and Herzegovina (%)
Place of birth for the foreign-born population - Bulgaria (%)
Place of birth for the foreign-born population - Croatia (%)
Place of birth for the foreign-born population - Czechoslovakia (%)
Place of birth for the foreign-born population - Hungary (%)
Place of birth for the foreign-born population - Latvia (%)
Place of birth for the foreign-born population - Lithuania (%)
Place of birth for the foreign-born population - North Macedonia (Macedonia) (%)
Place of birth for the foreign-born population - Moldova (%)
Place of birth for the foreign-born population - Poland (%)
Place of birth for the foreign-born population - Romania (%)
Place of birth for the foreign-born population - Russia (%)
Place of birth for the foreign-born population - Serbia (%)
Place of birth for the foreign-born population - Ukraine (%)
Place of birth for the foreign-born population - Other Eastern Europe (%)
Place of birth for the foreign-born population - China (%)
Place of birth for the foreign-born population - Hong Kong (%)
Place of birth for the foreign-born population - Taiwan (%)
Place of birth for the foreign-born population - Japan (%)
Place of birth for the foreign-born population - Korea (%)
Place of birth for the foreign-born population - Other Eastern Asia (%)
Place of birth for the foreign-born population - Afghanistan (%)
Place of birth for the foreign-born population - Bangladesh (%)
Place of birth for the foreign-born population - India (%)
Place of birth for the foreign-born population - Iran (%)
Place of birth for the foreign-born population - Kazakhstan (%)
Place of birth for the foreign-born population - Nepal (%)
Place of birth for the foreign-born population - Pakistan (%)
Place of birth for the foreign-born population - Sri Lanka (%)
Place of birth for the foreign-born population - Uzbekistan (%)
Place of birth for the foreign-born population - Other South Central Asia (%)
Place of birth for the foreign-born population - Burma (%)
Place of birth for the foreign-born population - Cambodia (%)
Place of birth for the foreign-born population - Indonesia (%)
Place of birth for the foreign-born population - Laos (%)
Place of birth for the foreign-born population - Malaysia (%)
Place of birth for the foreign-born population - Philippines (%)
Place of birth for the foreign-born population - Singapore (%)
Place of birth for the foreign-born population - Thailand (%)
Place of birth for the foreign-born population - Vietnam (%)
Place of birth for the foreign-born population - Other South Eastern Asia (%)
Place of birth for the foreign-born population - Armenia (%)
Place of birth for the foreign-born population - Iraq (%)
Place of birth for the foreign-born population - Israel (%)
Place of birth for the foreign-born population - Jordan (%)
Place of birth for the foreign-born population - Kuwait (%)
Place of birth for the foreign-born population - Lebanon (%)
Place of birth for the foreign-born population - Saudi Arabia (%)
Place of birth for the foreign-born population - Syria (%)
Place of birth for the foreign-born population - Turkey (%)
Place of birth for the foreign-born population - Yemen (%)
Place of birth for the foreign-born population - Other Western Asia (%)
Place of birth for the foreign-born population - Eritrea (%)
Place of birth for the foreign-born population - Ethiopia (%)
Place of birth for the foreign-born population - Kenya (%)
Place of birth for the foreign-born population - Somalia (%)
Place of birth for the foreign-born population - Uganda (%)
Place of birth for the foreign-born population - Zimbabwe (%)
Place of birth for the foreign-born population - Other Eastern Africa (%)
Place of birth for the foreign-born population - Cameroon (%)
Place of birth for the foreign-born population - Congo (%)
Place of birth for the foreign-born population - Democratic Republic of Congo (Zaire) (%)
Place of birth for the foreign-born population - Other Middle Africa (%)
Place of birth for the foreign-born population - Egypt (%)
Place of birth for the foreign-born population - Morocco (%)
Place of birth for the foreign-born population - Sudan (%)
Place of birth for the foreign-born population - Other Northern Africa (%)
Place of birth for the foreign-born population - South Africa (%)
Place of birth for the foreign-born population - Other Southern Africa (%)
Place of birth for the foreign-born population - Cabo Verde (%)
Place of birth for the foreign-born population - Ghana (%)
Place of birth for the foreign-born population - Liberia (%)
Place of birth for the foreign-born population - Nigeria (%)
Place of birth for the foreign-born population - Senegal (%)
Place of birth for the foreign-born population - Sierra Leone (%)
Place of birth for the foreign-born population - Other Western Africa (%)
Place of birth for the foreign-born population - Australia (%)
Place of birth for the foreign-born population - New Zealand (%)
Place of birth for the foreign-born population - Fiji (%)
Place of birth for the foreign-born population - Micronesia (%)
Place of birth for the foreign-born population - Bahamas (%)
Place of birth for the foreign-born population - Barbados (%)
Place of birth for the foreign-born population - Cuba (%)
Place of birth for the foreign-born population - Dominica (%)
Place of birth for the foreign-born population - Dominican Republic (%)
Place of birth for the foreign-born population - Grenada (%)
Place of birth for the foreign-born population - Haiti (%)
Place of birth for the foreign-born population - Jamaica (%)
Place of birth for the foreign-born population - St. Vincent and the Grenadines (%)
Place of birth for the foreign-born population - Trinidad and Tobago (%)
Place of birth for the foreign-born population - West Indies (%)
Place of birth for the foreign-born population - Other Caribbean (%)
Place of birth for the foreign-born population - Belize (%)
Place of birth for the foreign-born population - Costa Rica (%)
Place of birth for the foreign-born population - El Salvador (%)
Place of birth for the foreign-born population - Guatemala (%)
Place of birth for the foreign-born population - Honduras (%)
Place of birth for the foreign-born population - Mexico (%)
Place of birth for the foreign-born population - Nicaragua (%)
Place of birth for the foreign-born population - Panama (%)
Place of birth for the foreign-born population - Other Central America (%)
Place of birth for the foreign-born population - Argentina (%)
Place of birth for the foreign-born population - Bolivia (%)
Place of birth for the foreign-born population - Brazil (%)
Place of birth for the foreign-born population - Chile (%)
Place of birth for the foreign-born population - Colombia (%)
Place of birth for the foreign-born population - Ecuador (%)
Place of birth for the foreign-born population - Guyana (%)
Place of birth for the foreign-born population - Peru (%)
Place of birth for the foreign-born population - Uruguay (%)
Place of birth for the foreign-born population - Venezuela (%)
Place of birth for the foreign-born population - Other South America (%)
Place of birth for the foreign-born population - Canada (%)
Place of birth for the foreign-born population - Other Northern America (%)
Place of birth for the foreign-born population - Other (%)
Latest news about races in Salisbury, NC collected exclusively by city-data.com from local newspapers, TV, and radio stations
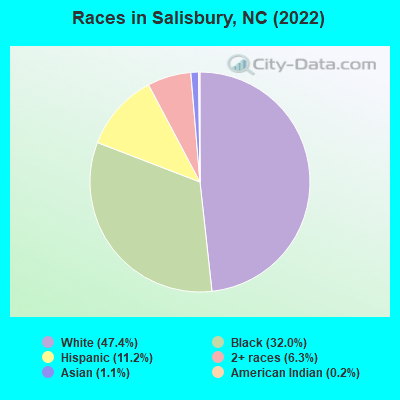
According to 2022 data, the most numerous races in Salisbury, NC are White alone (17,084 residents), Black alone (11,537 residents), and Hispanic (4,025 residents). 88.3% of Salisbury residents speak English at home. 5.8% of Salisbury, NC residents are foreign-born (3.6% born in Latin America, 1.1% born in Asia), which is 37.0% less than the foreign-born rate of 8.0% across the entire state of North Carolina.
Race distribution in Salisbury
2000 2022
5,647,155 70.2% White alone 1,723,301 21.4% Black alone 378,963 4.7% Hispanic 112,416 1.4% Asian alone 95,333 1.2% American Indian alone 79,965 1.0% Two or more races 9,015 0.1% Other race alone 3,165 0.04% Native Hawaiian and Other
6,497,519 60.7% White alone 2,155,650 20.1% Black alone 1,114,799 10.4% Hispanic 438,061 4.1% Two or more races 341,052 3.2% Asian alone 91,758 0.9% American Indian alone 50,180 0.5% Other race alone 9,954 0.09% Native Hawaiian and Other
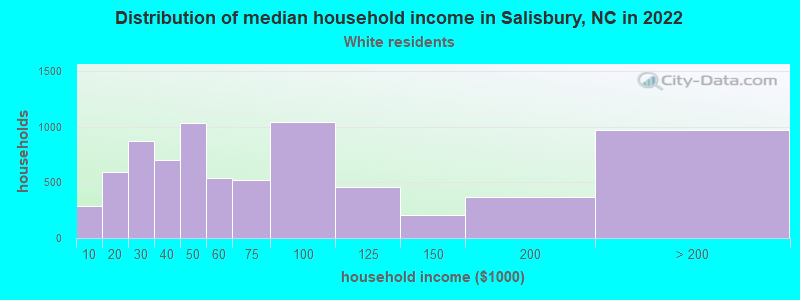
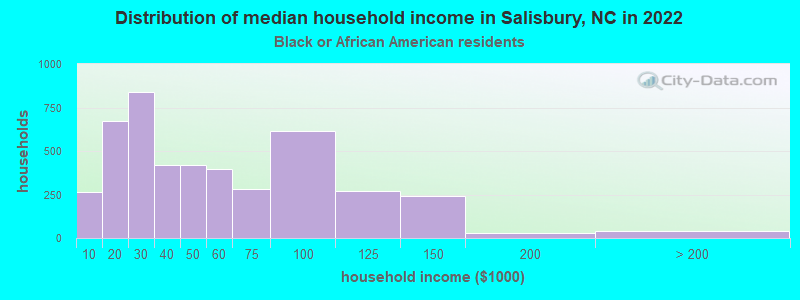
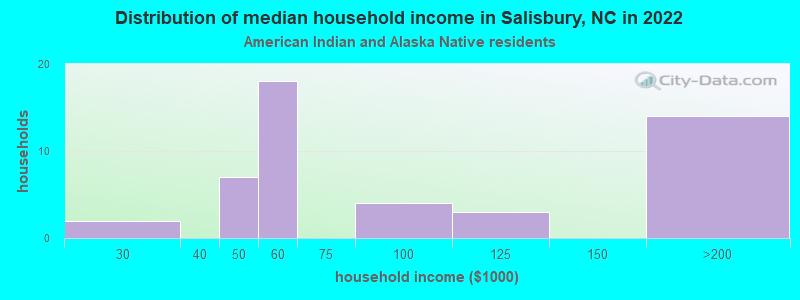
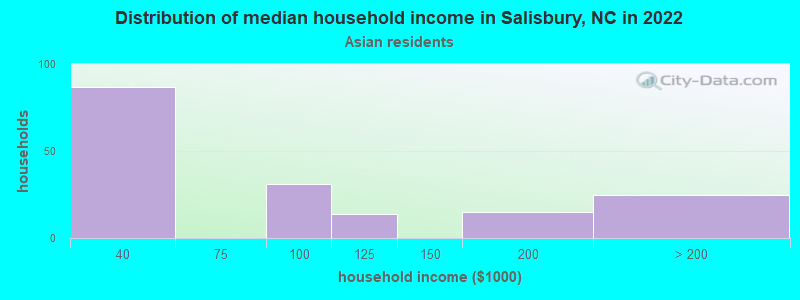
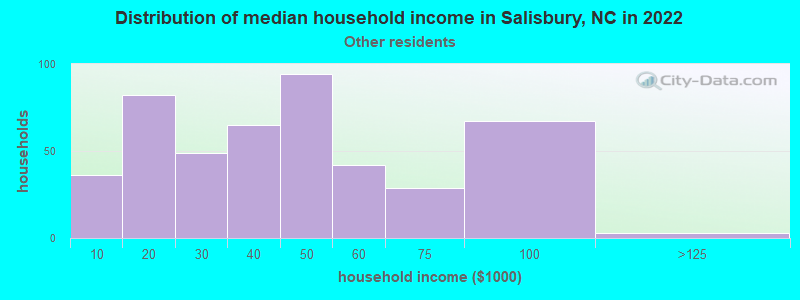
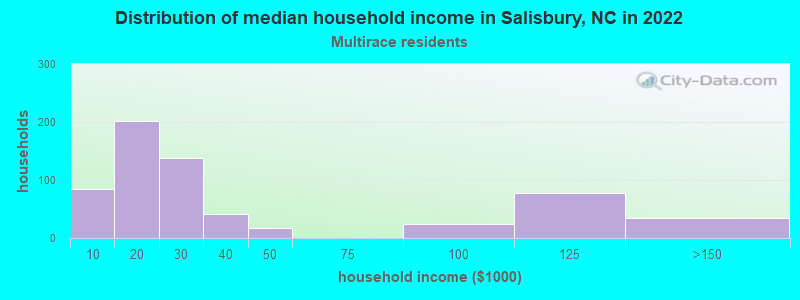
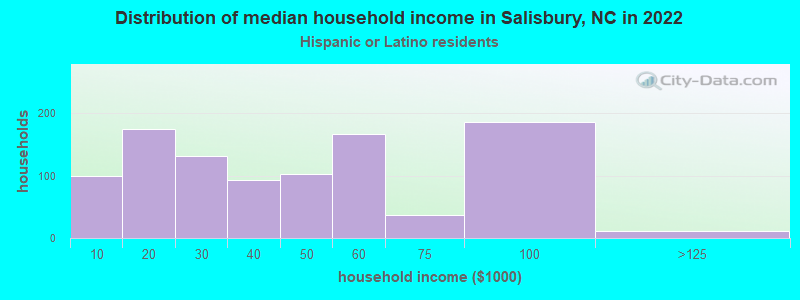
Income and house value in Salisbury Median household income in 2022 $58,263 White non-Hispanic householders$33,499 Black householders$57,590 American Indian and Alaska Native householders$51,717 Some other race householders$48,951 Two or more races householders$38,891 Hispanic or Latino race householdersMedian 2022 house value $252,675 White Non-Hispanic householders$162,434 Black or African American householders$161,722 American Indian or Alaska Native householders $209,217 Asian householders$193,069 Some other race householders$182,145 Two or more races householders$203,755 Hispanic or Latino householders
Median age by race in Salisbury
42.9 Median age for White residents39.7 45.9 33.2 Median age for Black or African American residents30.6 36.2 20.5 Median age for American Indian / Alaska Native residents23.8 45.9 56.6 Median age for Asian residents42.1 77.7 -609,884,331.7 Median age for Native Hawaiian / Pacific Islander residents-666,666,666.0 -666,666,666.0 34.6 Median age for Other race residents42.2 28.3 28.3 Median age for Two or more races residents17.5 31.7 45.7 Median age for White alone residents41.8 48.7 22.5 Median age for Hispanic or Latino residents16.9 27.0
Owner/renter occupied households by race in Salisbury
House owners and renters - White residents 4,939 67.0% Owner occupied2,433 33.0% Renter occupiedHouse owners and renters - Black or African American residents 1,764 49.5% Owner occupied1,796 50.5% Renter occupiedHouse owners and renters - American Indian / Alaska Native residents 31 62.9% Owner occupied19 37.1% Renter occupiedHouse owners and renters - Asian residents 104 63.1% Owner occupied61 36.9% Renter occupiedHouse owners and renters - Native Hawaiian / Pacific Islander residents 18 77.2% Owner occupied5 22.8% Renter occupiedHouse owners and renters - Other race residents 86 14.0% Owner occupied531 86.0% Renter occupiedHouse owners and renters - Two or more races residents 264 37.8% Owner occupied434 62.2% Renter occupiedHouse owners and renters - White alone residents 4,879 68.4% Owner occupied2,251 31.6% Renter occupiedHouse owners and renters - Hispanic or Latino residents 230 21.6% Owner occupied834 78.4% Renter occupied
Language usage in Salisbury
English speakers - Total 88.3% of residents of Salisbury speak English at home.
7.1% of residents speak Spanish at home 1,421 58.5% Speak English very well1,006 41.5% Speak English less than very well4.3% of residents speak other language at home 1,041 71.2% Speak English very well421 28.8% Speak English less than very well
English speakers - Born in the United States 93.1% of residents of Salisbury speak English at home.
5.4% of residents speak Spanish at home 473 82.8% Speak English very well98 17.2% Speak English less than very well1.2% of residents speak other language at home 124 100.0% Speak English very well
English speakers - Native, born elsewhere 41.8% of residents of Salisbury speak English at home.
47.2% of residents speak Spanish at home 113 51.4% Speak English very well107 48.6% Speak English less than very well
English speakers - Foreign-born 12.9% of residents of Salisbury speak English at home.
36.9% of residents speak Spanish at home 158 17.1% Speak English very well765 82.9% Speak English less than very well62.8% of residents speak other language at home 713 45.4% Speak English very well857 54.6% Speak English less than very well
White (Caucasian) - Speak only English Native:
96.1% (16,128)Foreign-born:
10.9% (102)
White (Caucasian) - Speak another language Native:
3.5% (588)Foreign-born:
85.5% (794)
Black or African American - Speak only English Native:
98.3% (11,933)Foreign-born:
42.5% (120)
Black or African American - Speak another language Native:
1.7% (204)Foreign-born:
57.5% (162)
Asian - Speak another language Native:
14.1% (38)Foreign-born:
100.0% (241)
Other race - Speak only English Native:
23.9% (152)Foreign-born:
0.5% (5)
Other race - Speak another language Native:
74.5% (475)Foreign-born:
90.5% (890)
Two or more races - Speak only English Native:
76.0% (1,467)Foreign-born:
2.6% (5)
Two or more races - Speak another language Native:
24.2% (467)Foreign-born:
98.0% (205)
White alone - Speak only English Native:
98.1% (16,101)Foreign-born:
13.2% (51)
White alone - Speak another language Native:
1.9% (314)Foreign-born:
86.7% (335)
Hispanic or Latino - Speak only English Native:
42.8% (1,054)Foreign-born:
5.7% (60)
Hispanic or Latino - Speak another language Native:
58.4% (1,438)Foreign-born:
89.3% (934)
Foreign-born residents in Salisbury 2,106 residents are foreign born (3.6% Latin America , 1.1% Asia ).
This city:
5.8%North Carolina:
8.3%
Marital status for residents in Salisbury Marital status - White (Caucasian) population 15 years and over
Males 28.7% Never married53.5% Now married1.5% Separated5.0% Widowed11.4% DivorcedFemales 26.0% Never married43.0% Now married2.2% Separated13.1% Widowed15.6% DivorcedWomen who gave birth in the past 12 months Now married:
60.8% (139)Unmarried:
39.2% (89)
Women who did not give birth in the past 12 months Now married:
41.8% (1,590)Unmarried:
58.2% (2,217)
Marital status - Black or African American population 15 years and over
Males 58.1% Never married29.6% Now married1.0% Separated1.8% Widowed9.5% DivorcedFemales 48.7% Never married27.8% Now married3.3% Separated8.1% Widowed12.0% DivorcedWomen who gave birth in the past 12 months Now married:
25.5% (40)Unmarried:
74.5% (118)
Women who did not give birth in the past 12 months Now married:
27.8% (809)Unmarried:
72.2% (2,097)
Marital status - American Indian / Alaska Native population 15 years and over
Males 36.2% Never married36.2% Now married0.0% Separated0.0% Widowed27.7% DivorcedFemales 22.9% Never married42.9% Now married0.0% Separated0.0% Widowed34.3% DivorcedWomen who did not give birth in the past 12 months Now married:
60.0% (13)Unmarried:
40.0% (8)
Marital status - Asian population 15 years and over
Males 13.8% Never married65.5% Now married0.0% Separated13.8% Widowed6.9% DivorcedFemales 44.5% Never married55.5% Now married0.0% Separated0.0% Widowed0.0% DivorcedWomen who did not give birth in the past 12 months Now married:
0.0% (0)Unmarried:
100.0% (81)
Marital status - Other race population 15 years and over
Males 57.2% Never married31.2% Now married0.0% Separated0.0% Widowed11.6% DivorcedFemales 43.0% Never married51.8% Now married2.1% Separated0.0% Widowed3.2% DivorcedWomen who did not give birth in the past 12 months Now married:
52.7% (171)Unmarried:
47.3% (154)
Marital status - Two or more races population 15 years and over
Males 85.1% Never married6.4% Now married4.6% Separated0.4% Widowed3.5% DivorcedFemales 51.1% Never married20.0% Now married2.3% Separated3.7% Widowed22.9% DivorcedWomen who gave birth in the past 12 months Now married:
0.0% (0)Unmarried:
100.0% (34)
Women who did not give birth in the past 12 months Now married:
18.5% (100)Unmarried:
81.5% (441)
Marital status - White alone, not Hispanic / Latino population 15 years and over
Males 28.3% Never married53.1% Now married1.4% Separated5.3% Widowed11.9% DivorcedFemales 24.3% Never married43.7% Now married1.6% Separated14.0% Widowed16.4% DivorcedWomen who gave birth in the past 12 months Now married:
78.1% (142)Unmarried:
21.9% (40)
Women who did not give birth in the past 12 months Now married:
41.6% (1,470)Unmarried:
58.4% (2,067)
Marital status - Hispanic or Latino population 15 years and over
Males 62.8% Never married31.5% Now married0.9% Separated0.0% Widowed4.8% DivorcedFemales 43.3% Never married38.7% Now married6.7% Separated0.0% Widowed11.2% DivorcedWomen who gave birth in the past 12 months Now married:
0.0% (0)Unmarried:
100.0% (97)
Women who did not give birth in the past 12 months Now married:
46.8% (367)Unmarried:
53.2% (417)
Ancestries in Salisbury
1,661 7.9% German1,486 7.0% American1,300 6.2% English399 1.9% Irish389 1.8% Scotch-Irish318 1.5% Italian310 1.5% Scottish191 0.9% European170 0.8% Polish134 0.6% African122 0.6% Liberian97 0.5% Eastern European93 0.4% British84 0.4% Russian83 0.4% Jamaican78 0.4% French54 0.3% Albanian45 0.2% Welsh31 0.1% Sudanese28 0.1% Haitian27 0.1% Romanian26 0.1% Lebanese19 0.09% Swedish16 0.08% Finnish15 0.07% Hungarian15 0.07% Latvian14 0.07% Danish14 0.07% Portuguese13 0.06% Slovak10 0.05% Slovene10 0.05% Swiss9 0.04% Trinidadian and Tobagonian7 0.03% Israeli6 0.03% Northern European5 0.02% French Canadian5 0.02% Canadian
Geographical mobility in Salisbury Same house 1 year ago 15,220 83.2% White (Caucasian)9,912 86.4% Black or African American103 100.0% American Indian / Alaska Native443 88.4% Asian7 27.1% Native Hawaiian / Pacific Islander1,262 92.1% Other race2,193 81.1% Two or more races14,095 83.1% White alone, not Hispanic / Latino3,319 89.6% Hispanic or LatinoMoved within same county 534 2.9% White / Caucasian545 4.7% Black or African American33 2.4% Other race98 3.6% Two or more races527 3.1% White alone, not Hispanic / Latino30 0.8% Hispanic or LatinoMoved within same state 1,817 9.9% White / Caucasian535 4.7% Black or African American43 8.5% Asian26 100.0% Native Hawaiian / Pacific Islander70 5.1% Other race275 10.2% Two or more races1,663 9.8% White alone, not Hispanic / Latino284 7.7% Hispanic or LatinoMoved from different state 1,047 5.7% White / Caucasian406 3.5% Black or African American13 2.5% Asian56 2.1% Two or more races1,049 6.2% White alone, not Hispanic / Latino36 1.0% Hispanic or LatinoMoved from abroad 198 1.1% White142 1.2% Black or African American14 1.0% Other race188 1.1% White alone, not Hispanic / Latino107 2.9% Hispanic or Latino
Children Nativity (place of birth) in Salisbury
Children under 6 years - Living with two parents Both parents native 894 100.0% NativeBoth parents foreign-born 86 100.0% NativeChildren under 6 years - Living with one parent Native parent 1,256 100.0% NativeForeign-born parent 194 100.0% NativeChildren 6 to 17 years - Living with two parents Both parents native 2,128 99.8% Native4 0.2% Foreign-bornBoth parents foreign-born 45 52.5% Native41 47.5% Foreign-bornOne native, one foreign-born parent 127 100.0% NativeChildren 6 to 17 years - Living with one parent Native parent 2,573 100.0% NativeForeign-born parent 404 51.8% Native377 48.2% Foreign-born
Grandparents responsible for own grandchildren in Salisbury
Grandparents (30 to 59 years) White / Caucasian 78 28.6% Responsible for grandchildren195 71.4% Not responsible for grandchildrenBlack or African American 158 95.2% Responsible for grandchildren8 4.8% Not responsible for grandchildrenWhite alone, not Hispanic / Latino 78 50.4% Responsible for grandchildren77 49.6% Not responsible for grandchildrenHispanic or Latino 166 100.0% Not responsible for grandchildrenGrandparents (60 years and over) White / Caucasian 30 60.3% Responsible for grandchildren20 39.7% Not responsible for grandchildrenBlack or African American 37 19.9% Responsible for grandchildren148 80.1% Not responsible for grandchildrenWhite alone, not Hispanic / Latino 33 69.5% Responsible for grandchildren15 30.5% Not responsible for grandchildren