Races in Salem, Virginia (VA) Detailed Stats
Data:
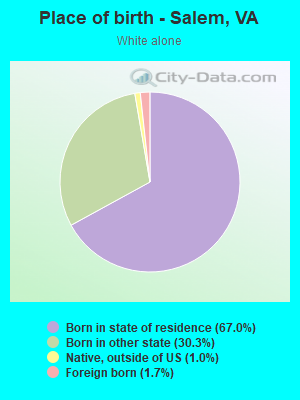
Races - White alone (%)
Races - White alone (% change since 2000)
Races - Black alone (%)
Races - Black alone (% change since 2000)
Races - American Indian alone (%)
Races - American Indian alone (% change since 2000)
Races - Asian alone (%)
Races - Asian alone (% change since 2000)
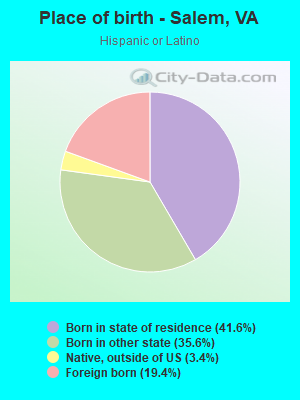
Races - Hispanic (%)
Races - Hispanic (% change since 2000)
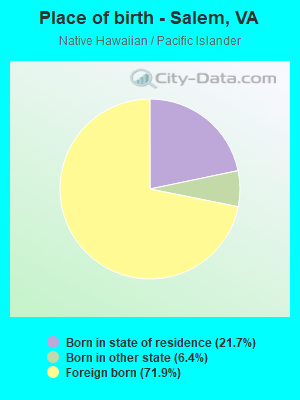
Races - Native Hawaiian and Other Pacific Islander alone (%)
Races - Native Hawaiian and Other Pacific Islander alone (% change since 2000)
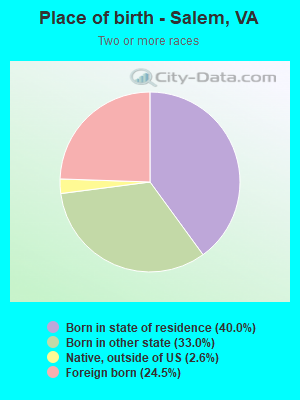
Races - Two or more races(%)
Races - Two or more races(% change since 2000)
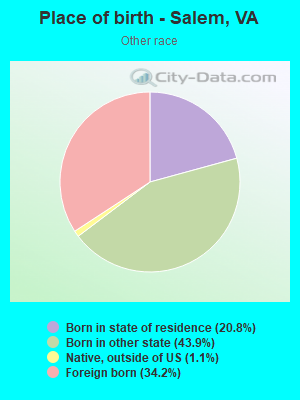
Races - Other race alone (%)
Races - Other race alone (% change since 2000)
Racial diversity
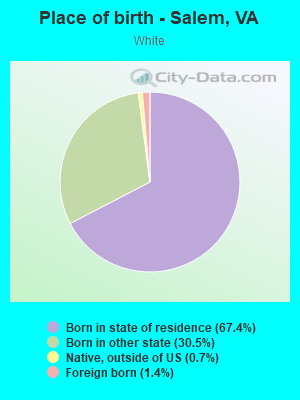
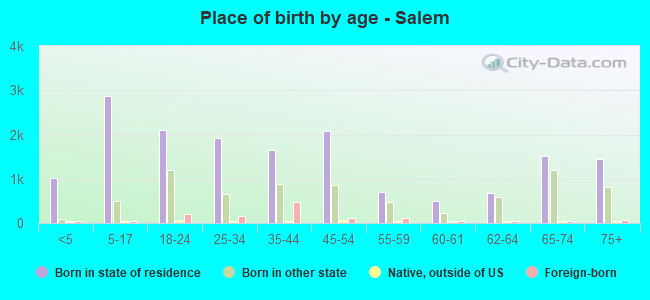
Place of birth - Born in state of residence (%)
Place of birth - Born in state of residence (%) - White
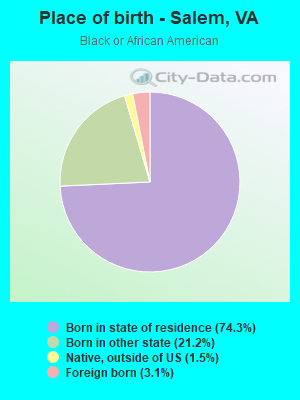
Place of birth - Born in state of residence (%) - Black or African American
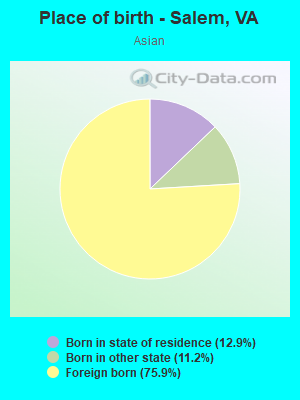
Place of birth - Born in state of residence (%) - Asian
Place of birth - Born in state of residence (%) - Hispanic or Latino
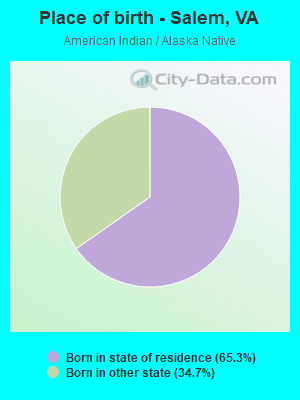
Place of birth - Born in state of residence (%) - American Indian and Alaska Native
Place of birth - Born in state of residence (%) - Multirace
Place of birth - Born in state of residence (%) - Other Race
Place of birth - Born in other state (%)
Place of birth - Born in other state (%) - White
Place of birth - Born in other state (%) - Black or African American
Place of birth - Born in other state (%) - Asian
Place of birth - Born in other state (%) - Hispanic or Latino
Place of birth - Born in other state (%) - American Indian and Alaska Native
Place of birth - Born in other state (%) - Multirace
Place of birth - Born in other state (%) - Other Race
Place of birth - Native, outside of US (%)
Place of birth - Native, outside of US (%) - White
Place of birth - Native, outside of US (%) - Black or African American
Place of birth - Native, outside of US (%) - Asian
Place of birth - Native, outside of US (%) - Hispanic or Latino
Place of birth - Native, outside of US (%) - American Indian and Alaska Native
Place of birth - Native, outside of US (%) - Multirace
Place of birth - Native, outside of US (%) - Other Race
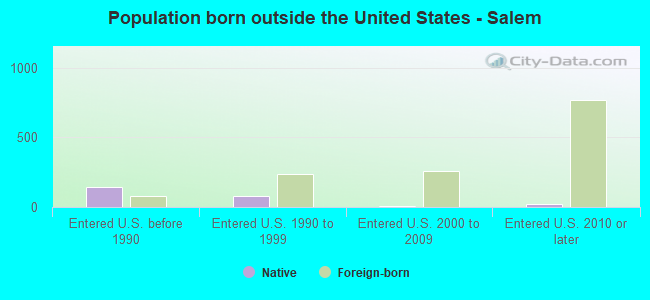
Place of birth - Foreign born (%)
Place of birth - Foreign born (%) - White
Place of birth - Foreign born (%) - Black or African American
Place of birth - Foreign born (%) - Asian
Place of birth - Foreign born (%) - Hispanic or Latino
Place of birth - Foreign born (%) - American Indian and Alaska Native
Place of birth - Foreign born (%) - Multirace
Place of birth - Foreign born (%) - Other Race
Residents speaking English at home (%)
Residents speaking English at home - Born in the United States (%)
Residents speaking English at home - Native, born elsewhere (%)
Residents speaking English at home - Foreign born (%)
Residents speaking Spanish at home (%)
Residents speaking Spanish at home - Born in the United States (%)
Residents speaking Spanish at home - Native, born elsewhere (%)
Residents speaking Spanish at home - Foreign born (%)
Residents speaking other language at home (%)
Residents speaking other language at home - Born in the United States (%)
Residents speaking other language at home - Native, born elsewhere (%)
Residents speaking other language at home - Foreign born (%)
Marital status - Never married (%)
Marital status - Now married (%)
Marital status - Separated (%)
Marital status - Widowed (%)
Marital status - Divorced (%)
Ancestries Reported - Arab (%)
Ancestries Reported - Czech (%)
Ancestries Reported - Danish (%)
Ancestries Reported - Dutch (%)
Ancestries Reported - English (%)
Ancestries Reported - French (%)
Ancestries Reported - French Canadian (%)
Ancestries Reported - German (%)
Ancestries Reported - Greek (%)
Ancestries Reported - Hungarian (%)
Ancestries Reported - Irish (%)
Ancestries Reported - Italian (%)
Ancestries Reported - Lithuanian (%)
Ancestries Reported - Norwegian (%)
Ancestries Reported - Polish (%)
Ancestries Reported - Portuguese (%)
Ancestries Reported - Russian (%)
Ancestries Reported - Scotch-Irish (%)
Ancestries Reported - Scottish (%)
Ancestries Reported - Slovak (%)
Ancestries Reported - Subsaharan African (%)
Ancestries Reported - Swedish (%)
Ancestries Reported - Swiss (%)
Ancestries Reported - Ukrainian (%)
Ancestries Reported - United States (%)
Ancestries Reported - Welsh (%)
Ancestries Reported - West Indian (%)
Ancestries Reported - Other (%)
Geographical mobility - Same house 1 year ago (%)
Geographical mobility - Same house 1 year ago (%) - White
Geographical mobility - Same house 1 year ago (%) - Black or African American
Geographical mobility - Same house 1 year ago (%) - Asian
Geographical mobility - Same house 1 year ago (%) - Hispanic or Latino
Geographical mobility - Same house 1 year ago (%) - American Indian and Alaska Native
Geographical mobility - Same house 1 year ago (%) - Multirace
Geographical mobility - Same house 1 year ago (%) - Other Race
Geographical mobility - Moved within same county (%)
Geographical mobility - Moved within same county (%) - White
Geographical mobility - Moved within same county (%) - Black or African American
Geographical mobility - Moved within same county (%) - Asian
Geographical mobility - Moved within same county (%) - Hispanic or Latino
Geographical mobility - Moved within same county (%) - American Indian and Alaska Native
Geographical mobility - Moved within same county (%) - Multirace
Geographical mobility - Moved within same county (%) - Other Race
Geographical mobility - Moved from different county within same state (%)
Geographical mobility - Moved from different county within same state (%) - White
Geographical mobility - Moved from different county within same state (%) - Black or African American
Geographical mobility - Moved from different county within same state (%) - Asian
Geographical mobility - Moved from different county within same state (%) - Hispanic or Latino
Geographical mobility - Moved from different county within same state (%) - American Indian and Alaska Native
Geographical mobility - Moved from different county within same state (%) - Multirace
Geographical mobility - Moved from different county within same state (%) - Other Race
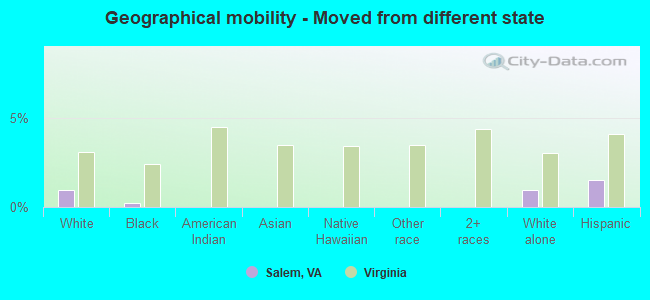
Geographical mobility - Moved from different state (%)
Geographical mobility - Moved from different state (%) - White
Geographical mobility - Moved from different state (%) - Black or African American
Geographical mobility - Moved from different state (%) - Asian
Geographical mobility - Moved from different state (%) - Hispanic or Latino
Geographical mobility - Moved from different state (%) - American Indian and Alaska Native
Geographical mobility - Moved from different state (%) - Multirace
Geographical mobility - Moved from different state (%) - Other Race
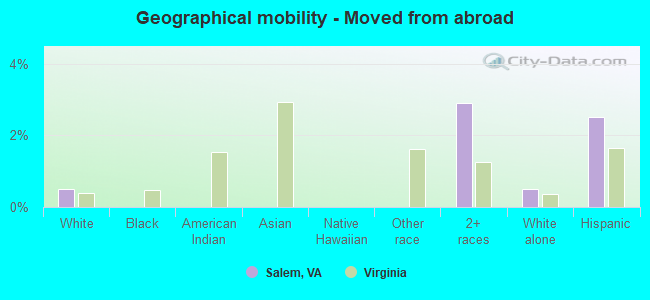
Geographical mobility - Moved from abroad (%)
Geographical mobility - Moved from abroad (%) - White
Geographical mobility - Moved from abroad (%) - Black or African American
Geographical mobility - Moved from abroad (%) - Asian
Geographical mobility - Moved from abroad (%) - Hispanic or Latino
Geographical mobility - Moved from abroad (%) - American Indian and Alaska Native
Geographical mobility - Moved from abroad (%) - Multirace
Geographical mobility - Moved from abroad (%) - Other Race
Place of birth for the foreign-born population - Ireland (%)
Place of birth for the foreign-born population - Denmark (%)
Place of birth for the foreign-born population - Norway (%)
Place of birth for the foreign-born population - Sweden (%)
Place of birth for the foreign-born population - United Kingdom (%)
Place of birth for the foreign-born population - England (%)
Place of birth for the foreign-born population - Scotland (%)
Place of birth for the foreign-born population - Other Northern Europe (%)
Place of birth for the foreign-born population - Austria (%)
Place of birth for the foreign-born population - Belgium (%)
Place of birth for the foreign-born population - France (%)
Place of birth for the foreign-born population - Germany (%)
Place of birth for the foreign-born population - Netherlands (%)
Place of birth for the foreign-born population - Switzerland (%)
Place of birth for the foreign-born population - Other Western Europe (%)
Place of birth for the foreign-born population - Greece (%)
Place of birth for the foreign-born population - Italy (%)
Place of birth for the foreign-born population - Portugal (%)
Place of birth for the foreign-born population - Spain (%)
Place of birth for the foreign-born population - Other Southern Europe (%)
Place of birth for the foreign-born population - Albania (%)
Place of birth for the foreign-born population - Belarus (%)
Place of birth for the foreign-born population - Bosnia and Herzegovina (%)
Place of birth for the foreign-born population - Bulgaria (%)
Place of birth for the foreign-born population - Croatia (%)
Place of birth for the foreign-born population - Czechoslovakia (%)
Place of birth for the foreign-born population - Hungary (%)
Place of birth for the foreign-born population - Latvia (%)
Place of birth for the foreign-born population - Lithuania (%)
Place of birth for the foreign-born population - North Macedonia (Macedonia) (%)
Place of birth for the foreign-born population - Moldova (%)
Place of birth for the foreign-born population - Poland (%)
Place of birth for the foreign-born population - Romania (%)
Place of birth for the foreign-born population - Russia (%)
Place of birth for the foreign-born population - Serbia (%)
Place of birth for the foreign-born population - Ukraine (%)
Place of birth for the foreign-born population - Other Eastern Europe (%)
Place of birth for the foreign-born population - China (%)
Place of birth for the foreign-born population - Hong Kong (%)
Place of birth for the foreign-born population - Taiwan (%)
Place of birth for the foreign-born population - Japan (%)
Place of birth for the foreign-born population - Korea (%)
Place of birth for the foreign-born population - Other Eastern Asia (%)
Place of birth for the foreign-born population - Afghanistan (%)
Place of birth for the foreign-born population - Bangladesh (%)
Place of birth for the foreign-born population - India (%)
Place of birth for the foreign-born population - Iran (%)
Place of birth for the foreign-born population - Kazakhstan (%)
Place of birth for the foreign-born population - Nepal (%)
Place of birth for the foreign-born population - Pakistan (%)
Place of birth for the foreign-born population - Sri Lanka (%)
Place of birth for the foreign-born population - Uzbekistan (%)
Place of birth for the foreign-born population - Other South Central Asia (%)
Place of birth for the foreign-born population - Burma (%)
Place of birth for the foreign-born population - Cambodia (%)
Place of birth for the foreign-born population - Indonesia (%)
Place of birth for the foreign-born population - Laos (%)
Place of birth for the foreign-born population - Malaysia (%)
Place of birth for the foreign-born population - Philippines (%)
Place of birth for the foreign-born population - Singapore (%)
Place of birth for the foreign-born population - Thailand (%)
Place of birth for the foreign-born population - Vietnam (%)
Place of birth for the foreign-born population - Other South Eastern Asia (%)
Place of birth for the foreign-born population - Armenia (%)
Place of birth for the foreign-born population - Iraq (%)
Place of birth for the foreign-born population - Israel (%)
Place of birth for the foreign-born population - Jordan (%)
Place of birth for the foreign-born population - Kuwait (%)
Place of birth for the foreign-born population - Lebanon (%)
Place of birth for the foreign-born population - Saudi Arabia (%)
Place of birth for the foreign-born population - Syria (%)
Place of birth for the foreign-born population - Turkey (%)
Place of birth for the foreign-born population - Yemen (%)
Place of birth for the foreign-born population - Other Western Asia (%)
Place of birth for the foreign-born population - Eritrea (%)
Place of birth for the foreign-born population - Ethiopia (%)
Place of birth for the foreign-born population - Kenya (%)
Place of birth for the foreign-born population - Somalia (%)
Place of birth for the foreign-born population - Uganda (%)
Place of birth for the foreign-born population - Zimbabwe (%)
Place of birth for the foreign-born population - Other Eastern Africa (%)
Place of birth for the foreign-born population - Cameroon (%)
Place of birth for the foreign-born population - Congo (%)
Place of birth for the foreign-born population - Democratic Republic of Congo (Zaire) (%)
Place of birth for the foreign-born population - Other Middle Africa (%)
Place of birth for the foreign-born population - Egypt (%)
Place of birth for the foreign-born population - Morocco (%)
Place of birth for the foreign-born population - Sudan (%)
Place of birth for the foreign-born population - Other Northern Africa (%)
Place of birth for the foreign-born population - South Africa (%)
Place of birth for the foreign-born population - Other Southern Africa (%)
Place of birth for the foreign-born population - Cabo Verde (%)
Place of birth for the foreign-born population - Ghana (%)
Place of birth for the foreign-born population - Liberia (%)
Place of birth for the foreign-born population - Nigeria (%)
Place of birth for the foreign-born population - Senegal (%)
Place of birth for the foreign-born population - Sierra Leone (%)
Place of birth for the foreign-born population - Other Western Africa (%)
Place of birth for the foreign-born population - Australia (%)
Place of birth for the foreign-born population - New Zealand (%)
Place of birth for the foreign-born population - Fiji (%)
Place of birth for the foreign-born population - Micronesia (%)
Place of birth for the foreign-born population - Bahamas (%)
Place of birth for the foreign-born population - Barbados (%)
Place of birth for the foreign-born population - Cuba (%)
Place of birth for the foreign-born population - Dominica (%)
Place of birth for the foreign-born population - Dominican Republic (%)
Place of birth for the foreign-born population - Grenada (%)
Place of birth for the foreign-born population - Haiti (%)
Place of birth for the foreign-born population - Jamaica (%)
Place of birth for the foreign-born population - St. Vincent and the Grenadines (%)
Place of birth for the foreign-born population - Trinidad and Tobago (%)
Place of birth for the foreign-born population - West Indies (%)
Place of birth for the foreign-born population - Other Caribbean (%)
Place of birth for the foreign-born population - Belize (%)
Place of birth for the foreign-born population - Costa Rica (%)
Place of birth for the foreign-born population - El Salvador (%)
Place of birth for the foreign-born population - Guatemala (%)
Place of birth for the foreign-born population - Honduras (%)
Place of birth for the foreign-born population - Mexico (%)
Place of birth for the foreign-born population - Nicaragua (%)
Place of birth for the foreign-born population - Panama (%)
Place of birth for the foreign-born population - Other Central America (%)
Place of birth for the foreign-born population - Argentina (%)
Place of birth for the foreign-born population - Bolivia (%)
Place of birth for the foreign-born population - Brazil (%)
Place of birth for the foreign-born population - Chile (%)
Place of birth for the foreign-born population - Colombia (%)
Place of birth for the foreign-born population - Ecuador (%)
Place of birth for the foreign-born population - Guyana (%)
Place of birth for the foreign-born population - Peru (%)
Place of birth for the foreign-born population - Uruguay (%)
Place of birth for the foreign-born population - Venezuela (%)
Place of birth for the foreign-born population - Other South America (%)
Place of birth for the foreign-born population - Canada (%)
Place of birth for the foreign-born population - Other Northern America (%)
Place of birth for the foreign-born population - Other (%)
Latest news about races in Salem, VA collected exclusively by city-data.com from local newspapers, TV, and radio stations
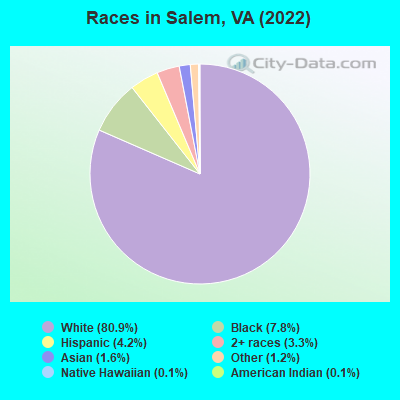
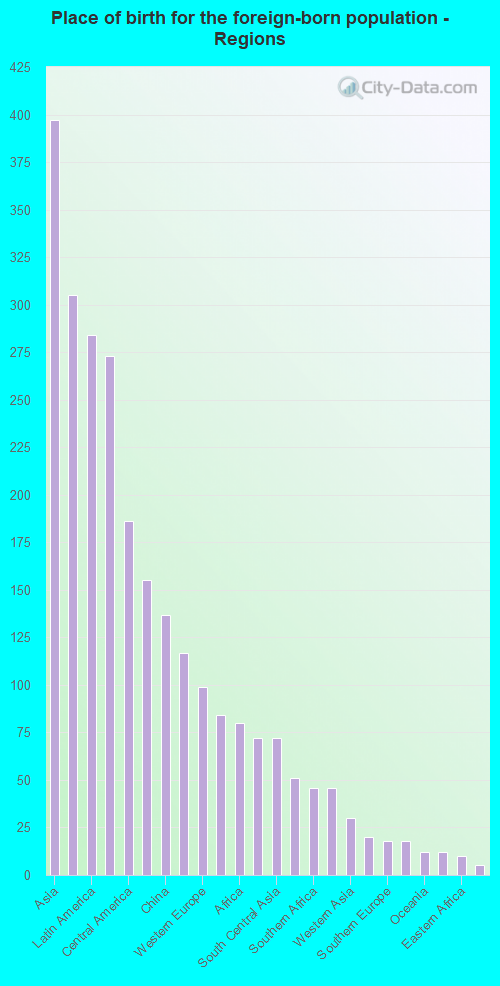
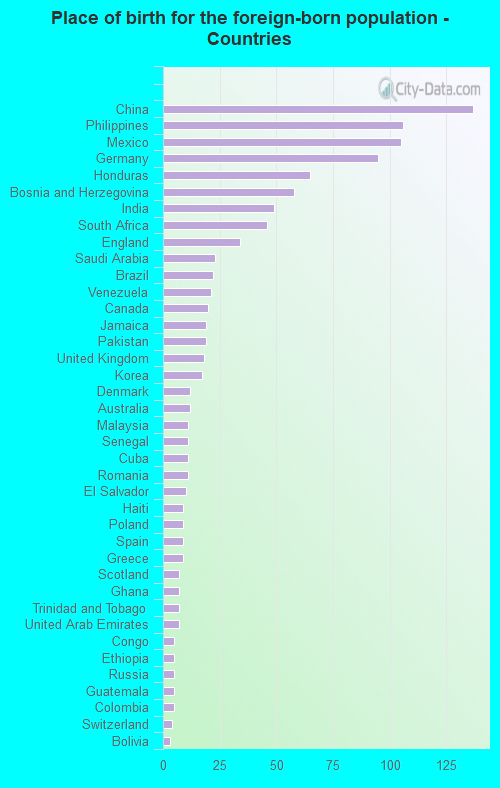
According to 2022 data, the most numerous races in Salem, VA are White alone (20,577 residents), Black alone (1,997 residents), and Hispanic (1,070 residents). 94.9% of Salem residents speak English at home. 4.2% of Salem, VA residents are foreign-born (1.5% born in Asia, 1.1% born in Latin America, 1.1% born in Europe), which is 185.9% less than the foreign-born rate of 12.0% across the entire state of Virginia.
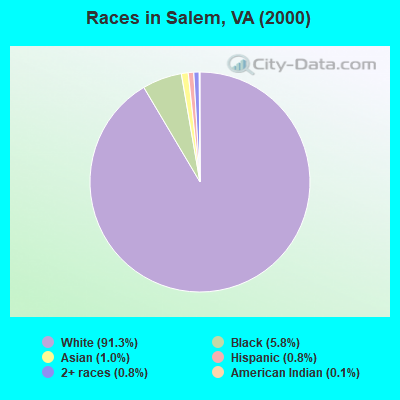
Race distribution in Salem
2000 2022
4,965,637 70.2% White alone 1,376,378 19.4% Black alone 329,540 4.7% Hispanic 259,277 3.7% Asian alone 114,022 1.6% Two or more races 18,596 0.3% American Indian alone 11,685 0.2% Other race alone 3,380 0.05% Native Hawaiian and Other
5,095,130 58.7% White alone 1,594,785 18.4% Black alone 905,750 10.4% Hispanic 602,881 6.9% Asian alone 406,047 4.7% Two or more races 60,419 0.7% Other race alone 11,738 0.1% American Indian alone 6,869 0.08% Native Hawaiian and Other
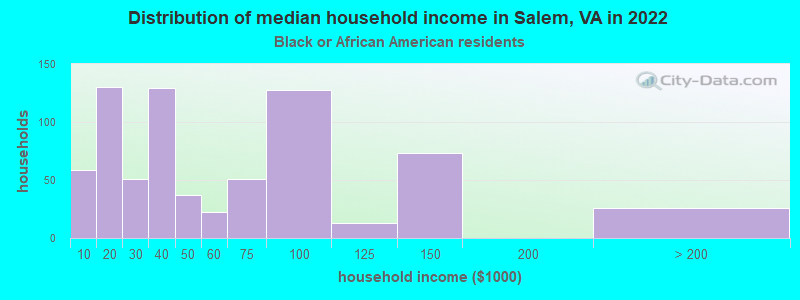
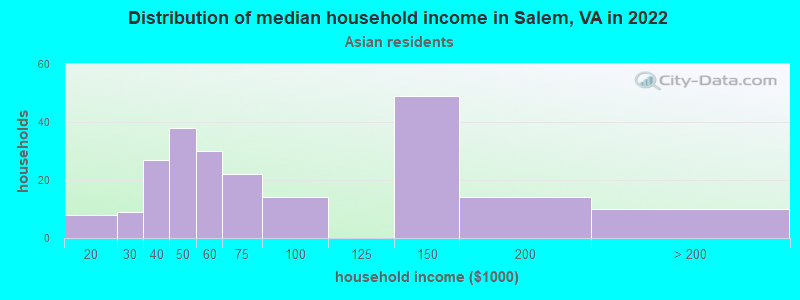
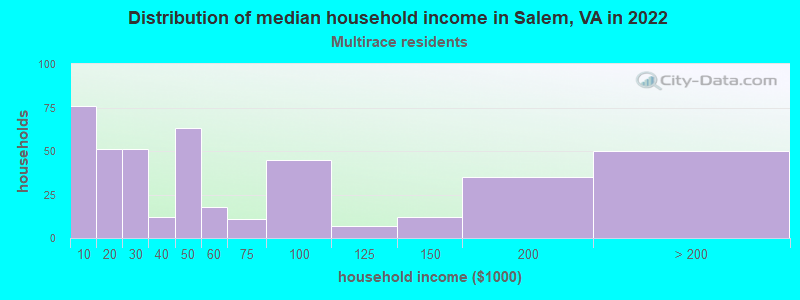
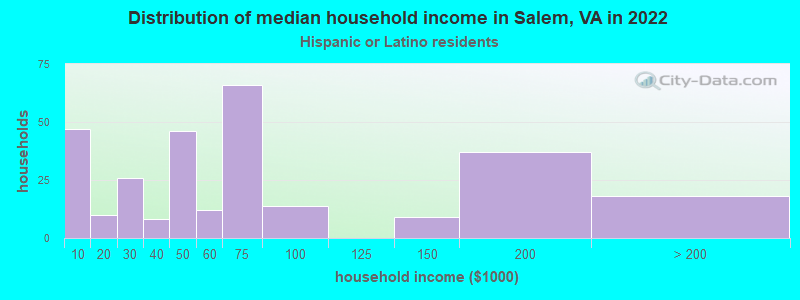
Income and house value in Salem Median household income in 2022 $65,756 White non-Hispanic householders$49,398 Black householders$58,846 Asian householders$45,955 Two or more races householders$72,357 Hispanic or Latino race householdersMedian 2022 house value $269,504 White Non-Hispanic householders$207,939 Black or African American householders $215,603 Asian householders$351,249 Some other race householders$322,638 Two or more races householders$287,386 Hispanic or Latino householders
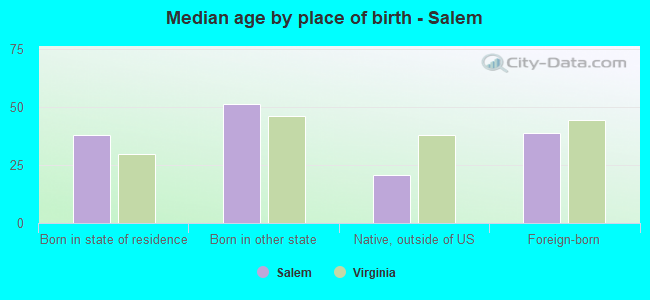
Median age by race in Salem
43.5 Median age for White residents41.1 44.9 32.8 Median age for Black or African American residents39.6 27.8 20.3 Median age for American Indian / Alaska Native residents45.9 -687,861,271.0 40.0 Median age for Asian residents31.4 38.8 49.0 Median age for Native Hawaiian / Pacific Islander residents-666,666,666.0 57.2 41.1 Median age for Other race residents47.9 37.4 27.6 Median age for Two or more races residents51.4 18.7 44.2 Median age for White alone residents41.2 45.9 24.4 Median age for Hispanic or Latino residents26.2 16.6
Owner/renter occupied households by race in Salem
House owners and renters - White residents 6,121 73.5% Owner occupied2,207 26.5% Renter occupiedHouse owners and renters - Black or African American residents 327 49.9% Owner occupied329 50.1% Renter occupiedHouse owners and renters - Asian residents 80 38.6% Owner occupied127 61.4% Renter occupiedHouse owners and renters - Other race residents 96 42.3% Owner occupied131 57.7% Renter occupiedHouse owners and renters - Two or more races residents 322 60.4% Owner occupied211 39.6% Renter occupiedHouse owners and renters - White alone residents 6,083 73.4% Owner occupied2,199 26.6% Renter occupiedHouse owners and renters - Hispanic or Latino residents 133 43.8% Owner occupied171 56.2% Renter occupied
Language usage in Salem
English speakers - Total 94.9% of residents of Salem speak English at home.
1.7% of residents speak Spanish at home 251 60.3% Speak English very well165 39.7% Speak English less than very well3.3% of residents speak other language at home 682 84.3% Speak English very well127 15.7% Speak English less than very well
English speakers - Born in the United States 97.3% of residents of Salem speak English at home.
1.4% of residents speak Spanish at home 67 66.3% Speak English very well34 33.7% Speak English less than very well1.3% of residents speak other language at home 93 100.0% Speak English very well
All residents speak only English at home
English speakers - Foreign-born 31.7% of residents of Salem speak English at home.
18.2% of residents speak Spanish at home 54 26.5% Speak English very well150 73.5% Speak English less than very well50.9% of residents speak other language at home 466 81.6% Speak English very well105 18.4% Speak English less than very well
White (Caucasian) - Speak only English Native:
99.2% (19,649)Foreign-born:
45.4% (130)
White (Caucasian) - Speak another language Native:
1.0% (192)Foreign-born:
57.3% (164)
Black or African American - Speak only English Native:
98.1% (1,868)Foreign-born:
16.9% (10)
Black or African American - Speak another language Native:
1.8% (35)Foreign-born:
84.7% (52)
Asian - Speak only English Native:
50.5% (64)Foreign-born:
31.1% (98)
Asian - Speak another language Native:
49.7% (63)Foreign-born:
70.2% (222)
Native Hawaiian / Pacific Islander - Speak only English Native:
88.0% (11)Foreign-born:
47.9% (20)
Other race - Speak only English Native:
94.8% (337)Foreign-born:
16.4% (27)
Other race - Speak another language Native:
12.4% (44)Foreign-born:
85.0% (138)
Two or more races - Speak only English Native:
91.7% (663)Foreign-born:
23.5% (58)
Two or more races - Speak another language Native:
8.2% (59)Foreign-born:
91.4% (226)
White alone - Speak only English Native:
99.7% (19,342)Foreign-born:
37.2% (132)
White alone - Speak another language Native:
0.5% (96)Foreign-born:
62.8% (223)
Hispanic or Latino - Speak only English Native:
70.8% (489)Foreign-born:
6.4% (14)
Hispanic or Latino - Speak another language Native:
31.3% (216)Foreign-born:
90.6% (202)
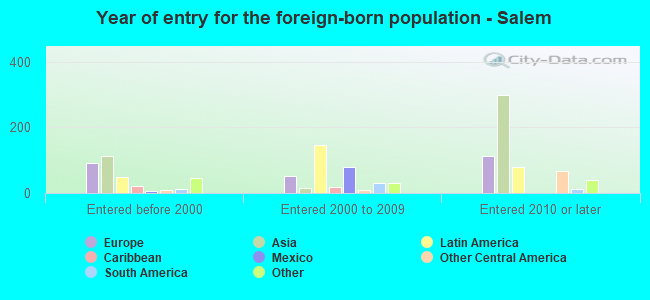
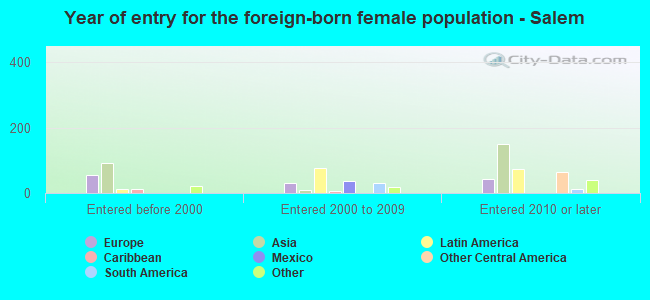
Foreign-born residents in Salem 1,068 residents are foreign born (1.5% Asia , 1.1% Latin America , 1.1% Europe ).
This city:
4.2%Virginia:
12.6%
Marital status for residents in Salem Marital status - White (Caucasian) population 15 years and over
Males 35.7% Never married50.0% Now married0.8% Separated2.8% Widowed10.6% DivorcedFemales 27.4% Never married45.6% Now married1.2% Separated10.9% Widowed15.0% DivorcedWomen who gave birth in the past 12 months Now married:
49.4% (107)Unmarried:
50.6% (110)
Women who did not give birth in the past 12 months Now married:
40.2% (1,764)Unmarried:
59.8% (2,626)
Marital status - Black or African American population 15 years and over
Males 61.4% Never married24.0% Now married2.4% Separated3.9% Widowed8.3% DivorcedFemales 58.3% Never married18.9% Now married2.7% Separated7.0% Widowed13.2% DivorcedWomen who did not give birth in the past 12 months Now married:
25.9% (116)Unmarried:
74.1% (331)
Marital status - American Indian / Alaska Native population 15 years and over
Males 36.4% Never married45.5% Now married0.0% Separated0.0% Widowed18.2% DivorcedFemales 100.0% Never married0.0% Now married0.0% Separated0.0% Widowed0.0% DivorcedWomen who did not give birth in the past 12 months Now married:
0.0% (0)Unmarried:
100.0% (15)
Marital status - Asian population 15 years and over
Males 46.5% Never married31.2% Now married0.0% Separated0.0% Widowed22.3% DivorcedFemales 40.1% Never married29.4% Now married17.9% Separated7.6% Widowed5.0% DivorcedWomen who gave birth in the past 12 months Now married:
100.0% (9)Unmarried:
0.0% (0)
Women who did not give birth in the past 12 months Now married:
45.4% (102)Unmarried:
54.6% (122)
Marital status - Other race population 15 years and over
Males 47.1% Never married52.9% Now married0.0% Separated0.0% Widowed0.0% DivorcedFemales 66.1% Never married27.8% Now married0.0% Separated0.0% Widowed6.1% DivorcedWomen who did not give birth in the past 12 months Now married:
20.2% (32)Unmarried:
79.8% (125)
Marital status - Two or more races population 15 years and over
Males 42.8% Never married46.2% Now married6.6% Separated0.0% Widowed4.5% DivorcedFemales 49.7% Never married29.8% Now married0.0% Separated14.1% Widowed6.4% DivorcedWomen who gave birth in the past 12 months Now married:
0.0% (0)Unmarried:
100.0% (14)
Women who did not give birth in the past 12 months Now married:
20.6% (49)Unmarried:
79.4% (190)
Marital status - White alone, not Hispanic / Latino population 15 years and over
Males 35.7% Never married50.0% Now married0.7% Separated2.8% Widowed10.7% DivorcedFemales 27.2% Never married45.6% Now married1.2% Separated11.0% Widowed15.0% DivorcedWomen who gave birth in the past 12 months Now married:
49.4% (108)Unmarried:
50.6% (111)
Women who did not give birth in the past 12 months Now married:
39.9% (1,739)Unmarried:
60.1% (2,621)
Marital status - Hispanic or Latino population 15 years and over
Males 52.4% Never married35.4% Now married9.6% Separated0.0% Widowed2.6% DivorcedFemales 54.2% Never married35.2% Now married0.0% Separated4.0% Widowed6.5% DivorcedWomen who did not give birth in the past 12 months Now married:
34.7% (90)Unmarried:
65.3% (170)
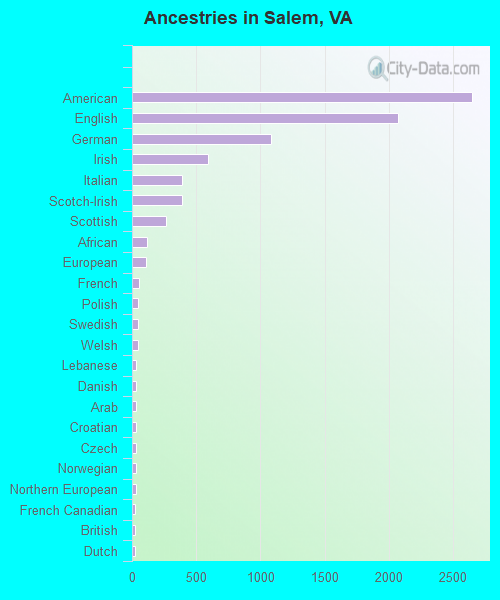
Ancestries in Salem
2,649 22.6% American2,071 17.6% English1,085 9.2% German589 5.0% Irish391 3.3% Italian387 3.3% Scotch-Irish265 2.3% Scottish120 1.0% African109 0.9% European58 0.5% French48 0.4% Polish48 0.4% Swedish43 0.4% Welsh32 0.3% Lebanese32 0.3% Danish30 0.3% Arab30 0.3% Croatian29 0.2% Czech29 0.2% Norwegian28 0.2% Northern European27 0.2% French Canadian25 0.2% British25 0.2% Dutch19 0.2% Swiss19 0.2% Ukrainian19 0.2% Haitian18 0.2% Jamaican15 0.1% Hungarian14 0.1% Lithuanian12 0.1% Romanian12 0.1% Australian10 0.09% Eastern European9 0.08% Cajun9 0.08% Austrian8 0.07% Greek6 0.05% Slovak6 0.05% Ghanaian5 0.04% Trinidadian and Tobagonian4 0.03% Russian
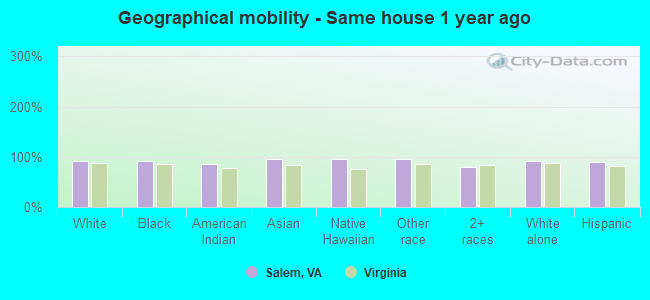
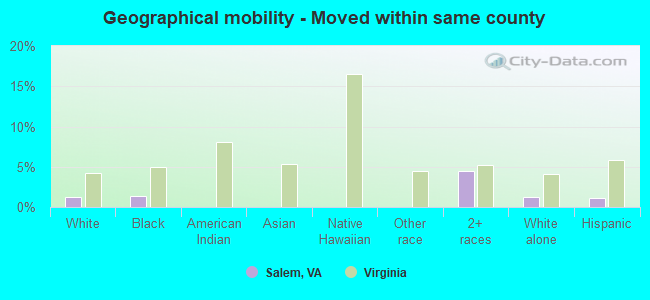
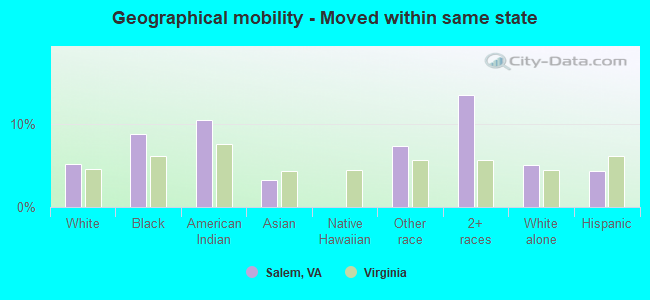
Geographical mobility in Salem Same house 1 year ago 18,897 91.1% White (Caucasian)1,806 90.7% Black or African American34 85.5% American Indian / Alaska Native446 95.7% Asian37 95.3% Native Hawaiian / Pacific Islander484 94.7% Other race872 79.3% Two or more races18,610 91.1% White alone, not Hispanic / Latino873 90.6% Hispanic or LatinoMoved within same county 249 1.2% White / Caucasian27 1.4% Black or African American49 4.5% Two or more races247 1.2% White alone, not Hispanic / Latino11 1.1% Hispanic or LatinoMoved within same state 1,080 5.2% White / Caucasian176 8.9% Black or African American4 10.5% American Indian / Alaska Native15 3.3% Asian38 7.4% Other race149 13.6% Two or more races1,044 5.1% White alone, not Hispanic / Latino42 4.4% Hispanic or LatinoMoved from different state 200 1.0% White / Caucasian5 0.2% Black or African American191 0.9% White alone, not Hispanic / Latino15 1.5% Hispanic or LatinoMoved from abroad 106 0.5% White32 2.9% Two or more races106 0.5% White alone, not Hispanic / Latino24 2.5% Hispanic or Latino
Children Nativity (place of birth) in Salem
Children under 6 years - Living with two parents Both parents native 671 100.0% NativeBoth parents foreign-born 23 100.0% NativeOne native, one foreign-born parent 77 100.0% NativeChildren under 6 years - Living with one parent Native parent 271 94.8% Native15 5.2% Foreign-bornForeign-born parent 54 84.9% Native10 15.1% Foreign-bornChildren 6 to 17 years - Living with two parents Both parents native 2,033 100.0% NativeBoth parents foreign-born 20 74.4% Native7 25.6% Foreign-bornOne native, one foreign-born parent 50 100.0% NativeChildren 6 to 17 years - Living with one parent Native parent 932 100.0% NativeForeign-born parent 64 49.9% Native64 50.1% Foreign-born
Grandparents responsible for own grandchildren in Salem
Grandparents (30 to 59 years) White / Caucasian 29 73.3% Responsible for grandchildren11 26.7% Not responsible for grandchildrenWhite alone, not Hispanic / Latino 30 71.5% Responsible for grandchildren12 28.5% Not responsible for grandchildrenGrandparents (60 years and over) White / Caucasian 97 58.9% Responsible for grandchildren67 41.1% Not responsible for grandchildrenWhite alone, not Hispanic / Latino 98 57.9% Responsible for grandchildren71 42.1% Not responsible for grandchildren