Races in Ruskin, Florida (FL) Detailed Stats
Data:
Races - White alone (%)
Races - White alone (% change since 2000)
Races - Black alone (%)
Races - Black alone (% change since 2000)
Races - American Indian alone (%)
Races - American Indian alone (% change since 2000)
Races - Asian alone (%)
Races - Asian alone (% change since 2000)
Races - Hispanic (%)
Races - Hispanic (% change since 2000)
Races - Native Hawaiian and Other Pacific Islander alone (%)
Races - Native Hawaiian and Other Pacific Islander alone (% change since 2000)
Races - Two or more races(%)
Races - Two or more races(% change since 2000)
Races - Other race alone (%)
Races - Other race alone (% change since 2000)
Racial diversity
Place of birth - Born in state of residence (%)
Place of birth - Born in state of residence (%) - White
Place of birth - Born in state of residence (%) - Black or African American
Place of birth - Born in state of residence (%) - Asian
Place of birth - Born in state of residence (%) - Hispanic or Latino
Place of birth - Born in state of residence (%) - American Indian and Alaska Native
Place of birth - Born in state of residence (%) - Multirace
Place of birth - Born in state of residence (%) - Other Race
Place of birth - Born in other state (%)
Place of birth - Born in other state (%) - White
Place of birth - Born in other state (%) - Black or African American
Place of birth - Born in other state (%) - Asian
Place of birth - Born in other state (%) - Hispanic or Latino
Place of birth - Born in other state (%) - American Indian and Alaska Native
Place of birth - Born in other state (%) - Multirace
Place of birth - Born in other state (%) - Other Race
Place of birth - Native, outside of US (%)
Place of birth - Native, outside of US (%) - White
Place of birth - Native, outside of US (%) - Black or African American
Place of birth - Native, outside of US (%) - Asian
Place of birth - Native, outside of US (%) - Hispanic or Latino
Place of birth - Native, outside of US (%) - American Indian and Alaska Native
Place of birth - Native, outside of US (%) - Multirace
Place of birth - Native, outside of US (%) - Other Race
Place of birth - Foreign born (%)
Place of birth - Foreign born (%) - White
Place of birth - Foreign born (%) - Black or African American
Place of birth - Foreign born (%) - Asian
Place of birth - Foreign born (%) - Hispanic or Latino
Place of birth - Foreign born (%) - American Indian and Alaska Native
Place of birth - Foreign born (%) - Multirace
Place of birth - Foreign born (%) - Other Race
Residents speaking English at home (%)
Residents speaking English at home - Born in the United States (%)
Residents speaking English at home - Native, born elsewhere (%)
Residents speaking English at home - Foreign born (%)
Residents speaking Spanish at home (%)
Residents speaking Spanish at home - Born in the United States (%)
Residents speaking Spanish at home - Native, born elsewhere (%)
Residents speaking Spanish at home - Foreign born (%)
Residents speaking other language at home (%)
Residents speaking other language at home - Born in the United States (%)
Residents speaking other language at home - Native, born elsewhere (%)
Residents speaking other language at home - Foreign born (%)
Marital status - Never married (%)
Marital status - Now married (%)
Marital status - Separated (%)
Marital status - Widowed (%)
Marital status - Divorced (%)
Ancestries Reported - Arab (%)
Ancestries Reported - Czech (%)
Ancestries Reported - Danish (%)
Ancestries Reported - Dutch (%)
Ancestries Reported - English (%)
Ancestries Reported - French (%)
Ancestries Reported - French Canadian (%)
Ancestries Reported - German (%)
Ancestries Reported - Greek (%)
Ancestries Reported - Hungarian (%)
Ancestries Reported - Irish (%)
Ancestries Reported - Italian (%)
Ancestries Reported - Lithuanian (%)
Ancestries Reported - Norwegian (%)
Ancestries Reported - Polish (%)
Ancestries Reported - Portuguese (%)
Ancestries Reported - Russian (%)
Ancestries Reported - Scotch-Irish (%)
Ancestries Reported - Scottish (%)
Ancestries Reported - Slovak (%)
Ancestries Reported - Subsaharan African (%)
Ancestries Reported - Swedish (%)
Ancestries Reported - Swiss (%)
Ancestries Reported - Ukrainian (%)
Ancestries Reported - United States (%)
Ancestries Reported - Welsh (%)
Ancestries Reported - West Indian (%)
Ancestries Reported - Other (%)
Geographical mobility - Same house 1 year ago (%)
Geographical mobility - Same house 1 year ago (%) - White
Geographical mobility - Same house 1 year ago (%) - Black or African American
Geographical mobility - Same house 1 year ago (%) - Asian
Geographical mobility - Same house 1 year ago (%) - Hispanic or Latino
Geographical mobility - Same house 1 year ago (%) - American Indian and Alaska Native
Geographical mobility - Same house 1 year ago (%) - Multirace
Geographical mobility - Same house 1 year ago (%) - Other Race
Geographical mobility - Moved within same county (%)
Geographical mobility - Moved within same county (%) - White
Geographical mobility - Moved within same county (%) - Black or African American
Geographical mobility - Moved within same county (%) - Asian
Geographical mobility - Moved within same county (%) - Hispanic or Latino
Geographical mobility - Moved within same county (%) - American Indian and Alaska Native
Geographical mobility - Moved within same county (%) - Multirace
Geographical mobility - Moved within same county (%) - Other Race
Geographical mobility - Moved from different county within same state (%)
Geographical mobility - Moved from different county within same state (%) - White
Geographical mobility - Moved from different county within same state (%) - Black or African American
Geographical mobility - Moved from different county within same state (%) - Asian
Geographical mobility - Moved from different county within same state (%) - Hispanic or Latino
Geographical mobility - Moved from different county within same state (%) - American Indian and Alaska Native
Geographical mobility - Moved from different county within same state (%) - Multirace
Geographical mobility - Moved from different county within same state (%) - Other Race
Geographical mobility - Moved from different state (%)
Geographical mobility - Moved from different state (%) - White
Geographical mobility - Moved from different state (%) - Black or African American
Geographical mobility - Moved from different state (%) - Asian
Geographical mobility - Moved from different state (%) - Hispanic or Latino
Geographical mobility - Moved from different state (%) - American Indian and Alaska Native
Geographical mobility - Moved from different state (%) - Multirace
Geographical mobility - Moved from different state (%) - Other Race
Geographical mobility - Moved from abroad (%)
Geographical mobility - Moved from abroad (%) - White
Geographical mobility - Moved from abroad (%) - Black or African American
Geographical mobility - Moved from abroad (%) - Asian
Geographical mobility - Moved from abroad (%) - Hispanic or Latino
Geographical mobility - Moved from abroad (%) - American Indian and Alaska Native
Geographical mobility - Moved from abroad (%) - Multirace
Geographical mobility - Moved from abroad (%) - Other Race
Place of birth for the foreign-born population - Ireland (%)
Place of birth for the foreign-born population - Denmark (%)
Place of birth for the foreign-born population - Norway (%)
Place of birth for the foreign-born population - Sweden (%)
Place of birth for the foreign-born population - United Kingdom (%)
Place of birth for the foreign-born population - England (%)
Place of birth for the foreign-born population - Scotland (%)
Place of birth for the foreign-born population - Other Northern Europe (%)
Place of birth for the foreign-born population - Austria (%)
Place of birth for the foreign-born population - Belgium (%)
Place of birth for the foreign-born population - France (%)
Place of birth for the foreign-born population - Germany (%)
Place of birth for the foreign-born population - Netherlands (%)
Place of birth for the foreign-born population - Switzerland (%)
Place of birth for the foreign-born population - Other Western Europe (%)
Place of birth for the foreign-born population - Greece (%)
Place of birth for the foreign-born population - Italy (%)
Place of birth for the foreign-born population - Portugal (%)
Place of birth for the foreign-born population - Spain (%)
Place of birth for the foreign-born population - Other Southern Europe (%)
Place of birth for the foreign-born population - Albania (%)
Place of birth for the foreign-born population - Belarus (%)
Place of birth for the foreign-born population - Bosnia and Herzegovina (%)
Place of birth for the foreign-born population - Bulgaria (%)
Place of birth for the foreign-born population - Croatia (%)
Place of birth for the foreign-born population - Czechoslovakia (%)
Place of birth for the foreign-born population - Hungary (%)
Place of birth for the foreign-born population - Latvia (%)
Place of birth for the foreign-born population - Lithuania (%)
Place of birth for the foreign-born population - North Macedonia (Macedonia) (%)
Place of birth for the foreign-born population - Moldova (%)
Place of birth for the foreign-born population - Poland (%)
Place of birth for the foreign-born population - Romania (%)
Place of birth for the foreign-born population - Russia (%)
Place of birth for the foreign-born population - Serbia (%)
Place of birth for the foreign-born population - Ukraine (%)
Place of birth for the foreign-born population - Other Eastern Europe (%)
Place of birth for the foreign-born population - China (%)
Place of birth for the foreign-born population - Hong Kong (%)
Place of birth for the foreign-born population - Taiwan (%)
Place of birth for the foreign-born population - Japan (%)
Place of birth for the foreign-born population - Korea (%)
Place of birth for the foreign-born population - Other Eastern Asia (%)
Place of birth for the foreign-born population - Afghanistan (%)
Place of birth for the foreign-born population - Bangladesh (%)
Place of birth for the foreign-born population - India (%)
Place of birth for the foreign-born population - Iran (%)
Place of birth for the foreign-born population - Kazakhstan (%)
Place of birth for the foreign-born population - Nepal (%)
Place of birth for the foreign-born population - Pakistan (%)
Place of birth for the foreign-born population - Sri Lanka (%)
Place of birth for the foreign-born population - Uzbekistan (%)
Place of birth for the foreign-born population - Other South Central Asia (%)
Place of birth for the foreign-born population - Burma (%)
Place of birth for the foreign-born population - Cambodia (%)
Place of birth for the foreign-born population - Indonesia (%)
Place of birth for the foreign-born population - Laos (%)
Place of birth for the foreign-born population - Malaysia (%)
Place of birth for the foreign-born population - Philippines (%)
Place of birth for the foreign-born population - Singapore (%)
Place of birth for the foreign-born population - Thailand (%)
Place of birth for the foreign-born population - Vietnam (%)
Place of birth for the foreign-born population - Other South Eastern Asia (%)
Place of birth for the foreign-born population - Armenia (%)
Place of birth for the foreign-born population - Iraq (%)
Place of birth for the foreign-born population - Israel (%)
Place of birth for the foreign-born population - Jordan (%)
Place of birth for the foreign-born population - Kuwait (%)
Place of birth for the foreign-born population - Lebanon (%)
Place of birth for the foreign-born population - Saudi Arabia (%)
Place of birth for the foreign-born population - Syria (%)
Place of birth for the foreign-born population - Turkey (%)
Place of birth for the foreign-born population - Yemen (%)
Place of birth for the foreign-born population - Other Western Asia (%)
Place of birth for the foreign-born population - Eritrea (%)
Place of birth for the foreign-born population - Ethiopia (%)
Place of birth for the foreign-born population - Kenya (%)
Place of birth for the foreign-born population - Somalia (%)
Place of birth for the foreign-born population - Uganda (%)
Place of birth for the foreign-born population - Zimbabwe (%)
Place of birth for the foreign-born population - Other Eastern Africa (%)
Place of birth for the foreign-born population - Cameroon (%)
Place of birth for the foreign-born population - Congo (%)
Place of birth for the foreign-born population - Democratic Republic of Congo (Zaire) (%)
Place of birth for the foreign-born population - Other Middle Africa (%)
Place of birth for the foreign-born population - Egypt (%)
Place of birth for the foreign-born population - Morocco (%)
Place of birth for the foreign-born population - Sudan (%)
Place of birth for the foreign-born population - Other Northern Africa (%)
Place of birth for the foreign-born population - South Africa (%)
Place of birth for the foreign-born population - Other Southern Africa (%)
Place of birth for the foreign-born population - Cabo Verde (%)
Place of birth for the foreign-born population - Ghana (%)
Place of birth for the foreign-born population - Liberia (%)
Place of birth for the foreign-born population - Nigeria (%)
Place of birth for the foreign-born population - Senegal (%)
Place of birth for the foreign-born population - Sierra Leone (%)
Place of birth for the foreign-born population - Other Western Africa (%)
Place of birth for the foreign-born population - Australia (%)
Place of birth for the foreign-born population - New Zealand (%)
Place of birth for the foreign-born population - Fiji (%)
Place of birth for the foreign-born population - Micronesia (%)
Place of birth for the foreign-born population - Bahamas (%)
Place of birth for the foreign-born population - Barbados (%)
Place of birth for the foreign-born population - Cuba (%)
Place of birth for the foreign-born population - Dominica (%)
Place of birth for the foreign-born population - Dominican Republic (%)
Place of birth for the foreign-born population - Grenada (%)
Place of birth for the foreign-born population - Haiti (%)
Place of birth for the foreign-born population - Jamaica (%)
Place of birth for the foreign-born population - St. Vincent and the Grenadines (%)
Place of birth for the foreign-born population - Trinidad and Tobago (%)
Place of birth for the foreign-born population - West Indies (%)
Place of birth for the foreign-born population - Other Caribbean (%)
Place of birth for the foreign-born population - Belize (%)
Place of birth for the foreign-born population - Costa Rica (%)
Place of birth for the foreign-born population - El Salvador (%)
Place of birth for the foreign-born population - Guatemala (%)
Place of birth for the foreign-born population - Honduras (%)
Place of birth for the foreign-born population - Mexico (%)
Place of birth for the foreign-born population - Nicaragua (%)
Place of birth for the foreign-born population - Panama (%)
Place of birth for the foreign-born population - Other Central America (%)
Place of birth for the foreign-born population - Argentina (%)
Place of birth for the foreign-born population - Bolivia (%)
Place of birth for the foreign-born population - Brazil (%)
Place of birth for the foreign-born population - Chile (%)
Place of birth for the foreign-born population - Colombia (%)
Place of birth for the foreign-born population - Ecuador (%)
Place of birth for the foreign-born population - Guyana (%)
Place of birth for the foreign-born population - Peru (%)
Place of birth for the foreign-born population - Uruguay (%)
Place of birth for the foreign-born population - Venezuela (%)
Place of birth for the foreign-born population - Other South America (%)
Place of birth for the foreign-born population - Canada (%)
Place of birth for the foreign-born population - Other Northern America (%)
Place of birth for the foreign-born population - Other (%)
Latest news about races in Ruskin, FL collected exclusively by city-data.com from local newspapers, TV, and radio stations
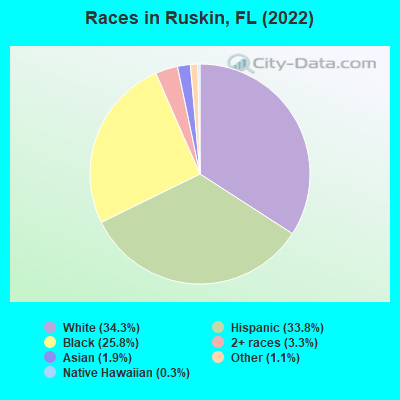
According to 2022 data, the most numerous races in Ruskin, FL are White alone (10,196 residents), Hispanic (10,071 residents), and Black alone (7,671 residents). 69.0% of Ruskin residents speak English at home. 14.1% of Ruskin, FL residents are foreign-born (12.0% born in Latin America), which is 49.2% less than the foreign-born rate of 21.0% across the entire state of Florida.
Race distribution in Ruskin
2000 2022
10,458,509 65.4% White alone 2,682,715 16.8% Hispanic 2,264,268 14.2% Black alone 261,693 1.6% Asian alone 236,954 1.5% Two or more races 42,358 0.3% American Indian alone 28,994 0.2% Other race alone 6,887 0.04% Native Hawaiian and Other
11,309,403 50.8% White alone 6,025,039 27.1% Hispanic 3,241,015 14.6% Black alone 861,630 3.9% Two or more races 623,692 2.8% Asian alone 152,054 0.7% Other race alone 22,504 0.1% American Indian alone 9,486 0.04% Native Hawaiian and Other
Income and house value in Ruskin Median household income in 2022 $82,628 White non-Hispanic householders$84,746 Black householders$3,738 American Indian and Alaska Native householders$64,907 Some other race householders$96,915 Two or more races householders$61,620 Hispanic or Latino race householdersMedian 2022 house value $370,425 White Non-Hispanic householders$366,971 Black or African American householders$323,798 American Indian or Alaska Native householders $256,448 Asian householders$245,223 Some other race householders$363,517 Two or more races householders$284,942 Hispanic or Latino householders
Median age by race in Ruskin
40.1 Median age for White residents39.0 40.9 29.8 Median age for Black or African American residents31.7 28.7 54.0 Median age for American Indian / Alaska Native residents-676,245,210.1 -655,399,060.4 41.6 Median age for Asian residents57.7 27.0 -848,484,847.6 Median age for Native Hawaiian / Pacific Islander residents-776,729,559.0 -490,118,576.6 29.2 Median age for Other race residents33.7 24.6 19.4 Median age for Two or more races residents19.3 19.1 43.4 Median age for White alone residents43.7 43.3 27.3 Median age for Hispanic or Latino residents26.7 28.0
Owner/renter occupied households by race in Ruskin
House owners and renters - White residents 3,755 77.8% Owner occupied1,070 22.2% Renter occupiedHouse owners and renters - Black or African American residents 1,488 76.1% Owner occupied467 23.9% Renter occupiedHouse owners and renters - American Indian / Alaska Native residents 57 77.0% Owner occupied17 23.0% Renter occupiedHouse owners and renters - Asian residents 102 34.1% Owner occupied197 65.9% Renter occupiedHouse owners and renters - Other race residents 665 53.4% Owner occupied580 46.6% Renter occupiedHouse owners and renters - Two or more races residents 833 85.4% Owner occupied142 14.6% Renter occupiedHouse owners and renters - White alone residents 3,167 75.4% Owner occupied1,035 24.6% Renter occupiedHouse owners and renters - Hispanic or Latino residents 1,863 65.7% Owner occupied971 34.3% Renter occupied
Language usage in Ruskin
English speakers - Total 69.0% of residents of Ruskin speak English at home.
23.8% of residents speak Spanish at home 4,496 68.0% Speak English very well2,111 32.0% Speak English less than very well6.7% of residents speak other language at home 752 40.8% Speak English very well1,092 59.2% Speak English less than very well
English speakers - Born in the United States 89.6% of residents of Ruskin speak English at home.
9.4% of residents speak Spanish at home 815 84.3% Speak English very well152 15.7% Speak English less than very well1.2% of residents speak other language at home 78 65.5% Speak English very well41 34.5% Speak English less than very well
English speakers - Native, born elsewhere 36.7% of residents of Ruskin speak English at home.
47.2% of residents speak Spanish at home 384 57.4% Speak English very well285 42.6% Speak English less than very well15.3% of residents speak other language at home 35 16.2% Speak English very well181 83.8% Speak English less than very well
English speakers - Foreign-born 15.7% of residents of Ruskin speak English at home.
54.6% of residents speak Spanish at home 890 37.4% Speak English very well1,492 62.6% Speak English less than very well29.9% of residents speak other language at home 602 46.1% Speak English very well703 53.9% Speak English less than very well
White (Caucasian) - Speak only English Native:
85.8% (9,951)Foreign-born:
38.0% (223)
White (Caucasian) - Speak another language Native:
9.9% (1,144)Foreign-born:
66.4% (390)
Black or African American - Speak only English Native:
98.1% (5,922)Foreign-born:
24.2% (239)
Black or African American - Speak another language Native:
2.0% (123)Foreign-born:
76.1% (753)
Asian - Speak only English Native:
20.3% (91)Foreign-born:
9.0% (36)
Asian - Speak another language Native:
85.5% (385)Foreign-born:
90.9% (362)
Other race - Speak only English Native:
20.5% (510)Foreign-born:
5.3% (89)
Other race - Speak another language Native:
78.6% (1,953)Foreign-born:
94.8% (1,573)
Two or more races - Speak only English Native:
73.0% (1,983)Foreign-born:
14.0% (84)
Two or more races - Speak another language Native:
25.2% (683)Foreign-born:
83.3% (502)
White alone - Speak only English Native:
99.1% (9,470)Foreign-born:
56.9% (150)
White alone - Speak another language Native:
1.1% (106)Foreign-born:
44.9% (119)
Hispanic or Latino - Speak only English Native:
30.9% (2,002)Foreign-born:
5.3% (139)
Hispanic or Latino - Speak another language Native:
66.8% (4,333)Foreign-born:
94.6% (2,463)
Foreign-born residents in Ruskin 4,189 residents are foreign born (12.0% Latin America ).
This city:
14.1%Florida:
21.1%
Marital status for residents in Ruskin Marital status - White (Caucasian) population 15 years and over
Males 35.1% Never married47.8% Now married1.6% Separated6.2% Widowed9.4% DivorcedFemales 26.0% Never married46.5% Now married3.5% Separated9.3% Widowed14.8% DivorcedWomen who gave birth in the past 12 months Now married:
29.2% (66)Unmarried:
70.8% (159)
Women who did not give birth in the past 12 months Now married:
46.3% (1,232)Unmarried:
53.7% (1,430)
Marital status - Black or African American population 15 years and over
Males 34.8% Never married56.4% Now married0.4% Separated1.7% Widowed6.7% DivorcedFemales 45.8% Never married40.7% Now married0.5% Separated3.9% Widowed9.1% DivorcedWomen who gave birth in the past 12 months Now married:
24.7% (40)Unmarried:
75.3% (122)
Women who did not give birth in the past 12 months Now married:
42.9% (772)Unmarried:
57.1% (1,029)
Marital status - American Indian / Alaska Native population 15 years and over
Males 0.0% Never married0.0% Now married0.0% Separated0.0% Widowed100.0% DivorcedFemales 0.0% Never married0.0% Now married100.0% Separated0.0% Widowed0.0% DivorcedWomen who did not give birth in the past 12 months Now married:
100.0% (20)Unmarried:
0.0% (0)
Marital status - Asian population 15 years and over
Males 20.9% Never married79.1% Now married0.0% Separated0.0% Widowed0.0% DivorcedFemales 53.8% Never married46.2% Now married0.0% Separated0.0% Widowed0.0% DivorcedWomen who did not give birth in the past 12 months Now married:
35.6% (89)Unmarried:
64.4% (160)
Marital status - Other race population 15 years and over
Males 44.3% Never married41.8% Now married4.8% Separated2.1% Widowed7.0% DivorcedFemales 34.1% Never married49.5% Now married6.8% Separated4.6% Widowed5.0% DivorcedWomen who gave birth in the past 12 months Now married:
100.0% (89)Unmarried:
0.0% (0)
Women who did not give birth in the past 12 months Now married:
53.9% (688)Unmarried:
46.1% (587)
Marital status - Two or more races population 15 years and over
Males 44.2% Never married40.6% Now married6.3% Separated0.0% Widowed8.8% DivorcedFemales 46.6% Never married36.7% Now married1.2% Separated4.3% Widowed11.3% DivorcedWomen who gave birth in the past 12 months Now married:
35.7% (31)Unmarried:
64.3% (55)
Women who did not give birth in the past 12 months Now married:
28.8% (283)Unmarried:
71.2% (701)
Marital status - White alone, not Hispanic / Latino population 15 years and over
Males 31.2% Never married49.0% Now married2.1% Separated6.9% Widowed10.9% DivorcedFemales 22.4% Never married47.6% Now married2.7% Separated11.1% Widowed16.2% DivorcedWomen who gave birth in the past 12 months Now married:
35.1% (68)Unmarried:
64.9% (127)
Women who did not give birth in the past 12 months Now married:
43.1% (898)Unmarried:
56.9% (1,183)
Marital status - Hispanic or Latino population 15 years and over
Males 41.6% Never married46.2% Now married2.7% Separated2.6% Widowed6.9% DivorcedFemales 40.6% Never married39.9% Now married6.1% Separated4.7% Widowed8.7% DivorcedWomen who gave birth in the past 12 months Now married:
43.3% (77)Unmarried:
56.7% (101)
Women who did not give birth in the past 12 months Now married:
43.5% (1,068)Unmarried:
56.5% (1,385)
Ancestries in Ruskin
1,179 6.3% American623 3.3% Haitian469 2.5% Jamaican440 2.4% German357 1.9% English311 1.7% Irish226 1.2% Italian173 0.9% European110 0.6% Greek96 0.5% Belizean83 0.4% Polish74 0.4% French Canadian67 0.4% Portuguese57 0.3% Czechoslovakian55 0.3% Canadian47 0.3% Scottish37 0.2% Lebanese35 0.2% French35 0.2% Scotch-Irish34 0.2% Trinidadian and Tobagonian33 0.2% Ukrainian32 0.2% Danish26 0.1% Swedish22 0.1% Norwegian21 0.1% Dutch19 0.1% West Indian18 0.10% British18 0.10% Bahamian16 0.09% Australian14 0.07% Guyanese13 0.07% British West Indian12 0.06% Czech9 0.05% Brazilian8 0.04% Eastern European8 0.04% African6 0.03% Lithuanian6 0.03% Welsh5 0.03% Northern European3 0.02% Slovak
Geographical mobility in Ruskin Same house 1 year ago 10,806 86.8% White (Caucasian)7,314 97.0% Black or African American54 100.0% American Indian / Alaska Native868 100.0% Asian85 100.0% Native Hawaiian / Pacific Islander4,284 97.7% Other race3,642 90.4% Two or more races8,667 85.3% White alone, not Hispanic / Latino9,152 92.4% Hispanic or LatinoMoved within same county 1,074 8.6% White / Caucasian162 2.1% Black or African American20 2.3% Asian62 1.4% Other race243 6.0% Two or more races911 9.0% White alone, not Hispanic / Latino503 5.1% Hispanic or LatinoMoved within same state 86 0.7% White / Caucasian51 0.7% Black or African American33 0.7% Other race60 0.6% White alone, not Hispanic / Latino78 0.8% Hispanic or LatinoMoved from different state 436 3.5% White / Caucasian246 3.3% Black or African American20 0.5% Other race74 1.8% Two or more races467 4.6% White alone, not Hispanic / Latino87 0.9% Hispanic or LatinoMoved from abroad 12 0.2% Black or African American25 0.6% Other race58 1.4% Two or more races57 0.6% Hispanic or Latino
Children Nativity (place of birth) in Ruskin
Children under 6 years - Living with two parents Both parents native 1,304 100.0% NativeBoth parents foreign-born 97 100.0% NativeOne native, one foreign-born parent 45 100.0% NativeChildren under 6 years - Living with one parent Native parent 744 100.0% NativeForeign-born parent 264 100.0% NativeChildren 6 to 17 years - Living with two parents Both parents native 1,370 99.7% Native4 0.3% Foreign-bornBoth parents foreign-born 673 89.4% Native80 10.6% Foreign-bornOne native, one foreign-born parent 287 100.0% NativeChildren 6 to 17 years - Living with one parent Native parent 2,566 100.0% NativeForeign-born parent 422 54.7% Native349 45.3% Foreign-born
Grandparents responsible for own grandchildren in Ruskin
Grandparents (30 to 59 years) White / Caucasian 17 11.6% Responsible for grandchildren129 88.4% Not responsible for grandchildrenBlack or African American 6 100.0% Not responsible for grandchildrenTwo or more races 46 100.0% Not responsible for grandchildrenWhite alone, not Hispanic / Latino 20 20.6% Responsible for grandchildren79 79.4% Not responsible for grandchildrenHispanic or Latino 58 100.0% Not responsible for grandchildrenGrandparents (60 years and over) White / Caucasian 247 54.9% Responsible for grandchildren203 45.1% Not responsible for grandchildrenBlack or African American 193 100.0% Not responsible for grandchildrenTwo or more races 1 1.2% Responsible for grandchildren64 98.8% Not responsible for grandchildrenWhite alone, not Hispanic / Latino 231 62.6% Responsible for grandchildren138 37.4% Not responsible for grandchildrenHispanic or Latino 147 46.9% Responsible for grandchildren166 53.1% Not responsible for grandchildren