Races in Rochester, New York (NY) Detailed Stats
Data:
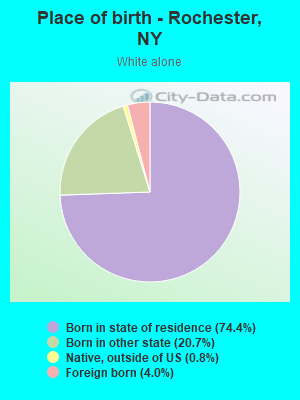
Races - White alone (%)
Races - White alone (% change since 2000)
Races - Black alone (%)
Races - Black alone (% change since 2000)
Races - American Indian alone (%)
Races - American Indian alone (% change since 2000)
Races - Asian alone (%)
Races - Asian alone (% change since 2000)
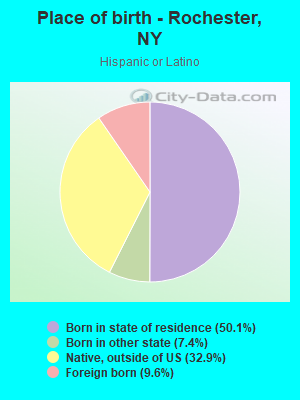
Races - Hispanic (%)
Races - Hispanic (% change since 2000)
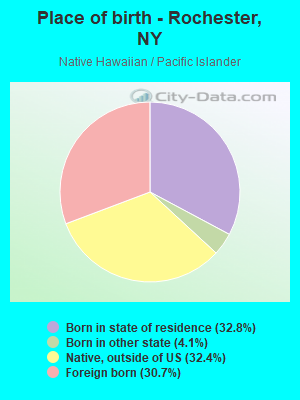
Races - Native Hawaiian and Other Pacific Islander alone (%)
Races - Native Hawaiian and Other Pacific Islander alone (% change since 2000)
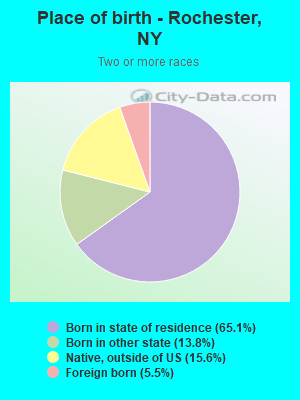
Races - Two or more races(%)
Races - Two or more races(% change since 2000)
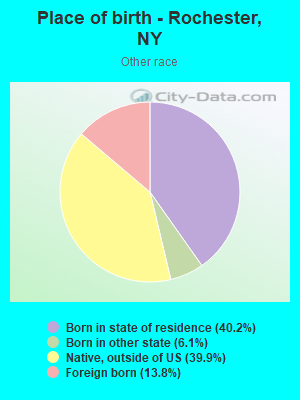
Races - Other race alone (%)
Races - Other race alone (% change since 2000)
Racial diversity
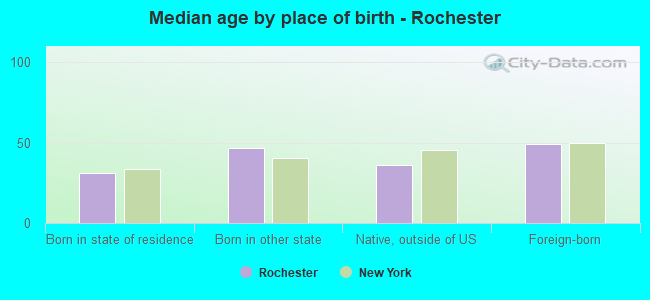
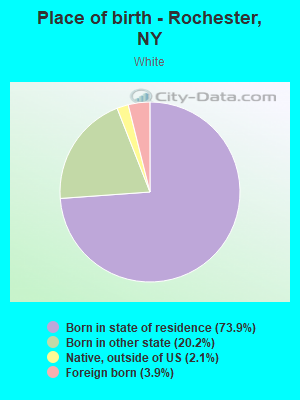
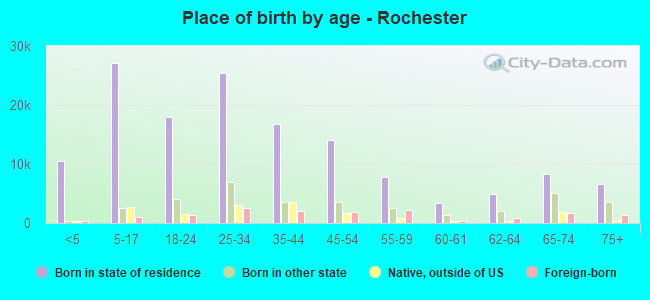
Place of birth - Born in state of residence (%)
Place of birth - Born in state of residence (%) - White
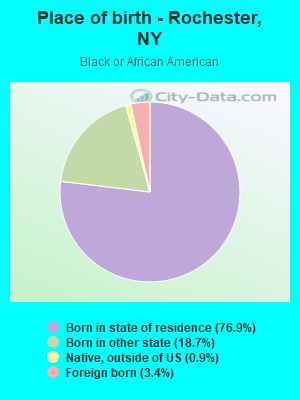
Place of birth - Born in state of residence (%) - Black or African American
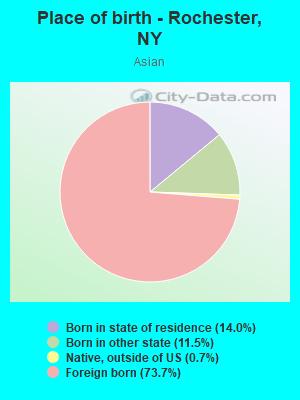
Place of birth - Born in state of residence (%) - Asian
Place of birth - Born in state of residence (%) - Hispanic or Latino
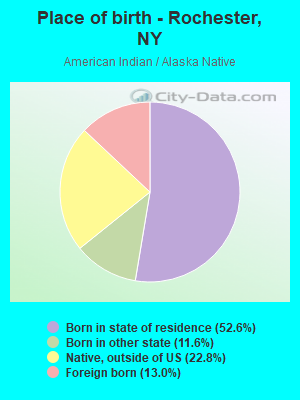
Place of birth - Born in state of residence (%) - American Indian and Alaska Native
Place of birth - Born in state of residence (%) - Multirace
Place of birth - Born in state of residence (%) - Other Race
Place of birth - Born in other state (%)
Place of birth - Born in other state (%) - White
Place of birth - Born in other state (%) - Black or African American
Place of birth - Born in other state (%) - Asian
Place of birth - Born in other state (%) - Hispanic or Latino
Place of birth - Born in other state (%) - American Indian and Alaska Native
Place of birth - Born in other state (%) - Multirace
Place of birth - Born in other state (%) - Other Race
Place of birth - Native, outside of US (%)
Place of birth - Native, outside of US (%) - White
Place of birth - Native, outside of US (%) - Black or African American
Place of birth - Native, outside of US (%) - Asian
Place of birth - Native, outside of US (%) - Hispanic or Latino
Place of birth - Native, outside of US (%) - American Indian and Alaska Native
Place of birth - Native, outside of US (%) - Multirace
Place of birth - Native, outside of US (%) - Other Race
Place of birth - Foreign born (%)
Place of birth - Foreign born (%) - White
Place of birth - Foreign born (%) - Black or African American
Place of birth - Foreign born (%) - Asian
Place of birth - Foreign born (%) - Hispanic or Latino
Place of birth - Foreign born (%) - American Indian and Alaska Native
Place of birth - Foreign born (%) - Multirace
Place of birth - Foreign born (%) - Other Race
Residents speaking English at home (%)
Residents speaking English at home - Born in the United States (%)
Residents speaking English at home - Native, born elsewhere (%)
Residents speaking English at home - Foreign born (%)
Residents speaking Spanish at home (%)
Residents speaking Spanish at home - Born in the United States (%)
Residents speaking Spanish at home - Native, born elsewhere (%)
Residents speaking Spanish at home - Foreign born (%)
Residents speaking other language at home (%)
Residents speaking other language at home - Born in the United States (%)
Residents speaking other language at home - Native, born elsewhere (%)
Residents speaking other language at home - Foreign born (%)
Marital status - Never married (%)
Marital status - Now married (%)
Marital status - Separated (%)
Marital status - Widowed (%)
Marital status - Divorced (%)
Ancestries Reported - Arab (%)
Ancestries Reported - Czech (%)
Ancestries Reported - Danish (%)
Ancestries Reported - Dutch (%)
Ancestries Reported - English (%)
Ancestries Reported - French (%)
Ancestries Reported - French Canadian (%)
Ancestries Reported - German (%)
Ancestries Reported - Greek (%)
Ancestries Reported - Hungarian (%)
Ancestries Reported - Irish (%)
Ancestries Reported - Italian (%)
Ancestries Reported - Lithuanian (%)
Ancestries Reported - Norwegian (%)
Ancestries Reported - Polish (%)
Ancestries Reported - Portuguese (%)
Ancestries Reported - Russian (%)
Ancestries Reported - Scotch-Irish (%)
Ancestries Reported - Scottish (%)
Ancestries Reported - Slovak (%)
Ancestries Reported - Subsaharan African (%)
Ancestries Reported - Swedish (%)
Ancestries Reported - Swiss (%)
Ancestries Reported - Ukrainian (%)
Ancestries Reported - United States (%)
Ancestries Reported - Welsh (%)
Ancestries Reported - West Indian (%)
Ancestries Reported - Other (%)
Geographical mobility - Same house 1 year ago (%)
Geographical mobility - Same house 1 year ago (%) - White
Geographical mobility - Same house 1 year ago (%) - Black or African American
Geographical mobility - Same house 1 year ago (%) - Asian
Geographical mobility - Same house 1 year ago (%) - Hispanic or Latino
Geographical mobility - Same house 1 year ago (%) - American Indian and Alaska Native
Geographical mobility - Same house 1 year ago (%) - Multirace
Geographical mobility - Same house 1 year ago (%) - Other Race
Geographical mobility - Moved within same county (%)
Geographical mobility - Moved within same county (%) - White
Geographical mobility - Moved within same county (%) - Black or African American
Geographical mobility - Moved within same county (%) - Asian
Geographical mobility - Moved within same county (%) - Hispanic or Latino
Geographical mobility - Moved within same county (%) - American Indian and Alaska Native
Geographical mobility - Moved within same county (%) - Multirace
Geographical mobility - Moved within same county (%) - Other Race
Geographical mobility - Moved from different county within same state (%)
Geographical mobility - Moved from different county within same state (%) - White
Geographical mobility - Moved from different county within same state (%) - Black or African American
Geographical mobility - Moved from different county within same state (%) - Asian
Geographical mobility - Moved from different county within same state (%) - Hispanic or Latino
Geographical mobility - Moved from different county within same state (%) - American Indian and Alaska Native
Geographical mobility - Moved from different county within same state (%) - Multirace
Geographical mobility - Moved from different county within same state (%) - Other Race
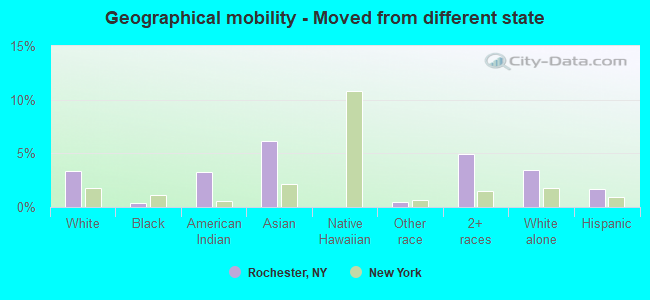
Geographical mobility - Moved from different state (%)
Geographical mobility - Moved from different state (%) - White
Geographical mobility - Moved from different state (%) - Black or African American
Geographical mobility - Moved from different state (%) - Asian
Geographical mobility - Moved from different state (%) - Hispanic or Latino
Geographical mobility - Moved from different state (%) - American Indian and Alaska Native
Geographical mobility - Moved from different state (%) - Multirace
Geographical mobility - Moved from different state (%) - Other Race
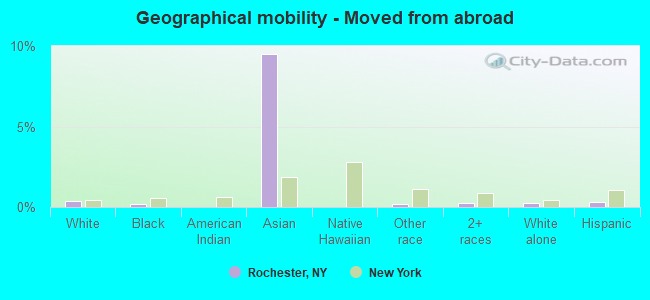
Geographical mobility - Moved from abroad (%)
Geographical mobility - Moved from abroad (%) - White
Geographical mobility - Moved from abroad (%) - Black or African American
Geographical mobility - Moved from abroad (%) - Asian
Geographical mobility - Moved from abroad (%) - Hispanic or Latino
Geographical mobility - Moved from abroad (%) - American Indian and Alaska Native
Geographical mobility - Moved from abroad (%) - Multirace
Geographical mobility - Moved from abroad (%) - Other Race
Place of birth for the foreign-born population - Ireland (%)
Place of birth for the foreign-born population - Denmark (%)
Place of birth for the foreign-born population - Norway (%)
Place of birth for the foreign-born population - Sweden (%)
Place of birth for the foreign-born population - United Kingdom (%)
Place of birth for the foreign-born population - England (%)
Place of birth for the foreign-born population - Scotland (%)
Place of birth for the foreign-born population - Other Northern Europe (%)
Place of birth for the foreign-born population - Austria (%)
Place of birth for the foreign-born population - Belgium (%)
Place of birth for the foreign-born population - France (%)
Place of birth for the foreign-born population - Germany (%)
Place of birth for the foreign-born population - Netherlands (%)
Place of birth for the foreign-born population - Switzerland (%)
Place of birth for the foreign-born population - Other Western Europe (%)
Place of birth for the foreign-born population - Greece (%)
Place of birth for the foreign-born population - Italy (%)
Place of birth for the foreign-born population - Portugal (%)
Place of birth for the foreign-born population - Spain (%)
Place of birth for the foreign-born population - Other Southern Europe (%)
Place of birth for the foreign-born population - Albania (%)
Place of birth for the foreign-born population - Belarus (%)
Place of birth for the foreign-born population - Bosnia and Herzegovina (%)
Place of birth for the foreign-born population - Bulgaria (%)
Place of birth for the foreign-born population - Croatia (%)
Place of birth for the foreign-born population - Czechoslovakia (%)
Place of birth for the foreign-born population - Hungary (%)
Place of birth for the foreign-born population - Latvia (%)
Place of birth for the foreign-born population - Lithuania (%)
Place of birth for the foreign-born population - North Macedonia (Macedonia) (%)
Place of birth for the foreign-born population - Moldova (%)
Place of birth for the foreign-born population - Poland (%)
Place of birth for the foreign-born population - Romania (%)
Place of birth for the foreign-born population - Russia (%)
Place of birth for the foreign-born population - Serbia (%)
Place of birth for the foreign-born population - Ukraine (%)
Place of birth for the foreign-born population - Other Eastern Europe (%)
Place of birth for the foreign-born population - China (%)
Place of birth for the foreign-born population - Hong Kong (%)
Place of birth for the foreign-born population - Taiwan (%)
Place of birth for the foreign-born population - Japan (%)
Place of birth for the foreign-born population - Korea (%)
Place of birth for the foreign-born population - Other Eastern Asia (%)
Place of birth for the foreign-born population - Afghanistan (%)
Place of birth for the foreign-born population - Bangladesh (%)
Place of birth for the foreign-born population - India (%)
Place of birth for the foreign-born population - Iran (%)
Place of birth for the foreign-born population - Kazakhstan (%)
Place of birth for the foreign-born population - Nepal (%)
Place of birth for the foreign-born population - Pakistan (%)
Place of birth for the foreign-born population - Sri Lanka (%)
Place of birth for the foreign-born population - Uzbekistan (%)
Place of birth for the foreign-born population - Other South Central Asia (%)
Place of birth for the foreign-born population - Burma (%)
Place of birth for the foreign-born population - Cambodia (%)
Place of birth for the foreign-born population - Indonesia (%)
Place of birth for the foreign-born population - Laos (%)
Place of birth for the foreign-born population - Malaysia (%)
Place of birth for the foreign-born population - Philippines (%)
Place of birth for the foreign-born population - Singapore (%)
Place of birth for the foreign-born population - Thailand (%)
Place of birth for the foreign-born population - Vietnam (%)
Place of birth for the foreign-born population - Other South Eastern Asia (%)
Place of birth for the foreign-born population - Armenia (%)
Place of birth for the foreign-born population - Iraq (%)
Place of birth for the foreign-born population - Israel (%)
Place of birth for the foreign-born population - Jordan (%)
Place of birth for the foreign-born population - Kuwait (%)
Place of birth for the foreign-born population - Lebanon (%)
Place of birth for the foreign-born population - Saudi Arabia (%)
Place of birth for the foreign-born population - Syria (%)
Place of birth for the foreign-born population - Turkey (%)
Place of birth for the foreign-born population - Yemen (%)
Place of birth for the foreign-born population - Other Western Asia (%)
Place of birth for the foreign-born population - Eritrea (%)
Place of birth for the foreign-born population - Ethiopia (%)
Place of birth for the foreign-born population - Kenya (%)
Place of birth for the foreign-born population - Somalia (%)
Place of birth for the foreign-born population - Uganda (%)
Place of birth for the foreign-born population - Zimbabwe (%)
Place of birth for the foreign-born population - Other Eastern Africa (%)
Place of birth for the foreign-born population - Cameroon (%)
Place of birth for the foreign-born population - Congo (%)
Place of birth for the foreign-born population - Democratic Republic of Congo (Zaire) (%)
Place of birth for the foreign-born population - Other Middle Africa (%)
Place of birth for the foreign-born population - Egypt (%)
Place of birth for the foreign-born population - Morocco (%)
Place of birth for the foreign-born population - Sudan (%)
Place of birth for the foreign-born population - Other Northern Africa (%)
Place of birth for the foreign-born population - South Africa (%)
Place of birth for the foreign-born population - Other Southern Africa (%)
Place of birth for the foreign-born population - Cabo Verde (%)
Place of birth for the foreign-born population - Ghana (%)
Place of birth for the foreign-born population - Liberia (%)
Place of birth for the foreign-born population - Nigeria (%)
Place of birth for the foreign-born population - Senegal (%)
Place of birth for the foreign-born population - Sierra Leone (%)
Place of birth for the foreign-born population - Other Western Africa (%)
Place of birth for the foreign-born population - Australia (%)
Place of birth for the foreign-born population - New Zealand (%)
Place of birth for the foreign-born population - Fiji (%)
Place of birth for the foreign-born population - Micronesia (%)
Place of birth for the foreign-born population - Bahamas (%)
Place of birth for the foreign-born population - Barbados (%)
Place of birth for the foreign-born population - Cuba (%)
Place of birth for the foreign-born population - Dominica (%)
Place of birth for the foreign-born population - Dominican Republic (%)
Place of birth for the foreign-born population - Grenada (%)
Place of birth for the foreign-born population - Haiti (%)
Place of birth for the foreign-born population - Jamaica (%)
Place of birth for the foreign-born population - St. Vincent and the Grenadines (%)
Place of birth for the foreign-born population - Trinidad and Tobago (%)
Place of birth for the foreign-born population - West Indies (%)
Place of birth for the foreign-born population - Other Caribbean (%)
Place of birth for the foreign-born population - Belize (%)
Place of birth for the foreign-born population - Costa Rica (%)
Place of birth for the foreign-born population - El Salvador (%)
Place of birth for the foreign-born population - Guatemala (%)
Place of birth for the foreign-born population - Honduras (%)
Place of birth for the foreign-born population - Mexico (%)
Place of birth for the foreign-born population - Nicaragua (%)
Place of birth for the foreign-born population - Panama (%)
Place of birth for the foreign-born population - Other Central America (%)
Place of birth for the foreign-born population - Argentina (%)
Place of birth for the foreign-born population - Bolivia (%)
Place of birth for the foreign-born population - Brazil (%)
Place of birth for the foreign-born population - Chile (%)
Place of birth for the foreign-born population - Colombia (%)
Place of birth for the foreign-born population - Ecuador (%)
Place of birth for the foreign-born population - Guyana (%)
Place of birth for the foreign-born population - Peru (%)
Place of birth for the foreign-born population - Uruguay (%)
Place of birth for the foreign-born population - Venezuela (%)
Place of birth for the foreign-born population - Other South America (%)
Place of birth for the foreign-born population - Canada (%)
Place of birth for the foreign-born population - Other Northern America (%)
Place of birth for the foreign-born population - Other (%)
Latest news about races in Rochester, NY collected exclusively by city-data.com from local newspapers, TV, and radio stations
According to 2022 data, the most numerous races in Rochester, NY are White alone (72,548 residents), Hispanic (43,774 residents), and Black alone (73,249 residents). 80.9% of Rochester residents speak English at home. 9.2% of Rochester, NY residents are foreign-born (3.6% born in Latin America, 3.1% born in Asia, 1.3% born in Africa, 1.0% born in Europe), which is 140.3% less than the foreign-born rate of 22.0% across the entire state of New York.
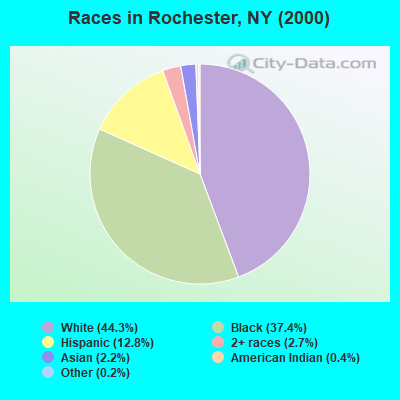
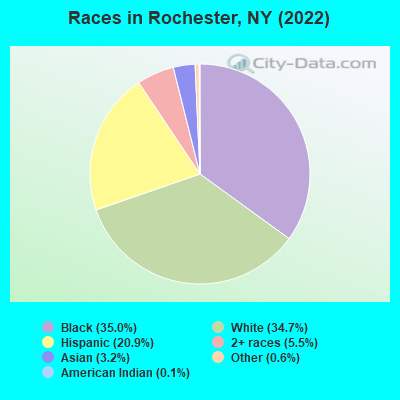
Race distribution in Rochester
2000 2022
97,395 44.3% White alone 82,267 37.4% Black alone 28,032 12.8% Hispanic 5,868 2.7% Two or more races 4,867 2.2% Asian alone 809 0.4% American Indian alone 474 0.2% Other race alone 61 0.03% Native Hawaiian and Other
73,249 35.0% Black alone 72,548 34.7% White alone 43,774 20.9% Hispanic 11,617 5.5% Two or more races 6,656 3.2% Asian alone 1,193 0.6% Other race alone 288 0.1% American Indian alone
2000 2022
11,760,981 62.0% White alone 2,867,583 15.1% Hispanic 2,812,623 14.8% Black alone 1,035,926 5.5% Asian alone 366,116 1.9% Two or more races 75,499 0.4% Other race alone 52,499 0.3% American Indian alone 5,230 0.03% Native Hawaiian and Other
10,408,933 52.9% White alone 3,867,299 19.7% Hispanic 2,633,840 13.4% Black alone 1,776,286 9.0% Asian alone 732,670 3.7% Two or more races 216,110 1.1% Other race alone 35,082 0.2% American Indian alone 6,931 0.04% Native Hawaiian and Other
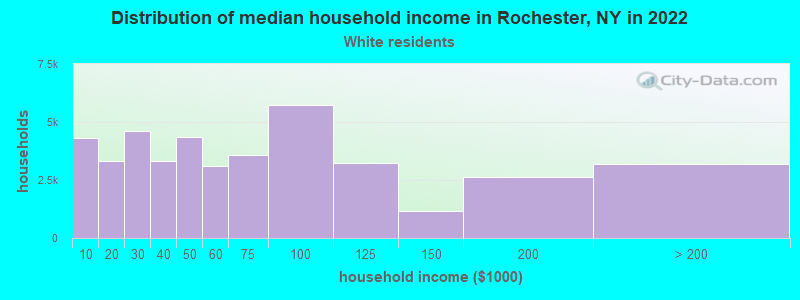
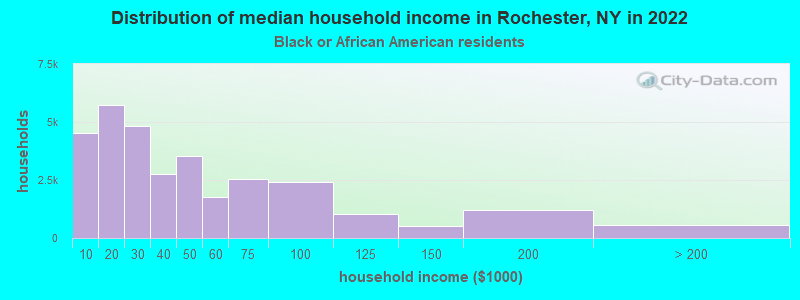
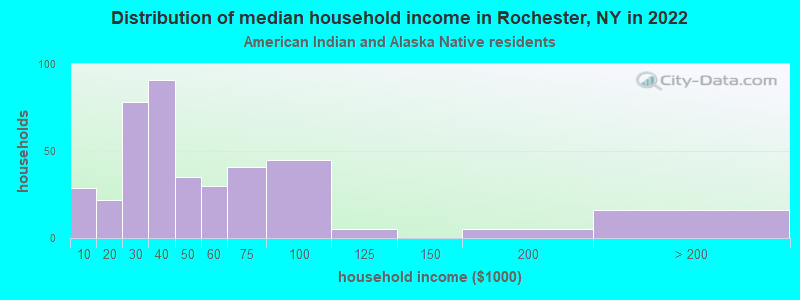
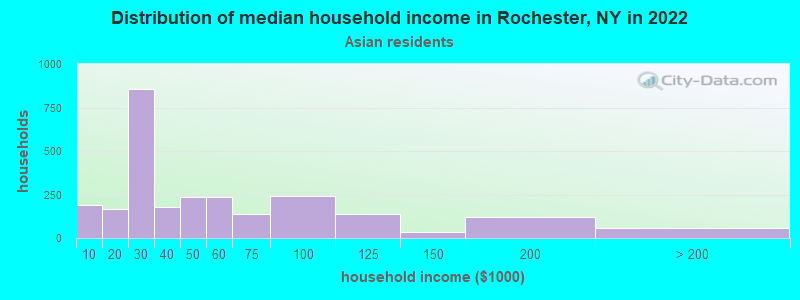
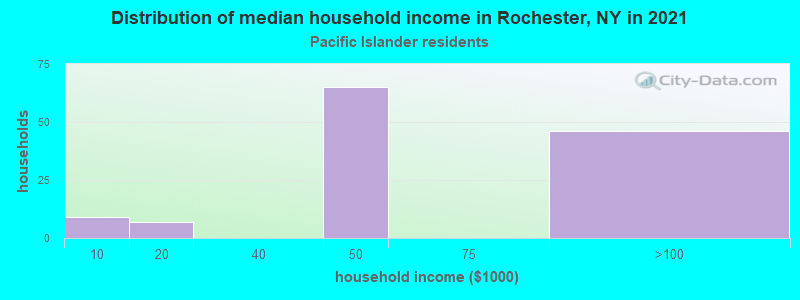
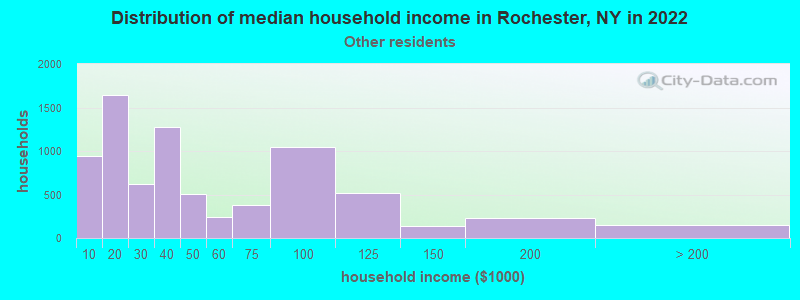
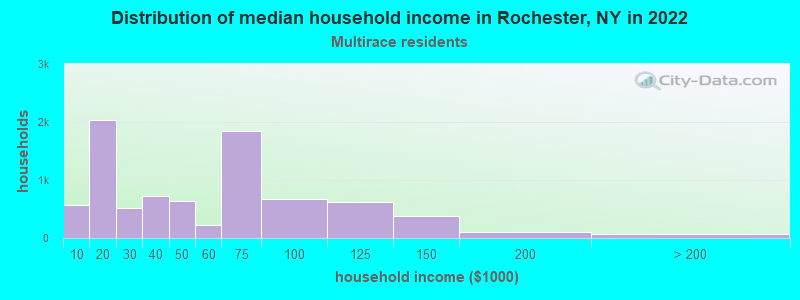
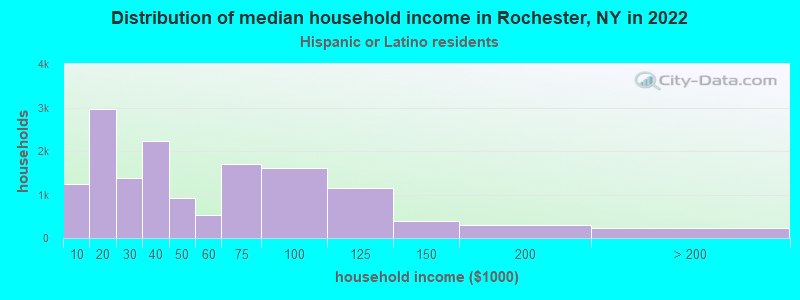
Income and house value in Rochester Median household income in 2022 $54,642 White non-Hispanic householders$31,660 Black householders$38,115 American Indian and Alaska Native householders$31,474 Asian householders$36,668 Some other race householders$46,514 Two or more races householders$38,485 Hispanic or Latino race householdersMedian 2022 house value $137,283 White Non-Hispanic householders$120,149 Black or African American householders$165,768 American Indian or Alaska Native householders $134,285 Asian householders$117,579 Some other race householders$126,360 Two or more races householders$119,293 Hispanic or Latino householders
Median age by race in Rochester
40.5 Median age for White residents42.1 39.3 34.8 Median age for Black or African American residents31.8 36.8 47.6 Median age for American Indian / Alaska Native residents34.7 61.2 30.4 Median age for Asian residents32.0 27.3 -666,666,666.0 Median age for Native Hawaiian / Pacific Islander residents-666,666,666.0 -666,666,666.0 29.5 Median age for Other race residents27.9 31.0 24.7 Median age for Two or more races residents21.9 25.4 42.2 Median age for White alone residents45.0 39.8 28.8 Median age for Hispanic or Latino residents27.7 29.3
Owner/renter occupied households by race in Rochester
House owners and renters - White residents 20,785 48.9% Owner occupied21,734 51.1% Renter occupiedHouse owners and renters - Black or African American residents 11,613 37.1% Owner occupied19,723 62.9% Renter occupiedHouse owners and renters - American Indian / Alaska Native residents 152 34.4% Owner occupied291 65.6% Renter occupiedHouse owners and renters - Asian residents 546 24.1% Owner occupied1,722 75.9% Renter occupiedHouse owners and renters - Native Hawaiian / Pacific Islander residents 75 56.3% Owner occupied58 43.7% Renter occupiedHouse owners and renters - Other race residents 2,787 36.3% Owner occupied4,892 63.7% Renter occupiedHouse owners and renters - Two or more races residents 2,083 24.8% Owner occupied6,302 75.2% Renter occupiedHouse owners and renters - White alone residents 20,188 49.4% Owner occupied20,683 50.6% Renter occupiedHouse owners and renters - Hispanic or Latino residents 4,809 32.8% Owner occupied9,844 67.2% Renter occupied
Language usage in Rochester
English speakers - Total 80.9% of residents of Rochester speak English at home.
13.1% of residents speak Spanish at home 13,701 52.7% Speak English very well12,290 47.3% Speak English less than very well6.0% of residents speak other language at home 6,010 50.3% Speak English very well5,930 49.7% Speak English less than very well
English speakers - Born in the United States 91.5% of residents of Rochester speak English at home.
4.7% of residents speak Spanish at home 1,026 61.9% Speak English very well631 38.1% Speak English less than very well3.8% of residents speak other language at home 1,074 80.2% Speak English very well265 19.8% Speak English less than very well
English speakers - Native, born elsewhere 17.6% of residents of Rochester speak English at home.
80.3% of residents speak Spanish at home 5,027 39.7% Speak English very well7,636 60.3% Speak English less than very well2.0% of residents speak other language at home 273 84.8% Speak English very well49 15.2% Speak English less than very well
English speakers - Foreign-born 33.1% of residents of Rochester speak English at home.
23.5% of residents speak Spanish at home 761 21.3% Speak English very well2,820 78.7% Speak English less than very well43.4% of residents speak other language at home 2,193 33.2% Speak English very well4,404 66.8% Speak English less than very well
White (Caucasian) - Speak only English Native:
92.8% (66,814)Foreign-born:
51.3% (1,547)
White (Caucasian) - Speak another language Native:
7.2% (5,204)Foreign-born:
48.7% (1,467)
Black or African American - Speak only English Native:
96.4% (67,555)Foreign-born:
77.1% (2,018)
Black or African American - Speak another language Native:
3.6% (2,511)Foreign-born:
22.9% (599)
American Indian / Alaska Native - Speak only English Native:
41.8% (396)Foreign-born:
16.2% (21)
American Indian / Alaska Native - Speak another language Native:
60.7% (575)Foreign-born:
80.0% (102)
Asian - Speak only English Native:
38.0% (642)Foreign-born:
19.3% (946)
Asian - Speak another language Native:
62.0% (1,047)Foreign-born:
80.7% (3,960)
Native Hawaiian / Pacific Islander - Speak only English Native:
36.2% (72)Foreign-born:
22.3% (21)
Native Hawaiian / Pacific Islander - Speak another language Native:
30.4% (61)Foreign-born:
69.9% (65)
Other race - Speak only English Native:
31.3% (5,851)Foreign-born:
10.5% (356)
Other race - Speak another language Native:
68.7% (12,853)Foreign-born:
89.5% (3,020)
Two or more races - Speak only English Native:
70.2% (14,293)Foreign-born:
11.1% (141)
Two or more races - Speak another language Native:
29.8% (6,054)Foreign-born:
88.9% (1,132)
White alone - Speak only English Native:
95.7% (64,850)Foreign-born:
49.7% (1,452)
White alone - Speak another language Native:
4.3% (2,892)Foreign-born:
50.3% (1,467)
Hispanic or Latino - Speak only English Native:
39.9% (14,214)Foreign-born:
13.2% (558)
Hispanic or Latino - Speak another language Native:
60.1% (21,428)Foreign-born:
86.8% (3,654)
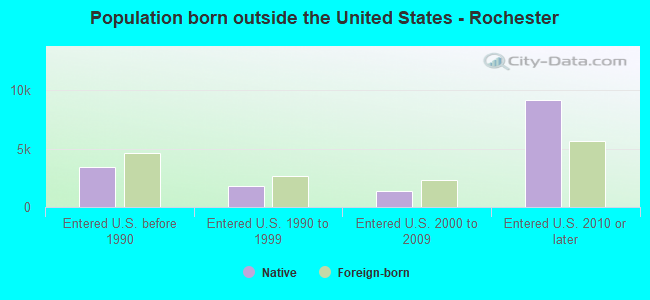
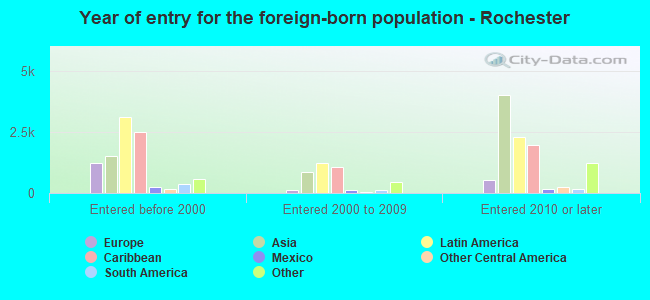
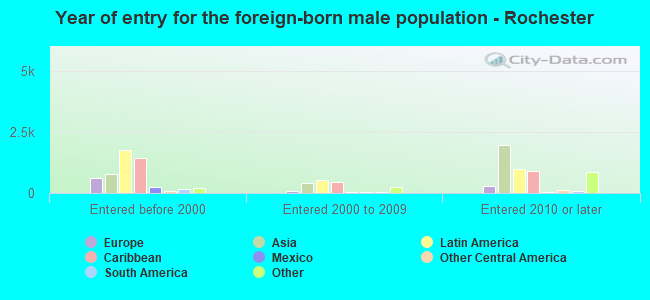
Foreign-born residents in Rochester 19,206 residents are foreign born (3.6% Latin America , 3.1% Asia , 1.3% Africa , 1.0% Europe ).
This city:
9.2%New York:
22.6%
Marital status for residents in Rochester Marital status - White (Caucasian) population 15 years and over
Males 50.1% Never married29.9% Now married1.9% Separated2.9% Widowed15.1% DivorcedFemales 48.5% Never married25.9% Now married3.1% Separated8.3% Widowed14.1% DivorcedWomen who gave birth in the past 12 months Now married:
46.2% (332)Unmarried:
53.8% (386)
Women who did not give birth in the past 12 months Now married:
25.3% (4,973)Unmarried:
74.7% (14,647)
Marital status - Black or African American population 15 years and over
Males 64.8% Never married19.8% Now married1.4% Separated2.3% Widowed11.7% DivorcedFemales 61.8% Never married16.4% Now married2.9% Separated6.6% Widowed12.3% DivorcedWomen who gave birth in the past 12 months Now married:
12.0% (94)Unmarried:
88.0% (689)
Women who did not give birth in the past 12 months Now married:
14.0% (2,537)Unmarried:
86.0% (15,521)
Marital status - American Indian / Alaska Native population 15 years and over
Males 68.0% Never married16.6% Now married1.4% Separated0.0% Widowed14.1% DivorcedFemales 61.9% Never married20.0% Now married5.4% Separated0.0% Widowed12.7% DivorcedWomen who gave birth in the past 12 months Now married:
32.1% (13)Unmarried:
67.9% (27)
Women who did not give birth in the past 12 months Now married:
16.6% (51)Unmarried:
83.4% (259)
Marital status - Asian population 15 years and over
Males 59.4% Never married30.3% Now married1.7% Separated0.8% Widowed7.9% DivorcedFemales 55.9% Never married35.4% Now married2.0% Separated1.1% Widowed5.7% DivorcedWomen who gave birth in the past 12 months Now married:
75.9% (64)Unmarried:
24.1% (20)
Women who did not give birth in the past 12 months Now married:
28.0% (705)Unmarried:
72.0% (1,815)
Marital status - Native Hawaiian / Pacific Islander population 15 years and over
Males 33.6% Never married14.0% Now married52.3% Separated0.0% Widowed0.0% DivorcedFemales 20.7% Never married47.6% Now married31.7% Separated0.0% Widowed0.0% DivorcedWomen who did not give birth in the past 12 months Now married:
79.3% (121)Unmarried:
20.7% (32)
Marital status - Other race population 15 years and over
Males 49.4% Never married38.5% Now married0.4% Separated3.9% Widowed7.7% DivorcedFemales 55.6% Never married26.9% Now married5.3% Separated5.6% Widowed6.6% DivorcedWomen who gave birth in the past 12 months Now married:
100.0% (295)Unmarried:
0.0% (0)
Women who did not give birth in the past 12 months Now married:
24.1% (1,633)Unmarried:
75.9% (5,151)
Marital status - Two or more races population 15 years and over
Males 66.1% Never married17.2% Now married4.3% Separated0.8% Widowed11.6% DivorcedFemales 70.7% Never married12.9% Now married3.5% Separated3.0% Widowed9.8% DivorcedWomen who gave birth in the past 12 months Now married:
22.0% (193)Unmarried:
78.0% (684)
Women who did not give birth in the past 12 months Now married:
11.2% (869)Unmarried:
88.8% (6,893)
Marital status - White alone, not Hispanic / Latino population 15 years and over
Males 49.2% Never married30.5% Now married2.1% Separated3.1% Widowed15.2% DivorcedFemales 48.3% Never married26.0% Now married3.3% Separated7.9% Widowed14.5% DivorcedWomen who gave birth in the past 12 months Now married:
46.2% (332)Unmarried:
53.8% (386)
Women who did not give birth in the past 12 months Now married:
25.7% (4,762)Unmarried:
74.3% (13,738)
Marital status - Hispanic or Latino population 15 years and over
Males 55.4% Never married28.3% Now married1.4% Separated2.1% Widowed12.8% DivorcedFemales 61.6% Never married22.0% Now married4.0% Separated5.1% Widowed7.2% DivorcedWomen who gave birth in the past 12 months Now married:
93.0% (440)Unmarried:
7.0% (33)
Women who did not give birth in the past 12 months Now married:
18.3% (2,366)Unmarried:
81.7% (10,590)
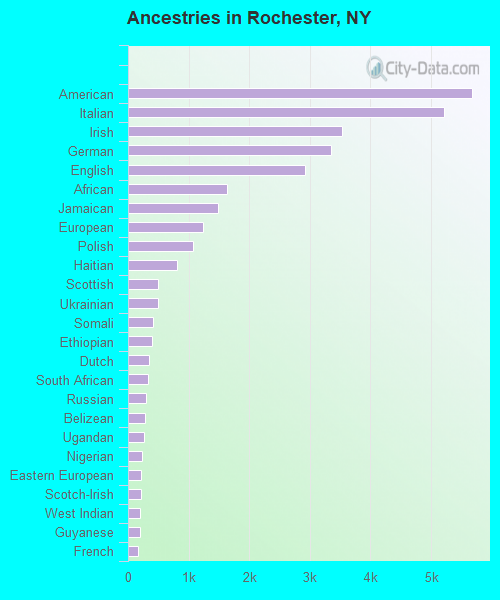
Ancestries in Rochester
5,672 5.0% American5,213 4.6% Italian3,537 3.1% Irish3,344 3.0% German2,916 2.6% English1,637 1.5% African1,486 1.3% Jamaican1,244 1.1% European1,067 0.9% Polish814 0.7% Haitian496 0.4% Scottish491 0.4% Ukrainian417 0.4% Somali395 0.4% Ethiopian341 0.3% Dutch329 0.3% South African303 0.3% Russian273 0.2% Belizean257 0.2% Ugandan226 0.2% Nigerian220 0.2% Eastern European215 0.2% Scotch-Irish196 0.2% West Indian192 0.2% Guyanese163 0.1% French161 0.1% Cape Verdean158 0.1% Arab154 0.1% French Canadian152 0.1% British143 0.1% Kenyan139 0.1% Lithuanian134 0.1% Yugoslavian129 0.1% Northern European117 0.1% Greek95 0.08% Scandinavian95 0.08% Trinidadian and Tobagonian94 0.08% Swedish91 0.08% Portuguese87 0.08% Turkish84 0.07% Norwegian82 0.07% British West Indian81 0.07% Romanian81 0.07% Iranian70 0.06% Hungarian66 0.06% Croatian63 0.06% Welsh62 0.05% Lebanese62 0.05% Pennsylvania German62 0.05% Macedonian53 0.05% Swiss49 0.04% Moroccan49 0.04% Ghanaian48 0.04% Afghan46 0.04% Egyptian46 0.04% Iraqi38 0.03% Serbian31 0.03% Israeli28 0.02% Armenian26 0.02% Canadian24 0.02% Danish23 0.02% Austrian20 0.02% Slovene18 0.02% Slavic18 0.02% Liberian18 0.02% Icelander16 0.01% Celtic15 0.01% Bulgarian14 0.01% Belgian14 0.01% Czech13 0.01% Finnish13 0.01% Sudanese12 0.01% Brazilian11 0.01% New Zealander10 0.01% Estonian10 0.01% Slovak8 0.01% Barbadian8 0.01% Albanian
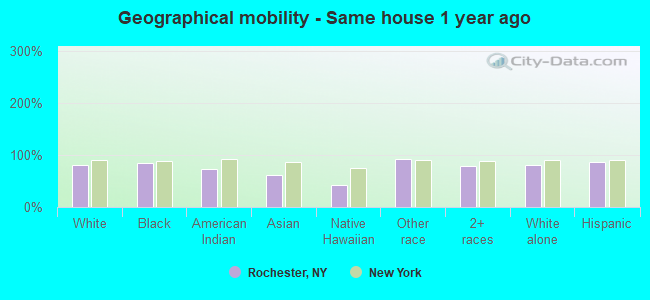
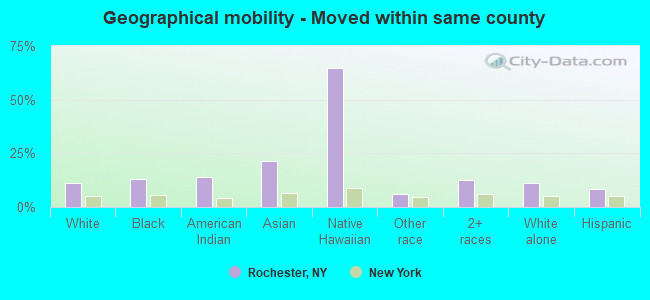
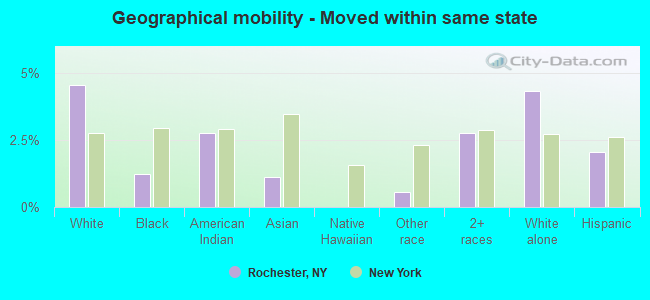
Geographical mobility in Rochester Same house 1 year ago 62,139 80.5% White (Caucasian)64,799 85.1% Black or African American818 72.8% American Indian / Alaska Native4,100 61.6% Asian147 42.2% Native Hawaiian / Pacific Islander22,607 92.7% Other race18,047 79.4% Two or more races58,217 80.5% White alone, not Hispanic / Latino38,145 87.6% Hispanic or LatinoMoved within same county 8,686 11.2% White / Caucasian10,023 13.2% Black or African American157 14.0% American Indian / Alaska Native1,438 21.6% Asian226 64.8% Native Hawaiian / Pacific Islander1,491 6.1% Other race2,868 12.6% Two or more races8,250 11.4% White alone, not Hispanic / Latino3,610 8.3% Hispanic or LatinoMoved within same state 3,513 4.5% White / Caucasian927 1.2% Black or African American31 2.8% American Indian / Alaska Native74 1.1% Asian135 0.6% Other race630 2.8% Two or more races3,133 4.3% White alone, not Hispanic / Latino889 2.0% Hispanic or LatinoMoved from different state 2,578 3.3% White / Caucasian281 0.4% Black or African American36 3.2% American Indian / Alaska Native410 6.2% Asian113 0.5% Other race1,126 5.0% Two or more races2,494 3.4% White alone, not Hispanic / Latino744 1.7% Hispanic or LatinoMoved from abroad 297 0.4% White147 0.2% Black or African American634 9.5% Asian44 0.2% Other race54 0.2% Two or more races202 0.3% White alone, not Hispanic / Latino139 0.3% Hispanic or Latino
Children Nativity (place of birth) in Rochester
Children under 6 years - Living with two parents Both parents native 2,917 100.0% NativeBoth parents foreign-born 969 100.0% NativeOne native, one foreign-born parent 358 100.0% NativeChildren under 6 years - Living with one parent Native parent 7,586 100.0% NativeForeign-born parent 265 100.0% NativeChildren 6 to 17 years - Living with two parents Both parents native 5,967 97.4% Native159 2.6% Foreign-bornBoth parents foreign-born 1,131 55.4% Native909 44.6% Foreign-bornOne native, one foreign-born parent 1,307 100.0% NativeChildren 6 to 17 years - Living with one parent Native parent 17,731 100.0% NativeForeign-born parent 323 50.0% Native323 50.0% Foreign-born
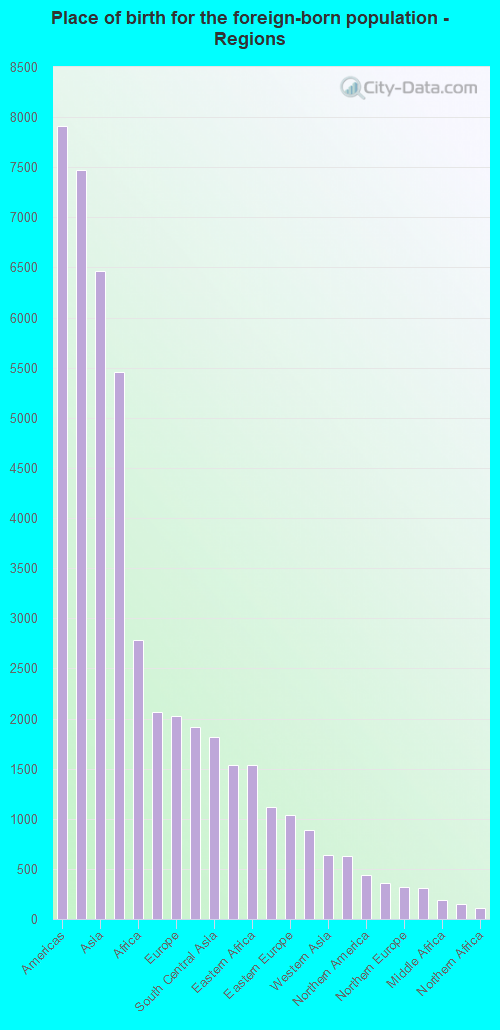
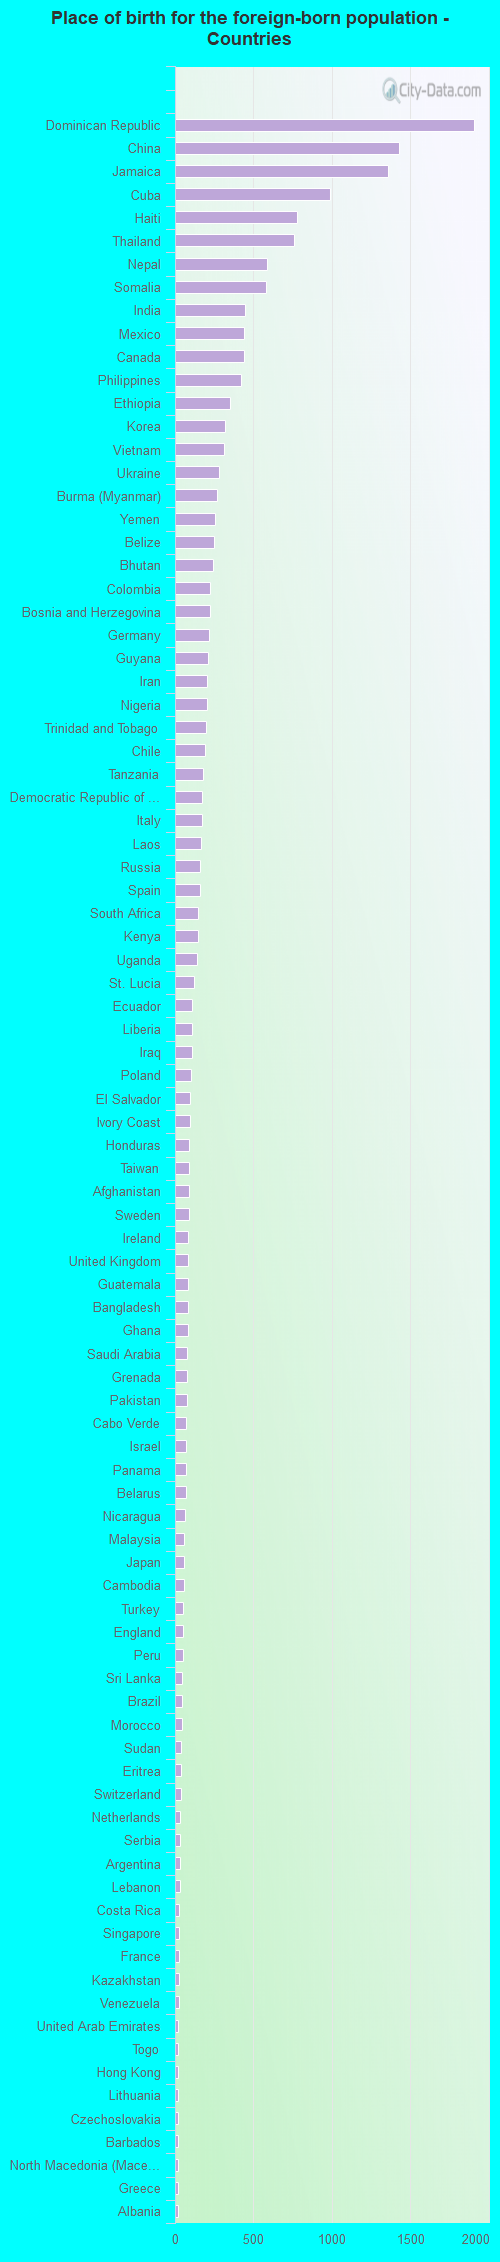
Place of birth for residents in Rochester 7,914 Americas7,476 Latin America6,460 Asia5,462 Caribbean2,781 Africa2,063 South Eastern Asia2,024 Europe1,912 Eastern Asia1,817 South Central Asia1,539 China1,538 Eastern Africa1,122 Central America1,033 Eastern Europe891 South America634 Western Asia633 Western Africa438 Northern America359 Southern Europe318 Northern Europe313 Western Europe191 Middle Africa148 Southern Africa111 Northern Africa24 Oceania24 Australia and New Zealand Subregion1,906 Dominican Republic1,426 China1,357 Jamaica985 Cuba778 Haiti760 Thailand586 Nepal583 Somalia443 India439 Mexico438 Canada421 Philippines353 Ethiopia317 Korea311 Vietnam280 Ukraine267 Burma (Myanmar)258 Yemen247 Belize242 Bhutan220 Colombia220 Bosnia and Herzegovina215 Germany210 Guyana204 Iran202 Nigeria199 Trinidad and Tobago192 Chile181 Tanzania174 Democratic Republic of Congo (Zaire)169 Italy163 Laos161 Russia161 Spain148 South Africa147 Kenya142 Uganda122 St. Lucia111 Ecuador111 Liberia107 Iraq100 Poland98 El Salvador95 Ivory Coast91 Honduras90 Taiwan90 Afghanistan89 Sweden85 Ireland83 United Kingdom83 Guatemala80 Bangladesh80 Ghana77 Saudi Arabia75 Grenada75 Pakistan73 Cabo Verde72 Israel72 Panama69 Belarus62 Nicaragua57 Malaysia56 Japan55 Cambodia54 Turkey52 England50 Peru47 Sri Lanka44 Brazil44 Morocco39 Sudan38 Eritrea38 Switzerland33 Netherlands32 Serbia29 Argentina29 Lebanon27 Costa Rica26 Singapore25 France25 Kazakhstan23 Venezuela22 United Arab Emirates22 Togo21 Hong Kong20 Lithuania20 Czechoslovakia19 Barbados19 North Macedonia (Macedonia)19 Greece18 Albania17 Egypt17 Congo13 Uzbekistan12 Bulgaria12 New Zealand11 Australia11 Kuwait9 Algeria8 Portugal6 Bolivia5 Hungary3 Senegal2 Scotland2 Zimbabwe1 Croatia
Grandparents responsible for own grandchildren in Rochester
Grandparents (30 to 59 years) White / Caucasian 280 47.3% Responsible for grandchildren313 52.7% Not responsible for grandchildrenBlack or African American 856 61.9% Responsible for grandchildren527 38.1% Not responsible for grandchildrenAmerican Indian / Alaska Native 54 100.0% Not responsible for grandchildrenAsian 28 29.6% Responsible for grandchildren66 70.4% Not responsible for grandchildrenOther race 110 34.6% Responsible for grandchildren208 65.4% Not responsible for grandchildrenTwo or more races 38 37.9% Responsible for grandchildren63 62.1% Not responsible for grandchildrenWhite alone, not Hispanic / Latino 207 41.9% Responsible for grandchildren286 58.1% Not responsible for grandchildrenHispanic or Latino 110 23.7% Responsible for grandchildren354 76.3% Not responsible for grandchildrenGrandparents (60 years and over) White / Caucasian 202 45.7% Responsible for grandchildren240 54.3% Not responsible for grandchildrenBlack or African American 258 40.4% Responsible for grandchildren381 59.6% Not responsible for grandchildrenAsian 139 100.0% Not responsible for grandchildrenOther race 118 27.3% Responsible for grandchildren314 72.7% Not responsible for grandchildrenTwo or more races 124 73.3% Responsible for grandchildren45 26.7% Not responsible for grandchildrenWhite alone, not Hispanic / Latino 178 52.4% Responsible for grandchildren161 47.6% Not responsible for grandchildrenHispanic or Latino 202 39.1% Responsible for grandchildren314 60.9% Not responsible for grandchildren
Zip codes: 14604 , 14605 , 14607 , 14608 , 14611 , 14612 , 14613 , 14614 , 14615 , 14616 , 14619 , 14627 .