Races in Rochester Hills, Michigan (MI) Detailed Stats
Data:
Races - White alone (%)
Races - White alone (% change since 2000)
Races - Black alone (%)
Races - Black alone (% change since 2000)
Races - American Indian alone (%)
Races - American Indian alone (% change since 2000)
Races - Asian alone (%)
Races - Asian alone (% change since 2000)
Races - Hispanic (%)
Races - Hispanic (% change since 2000)
Races - Native Hawaiian and Other Pacific Islander alone (%)
Races - Native Hawaiian and Other Pacific Islander alone (% change since 2000)
Races - Two or more races(%)
Races - Two or more races(% change since 2000)
Races - Other race alone (%)
Races - Other race alone (% change since 2000)
Racial diversity
Place of birth - Born in state of residence (%)
Place of birth - Born in state of residence (%) - White
Place of birth - Born in state of residence (%) - Black or African American
Place of birth - Born in state of residence (%) - Asian
Place of birth - Born in state of residence (%) - Hispanic or Latino
Place of birth - Born in state of residence (%) - American Indian and Alaska Native
Place of birth - Born in state of residence (%) - Multirace
Place of birth - Born in state of residence (%) - Other Race
Place of birth - Born in other state (%)
Place of birth - Born in other state (%) - White
Place of birth - Born in other state (%) - Black or African American
Place of birth - Born in other state (%) - Asian
Place of birth - Born in other state (%) - Hispanic or Latino
Place of birth - Born in other state (%) - American Indian and Alaska Native
Place of birth - Born in other state (%) - Multirace
Place of birth - Born in other state (%) - Other Race
Place of birth - Native, outside of US (%)
Place of birth - Native, outside of US (%) - White
Place of birth - Native, outside of US (%) - Black or African American
Place of birth - Native, outside of US (%) - Asian
Place of birth - Native, outside of US (%) - Hispanic or Latino
Place of birth - Native, outside of US (%) - American Indian and Alaska Native
Place of birth - Native, outside of US (%) - Multirace
Place of birth - Native, outside of US (%) - Other Race
Place of birth - Foreign born (%)
Place of birth - Foreign born (%) - White
Place of birth - Foreign born (%) - Black or African American
Place of birth - Foreign born (%) - Asian
Place of birth - Foreign born (%) - Hispanic or Latino
Place of birth - Foreign born (%) - American Indian and Alaska Native
Place of birth - Foreign born (%) - Multirace
Place of birth - Foreign born (%) - Other Race
Residents speaking English at home (%)
Residents speaking English at home - Born in the United States (%)
Residents speaking English at home - Native, born elsewhere (%)
Residents speaking English at home - Foreign born (%)
Residents speaking Spanish at home (%)
Residents speaking Spanish at home - Born in the United States (%)
Residents speaking Spanish at home - Native, born elsewhere (%)
Residents speaking Spanish at home - Foreign born (%)
Residents speaking other language at home (%)
Residents speaking other language at home - Born in the United States (%)
Residents speaking other language at home - Native, born elsewhere (%)
Residents speaking other language at home - Foreign born (%)
Marital status - Never married (%)
Marital status - Now married (%)
Marital status - Separated (%)
Marital status - Widowed (%)
Marital status - Divorced (%)
Ancestries Reported - Arab (%)
Ancestries Reported - Czech (%)
Ancestries Reported - Danish (%)
Ancestries Reported - Dutch (%)
Ancestries Reported - English (%)
Ancestries Reported - French (%)
Ancestries Reported - French Canadian (%)
Ancestries Reported - German (%)
Ancestries Reported - Greek (%)
Ancestries Reported - Hungarian (%)
Ancestries Reported - Irish (%)
Ancestries Reported - Italian (%)
Ancestries Reported - Lithuanian (%)
Ancestries Reported - Norwegian (%)
Ancestries Reported - Polish (%)
Ancestries Reported - Portuguese (%)
Ancestries Reported - Russian (%)
Ancestries Reported - Scotch-Irish (%)
Ancestries Reported - Scottish (%)
Ancestries Reported - Slovak (%)
Ancestries Reported - Subsaharan African (%)
Ancestries Reported - Swedish (%)
Ancestries Reported - Swiss (%)
Ancestries Reported - Ukrainian (%)
Ancestries Reported - United States (%)
Ancestries Reported - Welsh (%)
Ancestries Reported - West Indian (%)
Ancestries Reported - Other (%)
Geographical mobility - Same house 1 year ago (%)
Geographical mobility - Same house 1 year ago (%) - White
Geographical mobility - Same house 1 year ago (%) - Black or African American
Geographical mobility - Same house 1 year ago (%) - Asian
Geographical mobility - Same house 1 year ago (%) - Hispanic or Latino
Geographical mobility - Same house 1 year ago (%) - American Indian and Alaska Native
Geographical mobility - Same house 1 year ago (%) - Multirace
Geographical mobility - Same house 1 year ago (%) - Other Race
Geographical mobility - Moved within same county (%)
Geographical mobility - Moved within same county (%) - White
Geographical mobility - Moved within same county (%) - Black or African American
Geographical mobility - Moved within same county (%) - Asian
Geographical mobility - Moved within same county (%) - Hispanic or Latino
Geographical mobility - Moved within same county (%) - American Indian and Alaska Native
Geographical mobility - Moved within same county (%) - Multirace
Geographical mobility - Moved within same county (%) - Other Race
Geographical mobility - Moved from different county within same state (%)
Geographical mobility - Moved from different county within same state (%) - White
Geographical mobility - Moved from different county within same state (%) - Black or African American
Geographical mobility - Moved from different county within same state (%) - Asian
Geographical mobility - Moved from different county within same state (%) - Hispanic or Latino
Geographical mobility - Moved from different county within same state (%) - American Indian and Alaska Native
Geographical mobility - Moved from different county within same state (%) - Multirace
Geographical mobility - Moved from different county within same state (%) - Other Race
Geographical mobility - Moved from different state (%)
Geographical mobility - Moved from different state (%) - White
Geographical mobility - Moved from different state (%) - Black or African American
Geographical mobility - Moved from different state (%) - Asian
Geographical mobility - Moved from different state (%) - Hispanic or Latino
Geographical mobility - Moved from different state (%) - American Indian and Alaska Native
Geographical mobility - Moved from different state (%) - Multirace
Geographical mobility - Moved from different state (%) - Other Race
Geographical mobility - Moved from abroad (%)
Geographical mobility - Moved from abroad (%) - White
Geographical mobility - Moved from abroad (%) - Black or African American
Geographical mobility - Moved from abroad (%) - Asian
Geographical mobility - Moved from abroad (%) - Hispanic or Latino
Geographical mobility - Moved from abroad (%) - American Indian and Alaska Native
Geographical mobility - Moved from abroad (%) - Multirace
Geographical mobility - Moved from abroad (%) - Other Race
Place of birth for the foreign-born population - Ireland (%)
Place of birth for the foreign-born population - Denmark (%)
Place of birth for the foreign-born population - Norway (%)
Place of birth for the foreign-born population - Sweden (%)
Place of birth for the foreign-born population - United Kingdom (%)
Place of birth for the foreign-born population - England (%)
Place of birth for the foreign-born population - Scotland (%)
Place of birth for the foreign-born population - Other Northern Europe (%)
Place of birth for the foreign-born population - Austria (%)
Place of birth for the foreign-born population - Belgium (%)
Place of birth for the foreign-born population - France (%)
Place of birth for the foreign-born population - Germany (%)
Place of birth for the foreign-born population - Netherlands (%)
Place of birth for the foreign-born population - Switzerland (%)
Place of birth for the foreign-born population - Other Western Europe (%)
Place of birth for the foreign-born population - Greece (%)
Place of birth for the foreign-born population - Italy (%)
Place of birth for the foreign-born population - Portugal (%)
Place of birth for the foreign-born population - Spain (%)
Place of birth for the foreign-born population - Other Southern Europe (%)
Place of birth for the foreign-born population - Albania (%)
Place of birth for the foreign-born population - Belarus (%)
Place of birth for the foreign-born population - Bosnia and Herzegovina (%)
Place of birth for the foreign-born population - Bulgaria (%)
Place of birth for the foreign-born population - Croatia (%)
Place of birth for the foreign-born population - Czechoslovakia (%)
Place of birth for the foreign-born population - Hungary (%)
Place of birth for the foreign-born population - Latvia (%)
Place of birth for the foreign-born population - Lithuania (%)
Place of birth for the foreign-born population - North Macedonia (Macedonia) (%)
Place of birth for the foreign-born population - Moldova (%)
Place of birth for the foreign-born population - Poland (%)
Place of birth for the foreign-born population - Romania (%)
Place of birth for the foreign-born population - Russia (%)
Place of birth for the foreign-born population - Serbia (%)
Place of birth for the foreign-born population - Ukraine (%)
Place of birth for the foreign-born population - Other Eastern Europe (%)
Place of birth for the foreign-born population - China (%)
Place of birth for the foreign-born population - Hong Kong (%)
Place of birth for the foreign-born population - Taiwan (%)
Place of birth for the foreign-born population - Japan (%)
Place of birth for the foreign-born population - Korea (%)
Place of birth for the foreign-born population - Other Eastern Asia (%)
Place of birth for the foreign-born population - Afghanistan (%)
Place of birth for the foreign-born population - Bangladesh (%)
Place of birth for the foreign-born population - India (%)
Place of birth for the foreign-born population - Iran (%)
Place of birth for the foreign-born population - Kazakhstan (%)
Place of birth for the foreign-born population - Nepal (%)
Place of birth for the foreign-born population - Pakistan (%)
Place of birth for the foreign-born population - Sri Lanka (%)
Place of birth for the foreign-born population - Uzbekistan (%)
Place of birth for the foreign-born population - Other South Central Asia (%)
Place of birth for the foreign-born population - Burma (%)
Place of birth for the foreign-born population - Cambodia (%)
Place of birth for the foreign-born population - Indonesia (%)
Place of birth for the foreign-born population - Laos (%)
Place of birth for the foreign-born population - Malaysia (%)
Place of birth for the foreign-born population - Philippines (%)
Place of birth for the foreign-born population - Singapore (%)
Place of birth for the foreign-born population - Thailand (%)
Place of birth for the foreign-born population - Vietnam (%)
Place of birth for the foreign-born population - Other South Eastern Asia (%)
Place of birth for the foreign-born population - Armenia (%)
Place of birth for the foreign-born population - Iraq (%)
Place of birth for the foreign-born population - Israel (%)
Place of birth for the foreign-born population - Jordan (%)
Place of birth for the foreign-born population - Kuwait (%)
Place of birth for the foreign-born population - Lebanon (%)
Place of birth for the foreign-born population - Saudi Arabia (%)
Place of birth for the foreign-born population - Syria (%)
Place of birth for the foreign-born population - Turkey (%)
Place of birth for the foreign-born population - Yemen (%)
Place of birth for the foreign-born population - Other Western Asia (%)
Place of birth for the foreign-born population - Eritrea (%)
Place of birth for the foreign-born population - Ethiopia (%)
Place of birth for the foreign-born population - Kenya (%)
Place of birth for the foreign-born population - Somalia (%)
Place of birth for the foreign-born population - Uganda (%)
Place of birth for the foreign-born population - Zimbabwe (%)
Place of birth for the foreign-born population - Other Eastern Africa (%)
Place of birth for the foreign-born population - Cameroon (%)
Place of birth for the foreign-born population - Congo (%)
Place of birth for the foreign-born population - Democratic Republic of Congo (Zaire) (%)
Place of birth for the foreign-born population - Other Middle Africa (%)
Place of birth for the foreign-born population - Egypt (%)
Place of birth for the foreign-born population - Morocco (%)
Place of birth for the foreign-born population - Sudan (%)
Place of birth for the foreign-born population - Other Northern Africa (%)
Place of birth for the foreign-born population - South Africa (%)
Place of birth for the foreign-born population - Other Southern Africa (%)
Place of birth for the foreign-born population - Cabo Verde (%)
Place of birth for the foreign-born population - Ghana (%)
Place of birth for the foreign-born population - Liberia (%)
Place of birth for the foreign-born population - Nigeria (%)
Place of birth for the foreign-born population - Senegal (%)
Place of birth for the foreign-born population - Sierra Leone (%)
Place of birth for the foreign-born population - Other Western Africa (%)
Place of birth for the foreign-born population - Australia (%)
Place of birth for the foreign-born population - New Zealand (%)
Place of birth for the foreign-born population - Fiji (%)
Place of birth for the foreign-born population - Micronesia (%)
Place of birth for the foreign-born population - Bahamas (%)
Place of birth for the foreign-born population - Barbados (%)
Place of birth for the foreign-born population - Cuba (%)
Place of birth for the foreign-born population - Dominica (%)
Place of birth for the foreign-born population - Dominican Republic (%)
Place of birth for the foreign-born population - Grenada (%)
Place of birth for the foreign-born population - Haiti (%)
Place of birth for the foreign-born population - Jamaica (%)
Place of birth for the foreign-born population - St. Vincent and the Grenadines (%)
Place of birth for the foreign-born population - Trinidad and Tobago (%)
Place of birth for the foreign-born population - West Indies (%)
Place of birth for the foreign-born population - Other Caribbean (%)
Place of birth for the foreign-born population - Belize (%)
Place of birth for the foreign-born population - Costa Rica (%)
Place of birth for the foreign-born population - El Salvador (%)
Place of birth for the foreign-born population - Guatemala (%)
Place of birth for the foreign-born population - Honduras (%)
Place of birth for the foreign-born population - Mexico (%)
Place of birth for the foreign-born population - Nicaragua (%)
Place of birth for the foreign-born population - Panama (%)
Place of birth for the foreign-born population - Other Central America (%)
Place of birth for the foreign-born population - Argentina (%)
Place of birth for the foreign-born population - Bolivia (%)
Place of birth for the foreign-born population - Brazil (%)
Place of birth for the foreign-born population - Chile (%)
Place of birth for the foreign-born population - Colombia (%)
Place of birth for the foreign-born population - Ecuador (%)
Place of birth for the foreign-born population - Guyana (%)
Place of birth for the foreign-born population - Peru (%)
Place of birth for the foreign-born population - Uruguay (%)
Place of birth for the foreign-born population - Venezuela (%)
Place of birth for the foreign-born population - Other South America (%)
Place of birth for the foreign-born population - Canada (%)
Place of birth for the foreign-born population - Other Northern America (%)
Place of birth for the foreign-born population - Other (%)
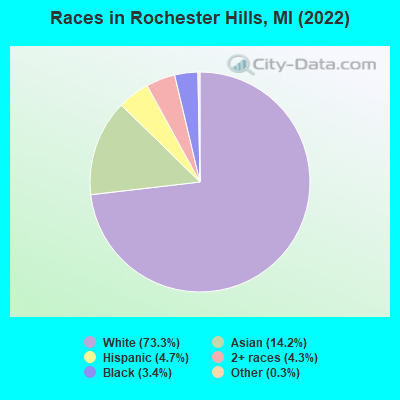
According to 2022 data, the most numerous races in Rochester Hills, MI are White alone (55,624 residents), Black alone (2,559 residents), and Hispanic (3,546 residents). 78.2% of Rochester Hills residents speak English at home. 19.7% of Rochester Hills, MI residents are foreign-born (11.5% born in Asia, 3.9% born in Europe, 2.6% born in Latin America), which is 69.5% greater than the foreign-born rate of 6.0% across the entire state of Michigan.
Race distribution in Rochester Hills
2000 2022
7,806,691 78.6% White alone 1,402,047 14.1% Black alone 323,877 3.3% Hispanic 175,311 1.8% Asian alone 163,487 1.6% Two or more races 53,421 0.5% American Indian alone 11,465 0.1% Other race alone 2,145 0.02% Native Hawaiian and Other
7,289,051 72.6% White alone 1,310,464 13.1% Black alone 572,405 5.7% Hispanic 450,031 4.5% Two or more races 335,732 3.3% Asian alone 45,217 0.5% Other race alone 29,011 0.3% American Indian alone 2,207 0.02% Native Hawaiian and Other
Income and house value in Rochester Hills Median household income in 2022 $101,092 White non-Hispanic householders$112,135 Black householders$152,532 Asian householders$136,250 Some other race householders$106,164 Two or more races householders$134,614 Hispanic or Latino race householdersMedian 2022 house value $399,969 White Non-Hispanic householders$503,638 Black or African American householders$168,596 American Indian or Alaska Native householders $468,125 Asian householders$252,177 Some other race householders$408,937 Two or more races householders$336,297 Hispanic or Latino householders
Median age by race in Rochester Hills
45.3 Median age for White residents44.4 47.2 33.8 Median age for Black or African American residents40.1 22.0 20.6 Median age for American Indian / Alaska Native residents-666,666,666.0 20.6 40.7 Median age for Asian residents40.9 40.6 -666,666,666.0 Median age for Native Hawaiian / Pacific Islander residents-666,666,666.0 -666,666,666.0 47.5 Median age for Other race residents47.4 48.3 26.1 Median age for Two or more races residents23.8 26.2 45.2 Median age for White alone residents44.3 47.2 33.9 Median age for Hispanic or Latino residents35.1 32.8
Owner/renter occupied households by race in Rochester Hills
House owners and renters - White residents 18,708 78.3% Owner occupied5,190 21.7% Renter occupiedHouse owners and renters - Black or African American residents 299 32.7% Owner occupied615 67.3% Renter occupiedHouse owners and renters - American Indian / Alaska Native residents 27 100.0% Owner occupiedHouse owners and renters - Asian residents 2,602 80.0% Owner occupied650 20.0% Renter occupiedHouse owners and renters - Other race residents 140 62.7% Owner occupied83 37.3% Renter occupiedHouse owners and renters - Two or more races residents 1,241 74.9% Owner occupied415 25.1% Renter occupiedHouse owners and renters - White alone residents 18,611 78.3% Owner occupied5,169 21.7% Renter occupiedHouse owners and renters - Hispanic or Latino residents 578 85.6% Owner occupied97 14.4% Renter occupied
Language usage in Rochester Hills
English speakers - Total 78.2% of residents of Rochester Hills speak English at home.
1.9% of residents speak Spanish at home 1,122 81.5% Speak English very well255 18.5% Speak English less than very well19.9% of residents speak other language at home 10,183 71.4% Speak English very well4,088 28.6% Speak English less than very well
English speakers - Born in the United States 92.9% of residents of Rochester Hills speak English at home.
2.3% of residents speak Spanish at home 257 100.0% Speak English very well4.8% of residents speak other language at home 445 84.8% Speak English very well80 15.2% Speak English less than very well
English speakers - Native, born elsewhere 23.0% of residents of Rochester Hills speak English at home.
77.0% of residents speak other language at home 203 81.9% Speak English very well45 18.1% Speak English less than very well
English speakers - Foreign-born 9.5% of residents of Rochester Hills speak English at home.
7.3% of residents speak Spanish at home 631 71.7% Speak English very well249 28.3% Speak English less than very well83.2% of residents speak other language at home 6,195 61.8% Speak English very well3,823 38.2% Speak English less than very well
White (Caucasian) - Speak only English Native:
94.1% (47,962)Foreign-born:
28.0% (930)
White (Caucasian) - Speak another language Native:
5.9% (3,001)Foreign-born:
72.0% (2,395)
Black or African American - Speak only English Native:
99.0% (2,201)Foreign-born:
0.6% (2)
Black or African American - Speak another language Native:
1.0% (23)Foreign-born:
100.0% (302)
American Indian / Alaska Native - Speak another language Native:
40.5% (27)Foreign-born:
100.0% (65)
Asian - Speak only English Native:
42.4% (923)Foreign-born:
3.1% (204)
Asian - Speak another language Native:
57.6% (1,253)Foreign-born:
96.9% (6,455)
Other race - Speak only English Native:
39.0% (203)Foreign-born:
0.7% (3)
Other race - Speak another language Native:
64.8% (337)Foreign-born:
100.0% (526)
Two or more races - Speak another language Native:
10.9% (413)Foreign-born:
100.0% (747)
White alone - Speak only English Native:
94.1% (47,776)Foreign-born:
27.3% (900)
White alone - Speak another language Native:
5.9% (3,001)Foreign-born:
72.7% (2,395)
Hispanic or Latino - Speak only English Native:
83.5% (1,056)Foreign-born:
3.3% (30)
Hispanic or Latino - Speak another language Native:
16.5% (209)Foreign-born:
96.7% (880)
Foreign-born residents in Rochester Hills 14,933 residents are foreign born (11.5% Asia , 3.9% Europe , 2.6% Latin America ).
This city:
19.7%Michigan:
6.9%
Marital status for residents in Rochester Hills Marital status - White (Caucasian) population 15 years and over
Males 26.8% Never married59.3% Now married0.0% Separated4.0% Widowed9.9% DivorcedFemales 25.6% Never married48.5% Now married0.9% Separated10.1% Widowed14.9% DivorcedWomen who gave birth in the past 12 months Now married:
76.3% (525)Unmarried:
23.7% (163)
Women who did not give birth in the past 12 months Now married:
45.3% (4,748)Unmarried:
54.7% (5,732)
Marital status - Black or African American population 15 years and over
Males 32.5% Never married60.5% Now married0.0% Separated0.0% Widowed7.0% DivorcedFemales 63.2% Never married21.0% Now married0.6% Separated9.4% Widowed5.8% DivorcedWomen who did not give birth in the past 12 months Now married:
18.4% (154)Unmarried:
81.6% (686)
Marital status - American Indian / Alaska Native population 15 years and over
Males 0.0% Never married100.0% Now married0.0% Separated0.0% Widowed0.0% DivorcedFemales 69.1% Never married20.0% Now married0.0% Separated0.0% Widowed10.9% DivorcedWomen who did not give birth in the past 12 months Now married:
21.6% (11)Unmarried:
78.4% (41)
Marital status - Asian population 15 years and over
Males 21.5% Never married76.7% Now married0.0% Separated0.0% Widowed1.9% DivorcedFemales 28.7% Never married60.3% Now married0.0% Separated7.1% Widowed3.8% DivorcedWomen who gave birth in the past 12 months Now married:
100.0% (94)Unmarried:
0.0% (0)
Women who did not give birth in the past 12 months Now married:
66.8% (1,778)Unmarried:
33.2% (886)
Marital status - Other race population 15 years and over
Males 45.8% Never married50.4% Now married0.0% Separated0.0% Widowed3.8% DivorcedFemales 12.0% Never married85.2% Now married0.0% Separated2.9% Widowed0.0% DivorcedWomen who gave birth in the past 12 months Now married:
100.0% (20)Unmarried:
0.0% (0)
Women who did not give birth in the past 12 months Now married:
85.4% (214)Unmarried:
14.6% (37)
Marital status - Two or more races population 15 years and over
Males 47.5% Never married47.8% Now married0.5% Separated0.0% Widowed4.2% DivorcedFemales 42.2% Never married43.1% Now married1.6% Separated1.6% Widowed11.4% DivorcedWomen who gave birth in the past 12 months Now married:
15.6% (24)Unmarried:
84.4% (128)
Women who did not give birth in the past 12 months Now married:
42.4% (560)Unmarried:
57.6% (761)
Marital status - White alone, not Hispanic / Latino population 15 years and over
Males 26.9% Never married59.3% Now married0.0% Separated3.8% Widowed10.0% DivorcedFemales 25.7% Never married48.4% Now married0.9% Separated10.1% Widowed14.9% DivorcedWomen who gave birth in the past 12 months Now married:
76.3% (525)Unmarried:
23.7% (163)
Women who did not give birth in the past 12 months Now married:
45.4% (4,748)Unmarried:
54.6% (5,711)
Marital status - Hispanic or Latino population 15 years and over
Males 42.9% Never married53.3% Now married0.5% Separated2.2% Widowed1.1% DivorcedFemales 38.1% Never married53.0% Now married0.0% Separated2.7% Widowed6.2% DivorcedWomen who gave birth in the past 12 months Now married:
66.7% (15)Unmarried:
33.3% (8)
Women who did not give birth in the past 12 months Now married:
50.0% (479)Unmarried:
50.0% (479)
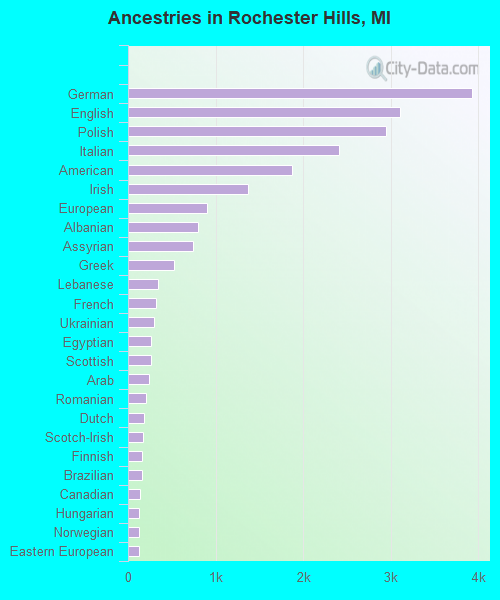
Ancestries in Rochester Hills
3,929 10.1% German3,110 8.0% English2,951 7.6% Polish2,416 6.2% Italian1,876 4.8% American1,377 3.5% Irish905 2.3% European803 2.1% Albanian745 1.9% Assyrian531 1.4% Greek348 0.9% Lebanese320 0.8% French298 0.8% Ukrainian266 0.7% Egyptian264 0.7% Scottish240 0.6% Arab207 0.5% Romanian183 0.5% Dutch172 0.4% Scotch-Irish162 0.4% Finnish159 0.4% Brazilian138 0.4% Canadian131 0.3% Hungarian130 0.3% Norwegian123 0.3% Eastern European122 0.3% Belgian116 0.3% French Canadian114 0.3% Jordanian109 0.3% Macedonian106 0.3% Slovak99 0.3% Portuguese95 0.2% British84 0.2% Armenian76 0.2% Czech74 0.2% Serbian71 0.2% Croatian65 0.2% Ghanaian62 0.2% Iranian61 0.2% Australian60 0.2% Moroccan58 0.1% African58 0.1% Welsh55 0.1% Northern European53 0.1% Russian46 0.1% Danish45 0.1% Palestinian44 0.1% Swiss42 0.1% Swedish39 0.1% Scandinavian28 0.07% Syrian28 0.07% Lithuanian24 0.06% Slavic23 0.06% Czechoslovakian20 0.05% Yugoslavian19 0.05% Austrian15 0.04% Maltese11 0.03% South African10 0.03% Iraqi9 0.02% Barbadian8 0.02% Nigerian6 0.02% Latvian5 0.01% Jamaican3 0.01% Liberian
Geographical mobility in Rochester Hills Same house 1 year ago 52,167 92.8% White (Caucasian)1,997 77.8% Black or African American61 61.8% American Indian / Alaska Native9,424 87.2% Asian929 86.3% Other race3,868 78.4% Two or more races51,968 92.9% White alone, not Hispanic / Latino3,181 90.8% Hispanic or LatinoMoved within same county 1,720 3.1% White / Caucasian190 7.4% Black or African American804 7.4% Asian27 2.5% Other race552 11.2% Two or more races1,720 3.1% White alone, not Hispanic / Latino94 2.7% Hispanic or LatinoMoved within same state 1,610 2.9% White / Caucasian299 11.7% Black or African American57 58.0% American Indian / Alaska Native168 1.6% Asian82 7.6% Other race367 7.4% Two or more races1,593 2.8% White alone, not Hispanic / Latino152 4.3% Hispanic or LatinoMoved from different state 198 0.4% White / Caucasian26 1.0% Black or African American147 1.4% Asian9 0.8% Other race47 0.9% Two or more races198 0.4% White alone, not Hispanic / Latino30 0.9% Hispanic or LatinoMoved from abroad 490 0.9% White22 0.9% Black or African American6 6.1% American Indian / Alaska Native282 2.6% Asian32 3.0% Other race49 1.0% Two or more races490 0.9% White alone, not Hispanic / Latino91 2.6% Hispanic or Latino
Children Nativity (place of birth) in Rochester Hills
Children under 6 years - Living with two parents Both parents native 3,128 100.0% NativeBoth parents foreign-born 390 75.7% Native125 24.3% Foreign-bornOne native, one foreign-born parent 491 100.0% NativeChildren under 6 years - Living with one parent Native parent 738 100.0% NativeForeign-born parent 196 100.0% NativeChildren 6 to 17 years - Living with two parents Both parents native 6,850 100.0% NativeBoth parents foreign-born 1,050 55.7% Native835 44.3% Foreign-bornOne native, one foreign-born parent 457 100.0% NativeChildren 6 to 17 years - Living with one parent Native parent 1,674 100.0% NativeForeign-born parent 81 50.0% Native81 50.0% Foreign-born
Place of birth for residents in Rochester Hills 8,715 Asia4,039 South Central Asia3,257 Eastern Asia2,973 Europe2,595 Americas2,012 Latin America1,838 China1,361 Eastern Europe1,070 South America915 Central America843 Western Asia741 Western Europe639 Southern Europe612 Africa582 Northern America557 South Eastern Asia356 Northern Africa231 Northern Europe135 Middle Africa69 Southern Africa37 Oceania37 Australia and New Zealand Subregion34 Western Africa27 Caribbean18 Eastern Africa3,580 India1,603 China1,259 Korea904 Mexico866 Brazil582 Canada549 Germany525 Iraq411 Italy339 Romania337 Philippines329 Egypt300 Ukraine268 Pakistan254 Poland204 Taiwan187 Albania159 Japan141 Argentina138 Vietnam131 Lebanon130 Bangladesh125 United Kingdom115 Austria97 England90 Greece61 Iran59 Saudi Arabia57 Czechoslovakia52 Syria47 Spain40 Portugal37 Australia36 North Macedonia (Macedonia)34 France34 Kuwait31 Hong Kong27 Morocco27 Singapore27 Russia26 Netherlands25 Malaysia24 Serbia21 Peru19 South Africa19 Ghana18 Cuba17 Venezuela16 Croatia15 Nigeria15 Bosnia and Herzegovina14 Jordan14 Colombia13 Zimbabwe13 Hungary13 Thailand11 Indonesia11 Lithuania11 El Salvador10 United Arab Emirates9 Barbados9 Scotland8 Belgium6 Laos6 Switzerland5 Tanzania
Grandparents responsible for own grandchildren in Rochester Hills
Grandparents (30 to 59 years) White / Caucasian 28 13.1% Responsible for grandchildren185 86.9% Not responsible for grandchildrenAsian 12 28.8% Responsible for grandchildren30 71.2% Not responsible for grandchildrenTwo or more races 48 100.0% Not responsible for grandchildrenWhite alone, not Hispanic / Latino 29 13.3% Responsible for grandchildren188 86.7% Not responsible for grandchildrenGrandparents (60 years and over) White / Caucasian 79 20.8% Responsible for grandchildren301 79.2% Not responsible for grandchildrenAsian 12 18.9% Responsible for grandchildren52 81.1% Not responsible for grandchildrenWhite alone, not Hispanic / Latino 82 21.3% Responsible for grandchildren304 78.7% Not responsible for grandchildren