Races in Riverview, Florida (FL) Detailed Stats
Data:
Races - White alone (%)
Races - White alone (% change since 2000)
Races - Black alone (%)
Races - Black alone (% change since 2000)
Races - American Indian alone (%)
Races - American Indian alone (% change since 2000)
Races - Asian alone (%)
Races - Asian alone (% change since 2000)
Races - Hispanic (%)
Races - Hispanic (% change since 2000)
Races - Native Hawaiian and Other Pacific Islander alone (%)
Races - Native Hawaiian and Other Pacific Islander alone (% change since 2000)
Races - Two or more races(%)
Races - Two or more races(% change since 2000)
Races - Other race alone (%)
Races - Other race alone (% change since 2000)
Racial diversity
Place of birth - Born in state of residence (%)
Place of birth - Born in state of residence (%) - White
Place of birth - Born in state of residence (%) - Black or African American
Place of birth - Born in state of residence (%) - Asian
Place of birth - Born in state of residence (%) - Hispanic or Latino
Place of birth - Born in state of residence (%) - American Indian and Alaska Native
Place of birth - Born in state of residence (%) - Multirace
Place of birth - Born in state of residence (%) - Other Race
Place of birth - Born in other state (%)
Place of birth - Born in other state (%) - White
Place of birth - Born in other state (%) - Black or African American
Place of birth - Born in other state (%) - Asian
Place of birth - Born in other state (%) - Hispanic or Latino
Place of birth - Born in other state (%) - American Indian and Alaska Native
Place of birth - Born in other state (%) - Multirace
Place of birth - Born in other state (%) - Other Race
Place of birth - Native, outside of US (%)
Place of birth - Native, outside of US (%) - White
Place of birth - Native, outside of US (%) - Black or African American
Place of birth - Native, outside of US (%) - Asian
Place of birth - Native, outside of US (%) - Hispanic or Latino
Place of birth - Native, outside of US (%) - American Indian and Alaska Native
Place of birth - Native, outside of US (%) - Multirace
Place of birth - Native, outside of US (%) - Other Race
Place of birth - Foreign born (%)
Place of birth - Foreign born (%) - White
Place of birth - Foreign born (%) - Black or African American
Place of birth - Foreign born (%) - Asian
Place of birth - Foreign born (%) - Hispanic or Latino
Place of birth - Foreign born (%) - American Indian and Alaska Native
Place of birth - Foreign born (%) - Multirace
Place of birth - Foreign born (%) - Other Race
Residents speaking English at home (%)
Residents speaking English at home - Born in the United States (%)
Residents speaking English at home - Native, born elsewhere (%)
Residents speaking English at home - Foreign born (%)
Residents speaking Spanish at home (%)
Residents speaking Spanish at home - Born in the United States (%)
Residents speaking Spanish at home - Native, born elsewhere (%)
Residents speaking Spanish at home - Foreign born (%)
Residents speaking other language at home (%)
Residents speaking other language at home - Born in the United States (%)
Residents speaking other language at home - Native, born elsewhere (%)
Residents speaking other language at home - Foreign born (%)
Marital status - Never married (%)
Marital status - Now married (%)
Marital status - Separated (%)
Marital status - Widowed (%)
Marital status - Divorced (%)
Ancestries Reported - Arab (%)
Ancestries Reported - Czech (%)
Ancestries Reported - Danish (%)
Ancestries Reported - Dutch (%)
Ancestries Reported - English (%)
Ancestries Reported - French (%)
Ancestries Reported - French Canadian (%)
Ancestries Reported - German (%)
Ancestries Reported - Greek (%)
Ancestries Reported - Hungarian (%)
Ancestries Reported - Irish (%)
Ancestries Reported - Italian (%)
Ancestries Reported - Lithuanian (%)
Ancestries Reported - Norwegian (%)
Ancestries Reported - Polish (%)
Ancestries Reported - Portuguese (%)
Ancestries Reported - Russian (%)
Ancestries Reported - Scotch-Irish (%)
Ancestries Reported - Scottish (%)
Ancestries Reported - Slovak (%)
Ancestries Reported - Subsaharan African (%)
Ancestries Reported - Swedish (%)
Ancestries Reported - Swiss (%)
Ancestries Reported - Ukrainian (%)
Ancestries Reported - United States (%)
Ancestries Reported - Welsh (%)
Ancestries Reported - West Indian (%)
Ancestries Reported - Other (%)
Geographical mobility - Same house 1 year ago (%)
Geographical mobility - Same house 1 year ago (%) - White
Geographical mobility - Same house 1 year ago (%) - Black or African American
Geographical mobility - Same house 1 year ago (%) - Asian
Geographical mobility - Same house 1 year ago (%) - Hispanic or Latino
Geographical mobility - Same house 1 year ago (%) - American Indian and Alaska Native
Geographical mobility - Same house 1 year ago (%) - Multirace
Geographical mobility - Same house 1 year ago (%) - Other Race
Geographical mobility - Moved within same county (%)
Geographical mobility - Moved within same county (%) - White
Geographical mobility - Moved within same county (%) - Black or African American
Geographical mobility - Moved within same county (%) - Asian
Geographical mobility - Moved within same county (%) - Hispanic or Latino
Geographical mobility - Moved within same county (%) - American Indian and Alaska Native
Geographical mobility - Moved within same county (%) - Multirace
Geographical mobility - Moved within same county (%) - Other Race
Geographical mobility - Moved from different county within same state (%)
Geographical mobility - Moved from different county within same state (%) - White
Geographical mobility - Moved from different county within same state (%) - Black or African American
Geographical mobility - Moved from different county within same state (%) - Asian
Geographical mobility - Moved from different county within same state (%) - Hispanic or Latino
Geographical mobility - Moved from different county within same state (%) - American Indian and Alaska Native
Geographical mobility - Moved from different county within same state (%) - Multirace
Geographical mobility - Moved from different county within same state (%) - Other Race
Geographical mobility - Moved from different state (%)
Geographical mobility - Moved from different state (%) - White
Geographical mobility - Moved from different state (%) - Black or African American
Geographical mobility - Moved from different state (%) - Asian
Geographical mobility - Moved from different state (%) - Hispanic or Latino
Geographical mobility - Moved from different state (%) - American Indian and Alaska Native
Geographical mobility - Moved from different state (%) - Multirace
Geographical mobility - Moved from different state (%) - Other Race
Geographical mobility - Moved from abroad (%)
Geographical mobility - Moved from abroad (%) - White
Geographical mobility - Moved from abroad (%) - Black or African American
Geographical mobility - Moved from abroad (%) - Asian
Geographical mobility - Moved from abroad (%) - Hispanic or Latino
Geographical mobility - Moved from abroad (%) - American Indian and Alaska Native
Geographical mobility - Moved from abroad (%) - Multirace
Geographical mobility - Moved from abroad (%) - Other Race
Place of birth for the foreign-born population - Ireland (%)
Place of birth for the foreign-born population - Denmark (%)
Place of birth for the foreign-born population - Norway (%)
Place of birth for the foreign-born population - Sweden (%)
Place of birth for the foreign-born population - United Kingdom (%)
Place of birth for the foreign-born population - England (%)
Place of birth for the foreign-born population - Scotland (%)
Place of birth for the foreign-born population - Other Northern Europe (%)
Place of birth for the foreign-born population - Austria (%)
Place of birth for the foreign-born population - Belgium (%)
Place of birth for the foreign-born population - France (%)
Place of birth for the foreign-born population - Germany (%)
Place of birth for the foreign-born population - Netherlands (%)
Place of birth for the foreign-born population - Switzerland (%)
Place of birth for the foreign-born population - Other Western Europe (%)
Place of birth for the foreign-born population - Greece (%)
Place of birth for the foreign-born population - Italy (%)
Place of birth for the foreign-born population - Portugal (%)
Place of birth for the foreign-born population - Spain (%)
Place of birth for the foreign-born population - Other Southern Europe (%)
Place of birth for the foreign-born population - Albania (%)
Place of birth for the foreign-born population - Belarus (%)
Place of birth for the foreign-born population - Bosnia and Herzegovina (%)
Place of birth for the foreign-born population - Bulgaria (%)
Place of birth for the foreign-born population - Croatia (%)
Place of birth for the foreign-born population - Czechoslovakia (%)
Place of birth for the foreign-born population - Hungary (%)
Place of birth for the foreign-born population - Latvia (%)
Place of birth for the foreign-born population - Lithuania (%)
Place of birth for the foreign-born population - North Macedonia (Macedonia) (%)
Place of birth for the foreign-born population - Moldova (%)
Place of birth for the foreign-born population - Poland (%)
Place of birth for the foreign-born population - Romania (%)
Place of birth for the foreign-born population - Russia (%)
Place of birth for the foreign-born population - Serbia (%)
Place of birth for the foreign-born population - Ukraine (%)
Place of birth for the foreign-born population - Other Eastern Europe (%)
Place of birth for the foreign-born population - China (%)
Place of birth for the foreign-born population - Hong Kong (%)
Place of birth for the foreign-born population - Taiwan (%)
Place of birth for the foreign-born population - Japan (%)
Place of birth for the foreign-born population - Korea (%)
Place of birth for the foreign-born population - Other Eastern Asia (%)
Place of birth for the foreign-born population - Afghanistan (%)
Place of birth for the foreign-born population - Bangladesh (%)
Place of birth for the foreign-born population - India (%)
Place of birth for the foreign-born population - Iran (%)
Place of birth for the foreign-born population - Kazakhstan (%)
Place of birth for the foreign-born population - Nepal (%)
Place of birth for the foreign-born population - Pakistan (%)
Place of birth for the foreign-born population - Sri Lanka (%)
Place of birth for the foreign-born population - Uzbekistan (%)
Place of birth for the foreign-born population - Other South Central Asia (%)
Place of birth for the foreign-born population - Burma (%)
Place of birth for the foreign-born population - Cambodia (%)
Place of birth for the foreign-born population - Indonesia (%)
Place of birth for the foreign-born population - Laos (%)
Place of birth for the foreign-born population - Malaysia (%)
Place of birth for the foreign-born population - Philippines (%)
Place of birth for the foreign-born population - Singapore (%)
Place of birth for the foreign-born population - Thailand (%)
Place of birth for the foreign-born population - Vietnam (%)
Place of birth for the foreign-born population - Other South Eastern Asia (%)
Place of birth for the foreign-born population - Armenia (%)
Place of birth for the foreign-born population - Iraq (%)
Place of birth for the foreign-born population - Israel (%)
Place of birth for the foreign-born population - Jordan (%)
Place of birth for the foreign-born population - Kuwait (%)
Place of birth for the foreign-born population - Lebanon (%)
Place of birth for the foreign-born population - Saudi Arabia (%)
Place of birth for the foreign-born population - Syria (%)
Place of birth for the foreign-born population - Turkey (%)
Place of birth for the foreign-born population - Yemen (%)
Place of birth for the foreign-born population - Other Western Asia (%)
Place of birth for the foreign-born population - Eritrea (%)
Place of birth for the foreign-born population - Ethiopia (%)
Place of birth for the foreign-born population - Kenya (%)
Place of birth for the foreign-born population - Somalia (%)
Place of birth for the foreign-born population - Uganda (%)
Place of birth for the foreign-born population - Zimbabwe (%)
Place of birth for the foreign-born population - Other Eastern Africa (%)
Place of birth for the foreign-born population - Cameroon (%)
Place of birth for the foreign-born population - Congo (%)
Place of birth for the foreign-born population - Democratic Republic of Congo (Zaire) (%)
Place of birth for the foreign-born population - Other Middle Africa (%)
Place of birth for the foreign-born population - Egypt (%)
Place of birth for the foreign-born population - Morocco (%)
Place of birth for the foreign-born population - Sudan (%)
Place of birth for the foreign-born population - Other Northern Africa (%)
Place of birth for the foreign-born population - South Africa (%)
Place of birth for the foreign-born population - Other Southern Africa (%)
Place of birth for the foreign-born population - Cabo Verde (%)
Place of birth for the foreign-born population - Ghana (%)
Place of birth for the foreign-born population - Liberia (%)
Place of birth for the foreign-born population - Nigeria (%)
Place of birth for the foreign-born population - Senegal (%)
Place of birth for the foreign-born population - Sierra Leone (%)
Place of birth for the foreign-born population - Other Western Africa (%)
Place of birth for the foreign-born population - Australia (%)
Place of birth for the foreign-born population - New Zealand (%)
Place of birth for the foreign-born population - Fiji (%)
Place of birth for the foreign-born population - Micronesia (%)
Place of birth for the foreign-born population - Bahamas (%)
Place of birth for the foreign-born population - Barbados (%)
Place of birth for the foreign-born population - Cuba (%)
Place of birth for the foreign-born population - Dominica (%)
Place of birth for the foreign-born population - Dominican Republic (%)
Place of birth for the foreign-born population - Grenada (%)
Place of birth for the foreign-born population - Haiti (%)
Place of birth for the foreign-born population - Jamaica (%)
Place of birth for the foreign-born population - St. Vincent and the Grenadines (%)
Place of birth for the foreign-born population - Trinidad and Tobago (%)
Place of birth for the foreign-born population - West Indies (%)
Place of birth for the foreign-born population - Other Caribbean (%)
Place of birth for the foreign-born population - Belize (%)
Place of birth for the foreign-born population - Costa Rica (%)
Place of birth for the foreign-born population - El Salvador (%)
Place of birth for the foreign-born population - Guatemala (%)
Place of birth for the foreign-born population - Honduras (%)
Place of birth for the foreign-born population - Mexico (%)
Place of birth for the foreign-born population - Nicaragua (%)
Place of birth for the foreign-born population - Panama (%)
Place of birth for the foreign-born population - Other Central America (%)
Place of birth for the foreign-born population - Argentina (%)
Place of birth for the foreign-born population - Bolivia (%)
Place of birth for the foreign-born population - Brazil (%)
Place of birth for the foreign-born population - Chile (%)
Place of birth for the foreign-born population - Colombia (%)
Place of birth for the foreign-born population - Ecuador (%)
Place of birth for the foreign-born population - Guyana (%)
Place of birth for the foreign-born population - Peru (%)
Place of birth for the foreign-born population - Uruguay (%)
Place of birth for the foreign-born population - Venezuela (%)
Place of birth for the foreign-born population - Other South America (%)
Place of birth for the foreign-born population - Canada (%)
Place of birth for the foreign-born population - Other Northern America (%)
Place of birth for the foreign-born population - Other (%)
Latest news about races in Riverview, FL collected exclusively by city-data.com from local newspapers, TV, and radio stations
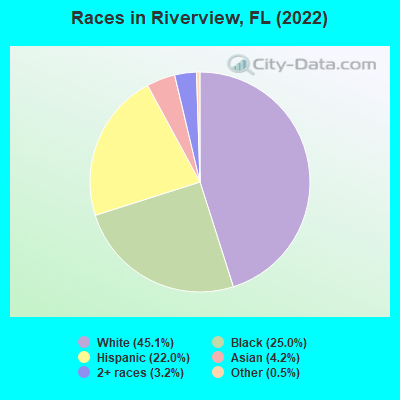
According to 2022 data, the most numerous races in Riverview, FL are White alone (51,573 residents), Hispanic (25,137 residents), and Black alone (28,640 residents). 77.6% of Riverview residents speak English at home. 13.9% of Riverview, FL residents are foreign-born (9.1% born in Latin America, 2.6% born in Asia), which is 51.5% less than the foreign-born rate of 21.0% across the entire state of Florida.
Race distribution in Riverview
2000 2022
10,458,509 65.4% White alone 2,682,715 16.8% Hispanic 2,264,268 14.2% Black alone 261,693 1.6% Asian alone 236,954 1.5% Two or more races 42,358 0.3% American Indian alone 28,994 0.2% Other race alone 6,887 0.04% Native Hawaiian and Other
11,309,403 50.8% White alone 6,025,039 27.1% Hispanic 3,241,015 14.6% Black alone 861,630 3.9% Two or more races 623,692 2.8% Asian alone 152,054 0.7% Other race alone 22,504 0.1% American Indian alone 9,486 0.04% Native Hawaiian and Other
Income and house value in Riverview Median household income in 2022 $94,042 White non-Hispanic householders$99,929 Black householders$86,942 Asian householders$109,241 Some other race householders$92,837 Two or more races householders$93,100 Hispanic or Latino race householdersMedian 2022 house value $447,661 White Non-Hispanic householders$473,113 Black or African American householders$392,227 American Indian or Alaska Native householders $239,868 Asian householders$374,794 Some other race householders$479,388 Two or more races householders$408,264 Hispanic or Latino householders
Median age by race in Riverview
37.6 Median age for White residents37.0 38.1 29.4 Median age for Black or African American residents25.5 31.9 -666,666,666.0 Median age for American Indian / Alaska Native residents-666,666,666.0 -666,666,666.0 32.8 Median age for Asian residents32.1 33.9 -666,666,666.0 Median age for Native Hawaiian / Pacific Islander residents-666,666,666.0 -666,666,666.0 36.0 Median age for Other race residents36.8 29.3 26.9 Median age for Two or more races residents13.8 32.4 37.8 Median age for White alone residents37.3 38.3 28.2 Median age for Hispanic or Latino residents22.4 32.5
Owner/renter occupied households by race in Riverview
House owners and renters - White residents 18,203 84.5% Owner occupied3,342 15.5% Renter occupiedHouse owners and renters - Black or African American residents 5,569 66.9% Owner occupied2,750 33.1% Renter occupiedHouse owners and renters - American Indian / Alaska Native residents 102 58.2% Owner occupied73 41.8% Renter occupiedHouse owners and renters - Asian residents 1,052 63.3% Owner occupied610 36.7% Renter occupiedHouse owners and renters - Other race residents 853 55.7% Owner occupied678 44.3% Renter occupiedHouse owners and renters - Two or more races residents 3,050 54.1% Owner occupied2,591 45.9% Renter occupiedHouse owners and renters - White alone residents 16,699 83.8% Owner occupied3,239 16.2% Renter occupiedHouse owners and renters - Hispanic or Latino residents 4,456 56.7% Owner occupied3,408 43.3% Renter occupied
Language usage in Riverview
English speakers - Total 77.6% of residents of Riverview speak English at home.
11.7% of residents speak Spanish at home 8,621 70.7% Speak English very well3,573 29.3% Speak English less than very well10.7% of residents speak other language at home 7,432 66.3% Speak English very well3,785 33.7% Speak English less than very well
English speakers - Born in the United States 91.6% of residents of Riverview speak English at home.
6.9% of residents speak Spanish at home 2,978 96.3% Speak English very well116 3.7% Speak English less than very well1.4% of residents speak other language at home 597 93.4% Speak English very well42 6.6% Speak English less than very well
English speakers - Native, born elsewhere 32.5% of residents of Riverview speak English at home.
66.2% of residents speak Spanish at home 1,504 55.9% Speak English very well1,187 44.1% Speak English less than very well1.3% of residents speak other language at home 52 100.0% Speak English very well
English speakers - Foreign-born 14.6% of residents of Riverview speak English at home.
28.9% of residents speak Spanish at home 2,642 55.2% Speak English very well2,147 44.8% Speak English less than very well56.5% of residents speak other language at home 5,632 60.1% Speak English very well3,743 39.9% Speak English less than very well
White (Caucasian) - Speak only English Native:
97.1% (49,661)Foreign-born:
15.3% (300)
White (Caucasian) - Speak another language Native:
2.9% (1,501)Foreign-born:
84.7% (1,662)
Black or African American - Speak only English Native:
94.9% (19,540)Foreign-born:
19.2% (1,273)
Black or African American - Speak another language Native:
5.1% (1,058)Foreign-born:
80.8% (5,365)
Asian - Speak only English Native:
67.3% (615)Foreign-born:
11.9% (442)
Asian - Speak another language Native:
32.7% (299)Foreign-born:
88.1% (3,278)
Other race - Speak only English Native:
27.9% (747)Foreign-born:
4.9% (99)
Other race - Speak another language Native:
72.1% (1,933)Foreign-born:
95.1% (1,909)
Two or more races - Speak only English Native:
64.4% (7,977)Foreign-born:
13.5% (304)
Two or more races - Speak another language Native:
35.6% (4,405)Foreign-born:
86.5% (1,950)
White alone - Speak only English Native:
99.0% (46,927)Foreign-born:
30.4% (300)
White alone - Speak another language Native:
1.0% (489)Foreign-born:
69.6% (686)
Hispanic or Latino - Speak only English Native:
56.4% (9,434)Foreign-born:
2.4% (116)
Hispanic or Latino - Speak another language Native:
43.6% (7,299)Foreign-born:
97.6% (4,692)
Foreign-born residents in Riverview 14,640 residents are foreign born (9.1% Latin America , 2.6% Asia ).
This city:
13.9%Florida:
21.1%
Marital status for residents in Riverview Marital status - White (Caucasian) population 15 years and over
Males 29.0% Never married56.9% Now married0.0% Separated4.2% Widowed9.9% DivorcedFemales 25.2% Never married50.3% Now married1.0% Separated9.7% Widowed13.8% DivorcedWomen who gave birth in the past 12 months Now married:
86.0% (191)Unmarried:
14.0% (31)
Women who did not give birth in the past 12 months Now married:
52.8% (7,313)Unmarried:
47.2% (6,544)
Marital status - Black or African American population 15 years and over
Males 38.0% Never married56.0% Now married0.8% Separated4.1% Widowed1.0% DivorcedFemales 44.4% Never married37.8% Now married1.4% Separated12.3% Widowed4.1% DivorcedWomen who gave birth in the past 12 months Now married:
85.6% (826)Unmarried:
14.4% (139)
Women who did not give birth in the past 12 months Now married:
29.3% (2,786)Unmarried:
70.7% (6,719)
Marital status - American Indian / Alaska Native population 15 years and over
Males 36.6% Never married53.6% Now married8.9% Separated0.0% Widowed0.9% DivorcedFemales 0.0% Never married87.5% Now married12.5% Separated0.0% Widowed0.0% DivorcedWomen who did not give birth in the past 12 months Now married:
100.0% (112)Unmarried:
0.0% (0)
Marital status - Asian population 15 years and over
Males 23.5% Never married68.3% Now married0.0% Separated6.4% Widowed1.8% DivorcedFemales 18.0% Never married61.7% Now married0.0% Separated7.7% Widowed12.7% DivorcedWomen who gave birth in the past 12 months Now married:
100.0% (23)Unmarried:
0.0% (0)
Women who did not give birth in the past 12 months Now married:
71.7% (767)Unmarried:
28.3% (303)
Marital status - Other race population 15 years and over
Males 31.4% Never married60.6% Now married0.0% Separated4.3% Widowed3.7% DivorcedFemales 37.9% Never married48.3% Now married1.7% Separated3.2% Widowed8.8% DivorcedWomen who gave birth in the past 12 months Now married:
100.0% (55)Unmarried:
0.0% (0)
Women who did not give birth in the past 12 months Now married:
48.2% (808)Unmarried:
51.8% (870)
Marital status - Two or more races population 15 years and over
Males 33.5% Never married55.1% Now married0.0% Separated2.3% Widowed9.2% DivorcedFemales 37.3% Never married35.4% Now married2.1% Separated5.5% Widowed19.7% DivorcedWomen who gave birth in the past 12 months Now married:
71.2% (129)Unmarried:
28.8% (52)
Women who did not give birth in the past 12 months Now married:
42.1% (2,077)Unmarried:
57.9% (2,853)
Marital status - White alone, not Hispanic / Latino population 15 years and over
Males 27.0% Never married59.2% Now married0.0% Separated2.7% Widowed11.0% DivorcedFemales 25.3% Never married49.0% Now married0.7% Separated10.4% Widowed14.6% DivorcedWomen who gave birth in the past 12 months Now married:
86.0% (191)Unmarried:
14.0% (31)
Women who did not give birth in the past 12 months Now married:
52.4% (6,850)Unmarried:
47.6% (6,211)
Marital status - Hispanic or Latino population 15 years and over
Males 37.4% Never married51.2% Now married1.1% Separated7.6% Widowed2.7% DivorcedFemales 35.1% Never married45.8% Now married3.3% Separated3.6% Widowed12.3% DivorcedWomen who gave birth in the past 12 months Now married:
68.4% (258)Unmarried:
31.6% (119)
Women who did not give birth in the past 12 months Now married:
49.8% (3,159)Unmarried:
50.2% (3,182)
Ancestries in Riverview
3,535 6.6% American2,610 4.9% English2,441 4.6% Irish2,345 4.4% German2,036 3.8% Italian1,160 2.2% Haitian770 1.4% Jamaican617 1.2% Afghan511 1.0% European455 0.8% Scottish357 0.7% Polish244 0.5% Belizean220 0.4% Nigerian216 0.4% Egyptian210 0.4% French Canadian190 0.4% African184 0.3% British181 0.3% West Indian173 0.3% Palestinian173 0.3% French172 0.3% Brazilian142 0.3% Eastern European124 0.2% Canadian101 0.2% Greek99 0.2% Scotch-Irish98 0.2% Swedish81 0.2% Scandinavian79 0.1% Turkish78 0.1% Trinidadian and Tobagonian77 0.1% Northern European64 0.1% Guyanese64 0.1% Dutch55 0.1% British West Indian54 0.1% Australian49 0.09% Norwegian44 0.08% Moroccan42 0.08% Bulgarian39 0.07% Danish36 0.07% Israeli36 0.07% Hungarian34 0.06% Ukrainian33 0.06% Lithuanian33 0.06% Zimbabwean32 0.06% German Russian31 0.06% Ethiopian29 0.05% Russian26 0.05% Sierra Leonean24 0.04% Lebanese23 0.04% Armenian23 0.04% Portuguese21 0.04% Croatian20 0.04% Barbadian20 0.04% Finnish17 0.03% Swiss10 0.02% Welsh10 0.02% Yugoslavian8 0.01% Slovak8 0.01% Czech8 0.01% Syrian5 0.01% Iranian4 0.01% Serbian
Geographical mobility in Riverview Same house 1 year ago 48,032 85.2% White (Caucasian)21,055 91.5% Black or African American188 66.8% American Indian / Alaska Native2,379 67.7% Asian5,184 83.4% Other race16,008 86.1% Two or more races43,734 85.1% White alone, not Hispanic / Latino23,341 86.9% Hispanic or LatinoMoved within same county 2,960 5.3% White / Caucasian1,004 4.4% Black or African American67 23.9% American Indian / Alaska Native312 8.9% Asian566 9.1% Other race1,447 7.8% Two or more races2,533 4.9% White alone, not Hispanic / Latino1,748 6.5% Hispanic or LatinoMoved within same state 741 1.3% White / Caucasian586 2.5% Black or African American11 3.7% American Indian / Alaska Native11 0.3% Asian33 0.5% Other race378 2.0% Two or more races609 1.2% White alone, not Hispanic / Latino656 2.4% Hispanic or LatinoMoved from different state 4,613 8.2% White / Caucasian548 2.4% Black or African American135 3.8% Asian125 2.0% Other race603 3.2% Two or more races4,529 8.8% White alone, not Hispanic / Latino805 3.0% Hispanic or LatinoMoved from abroad 271 1.2% Black or African American481 13.7% Asian174 2.8% Other race360 1.3% Hispanic or Latino
Children Nativity (place of birth) in Riverview
Children under 6 years - Living with two parents Both parents native 6,087 100.0% NativeBoth parents foreign-born 1,140 93.4% Native80 6.6% Foreign-bornOne native, one foreign-born parent 395 100.0% NativeChildren under 6 years - Living with one parent Native parent 2,653 100.0% NativeForeign-born parent 663 88.5% Native86 11.5% Foreign-bornChildren 6 to 17 years - Living with two parents Both parents native 8,911 100.0% NativeBoth parents foreign-born 889 45.4% Native1,071 54.6% Foreign-bornOne native, one foreign-born parent 1,238 74.9% Native415 25.1% Foreign-bornChildren 6 to 17 years - Living with one parent Native parent 7,055 100.0% NativeForeign-born parent 510 55.4% Native411 44.6% Foreign-born
Place of birth for residents in Riverview
Grandparents responsible for own grandchildren in Riverview
Grandparents (30 to 59 years) White / Caucasian 86 22.0% Responsible for grandchildren306 78.0% Not responsible for grandchildrenBlack or African American 51 33.7% Responsible for grandchildren100 66.3% Not responsible for grandchildrenAsian 68 100.0% Not responsible for grandchildrenOther race 36 71.5% Responsible for grandchildren14 28.5% Not responsible for grandchildrenTwo or more races 28 100.0% Not responsible for grandchildrenWhite alone, not Hispanic / Latino 104 36.9% Responsible for grandchildren179 63.1% Not responsible for grandchildrenHispanic or Latino 75 40.9% Responsible for grandchildren109 59.1% Not responsible for grandchildrenGrandparents (60 years and over) White / Caucasian 482 41.9% Responsible for grandchildren669 58.1% Not responsible for grandchildrenBlack or African American 16 3.7% Responsible for grandchildren408 96.3% Not responsible for grandchildrenAsian 8 8.5% Responsible for grandchildren90 91.5% Not responsible for grandchildrenOther race 13 3.2% Responsible for grandchildren382 96.8% Not responsible for grandchildrenTwo or more races 7 4.0% Responsible for grandchildren168 96.0% Not responsible for grandchildrenWhite alone, not Hispanic / Latino 472 40.3% Responsible for grandchildren700 59.7% Not responsible for grandchildrenHispanic or Latino 49 7.4% Responsible for grandchildren623 92.6% Not responsible for grandchildren