Races in Ridgefield, New Jersey (NJ) Detailed Stats
Ancestries, Foreign-born residents, place of birth
Settings
X


Recent posts about races in Ridgefield, New Jersey on our local forum with over 2,400,000 registered users:
 | Suburban town houses (83 replies) |
| Moving from greater Philly area suburb to Northern NJ (72 replies) |
| opinions on Colt's Neck (69 replies) |
| Recent Trip to NE New Jersey (29 replies) |
| New family, owning a house, moving out of New York and what to expect (41 replies) |
| Possible near-term move to NJ - which towns should I be considering based on these criteria? (17 replies) |
Latest news about races in Ridgefield, NJ collected exclusively by city-data.com from local newspapers, TV, and radio stations
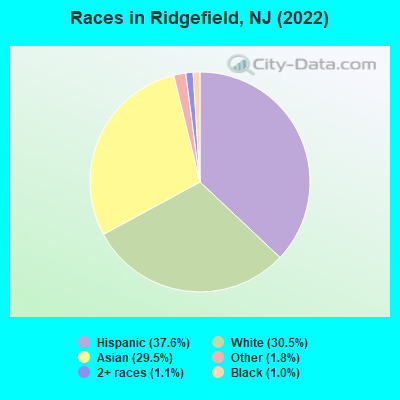
According to 2022 data, the most numerous races in Ridgefield, NJ are White alone (3,495 residents), Hispanic (4,310 residents), and Black alone (116 residents). 36.6% of Ridgefield residents speak English at home. 45.3% of Ridgefield, NJ residents are foreign-born (26.6% born in Asia, 11.6% born in Latin America, 5.1% born in Europe), which is 49.3% greater than the foreign-born rate of 23.0% across the entire state of New Jersey.
Race distribution in Ridgefield
2000
2022

- 7,18966.4%White alone
- 1,88117.4%Asian alone
- 1,49413.8%Hispanic
- 1581.5%Two or more races
- 710.7%Black alone
- 270.2%Other race alone
- 60.06%American Indian alone
- 40.04%Native Hawaiian and Other
Pacific Islander alone

-
- 4,31037.6%Hispanic
- 3,49530.5%White alone
- 3,37729.5%Asian alone
- 2091.8%Other race alone
- 1241.1%Two or more races
- 1161.0%Black alone
2000
2022
-
- 5,557,20966.0%White alone
- 1,117,19113.3%Hispanic
- 1,096,17113.0%Black alone
- 477,0125.7%Asian alone
- 133,6891.6%Two or more races
- 19,5650.2%Other race alone
- 11,3380.1%American Indian alone
- 2,1750.03%Native Hawaiian and Other
Pacific Islander alone

-
- 4,766,47651.5%White alone
- 2,028,47021.9%Hispanic
- 1,111,63212.0%Black alone
- 923,54610.0%Asian alone
- 332,2373.6%Two or more races
- 89,8471.0%Other race alone
- 8,5570.09%American Indian alone
- 9340.01%Native Hawaiian and Other
Pacific Islander alone

Income and house value in Ridgefield
- Median household income in 2022
- $92,906White non-Hispanic householders
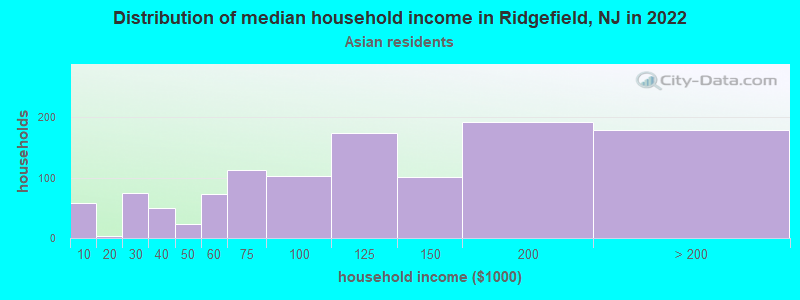
- $110,586Asian householders
- $116,880Two or more races householders
- $108,391Hispanic or Latino race householders
- Median 2022 house value
- $557,811White Non-Hispanic householders
- $600,102Asian householders
- $468,741Some other race householders
- $558,756Two or more races householders
- $612,624Hispanic or Latino householders
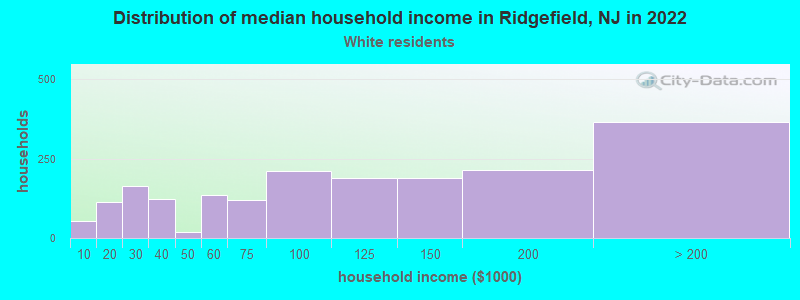
Household income for White non-Hispanic householders
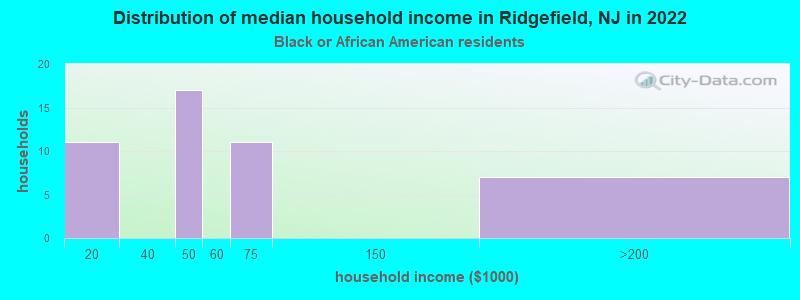
Household income for Black householders
Household income for Asian householders
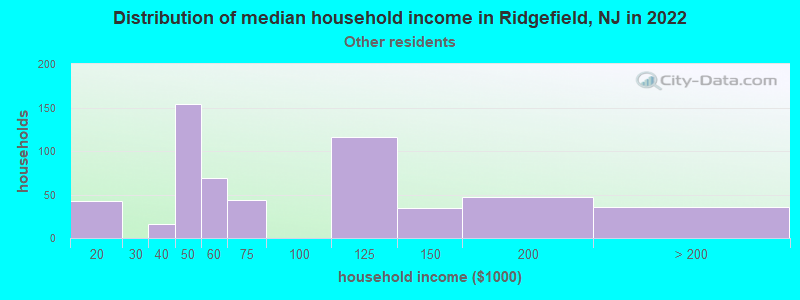
Household income for Some other race householders
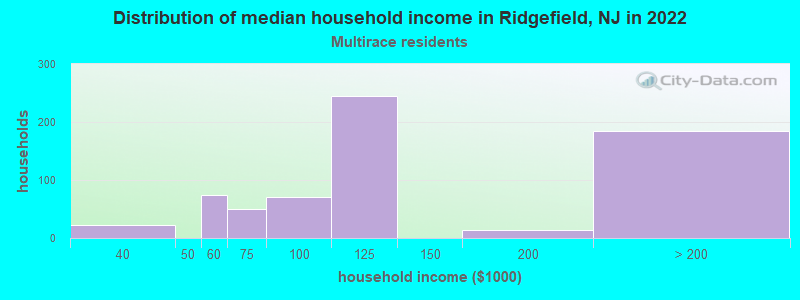
Household income for Two or more races householders
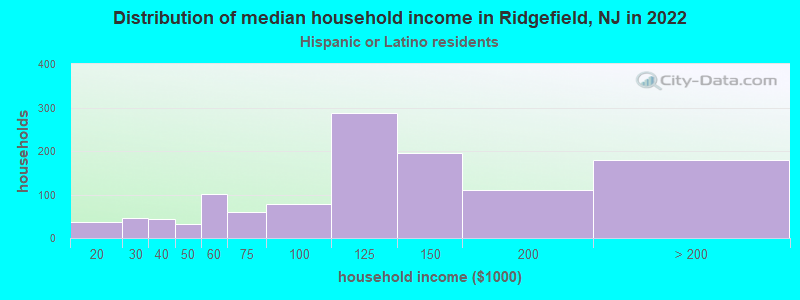
Household income for Hispanic or Latino race householders
Median age by race in Ridgefield
- 50.0Median age for White residents
- 49.6Males
- 49.2Females
- 56.6Median age for Black or African American residents
- 59.6Males
- 55.6Females
- -766,197,182.3Median age for American Indian / Alaska Native residents
- -686,322,685.6Males
- -753,722,794.2Females
- 43.5Median age for Asian residents
- 44.4Males
- 43.4Females
- -510,460,250.5Median age for Native Hawaiian / Pacific Islander residents
- -514,767,932.0Males
- -713,070,378.3Females
- 35.7Median age for Other race residents
- 28.6Males
- 35.5Females
- 27.5Median age for Two or more races residents
- 28.2Males
- 25.3Females
- 55.7Median age for White alone residents
- 53.3Males
- 58.6Females
- 32.3Median age for Hispanic or Latino residents
- 26.3Males
- 35.0Females
Owner/renter occupied households by race in Ridgefield
- House owners and renters - White residents
- 1,00253.4%Owner occupied
- 87546.6%Renter occupied
- House owners and renters - Black or African American residents
- 1840.4%Owner occupied
- 2759.6%Renter occupied
- House owners and renters - Asian residents
- 55648.2%Owner occupied
- 59751.8%Renter occupied
- House owners and renters - Other race residents
- 21840.4%Owner occupied
- 32159.6%Renter occupied
- House owners and renters - Two or more races residents
- 15323.7%Owner occupied
- 49376.3%Renter occupied
- House owners and renters - White alone residents
- 88654.8%Owner occupied
- 73145.2%Renter occupied
- House owners and renters - Hispanic or Latino residents
- 37530.5%Owner occupied
- 85269.5%Renter occupied
Language usage in Ridgefield
- English speakers - Total
- 36.6% of residents of Ridgefield speak English at home.
- 26.8% of residents speak Spanish at home
- 1,97866.1%Speak English very well
- 1,01633.9%Speak English less than very well
- 37.9% of residents speak other language at home
- 1,73941.1%Speak English very well
- 2,49658.9%Speak English less than very well
- English speakers - Born in the United States
- 56.5% of residents of Ridgefield speak English at home.
- 39.4% of residents speak Spanish at home
- 82795.1%Speak English very well
- 434.9%Speak English less than very well
- 7.7% of residents speak other language at home
- 11265.9%Speak English very well
- 5834.1%Speak English less than very well
- English speakers - Native, born elsewhere
- 44.3% of residents of Ridgefield speak English at home.
- 28.1% of residents speak Spanish at home
- 4976.6%Speak English very well
- 1523.4%Speak English less than very well
- 17.5% of residents speak other language at home
- 40100.0%Speak English very well
- English speakers - Foreign-born
- 5.7% of residents of Ridgefield speak English at home.
- 25.4% of residents speak Spanish at home
- 53440.7%Speak English very well
- 77859.3%Speak English less than very well
- 69.4% of residents speak other language at home
- 1,18933.1%Speak English very well
- 2,39966.9%Speak English less than very well
White (Caucasian) - Speak only English
| Native: | 73.7% (2,598) |
| Foreign-born: | 15.0% (148) |
White (Caucasian) - Speak another language
| Native: | 22.4% (789) |
| Foreign-born: | 83.5% (824) |
Black or African American - Speak only English
| Native: | 99.9% (41) |
| Foreign-born: | 66.1% (48) |
Asian - Speak only English
| Native: | 16.6% (82) |
| Foreign-born: | 1.5% (43) |
Asian - Speak another language
| Native: | 82.0% (402) |
| Foreign-born: | 98.9% (2,803) |
Other race - Speak only English
| Native: | 28.0% (219) |
| Foreign-born: | 5.6% (41) |
Other race - Speak another language
| Native: | 70.6% (554) |
| Foreign-born: | 94.3% (695) |
Two or more races - Speak another language
| Native: | 34.0% (550) |
| Foreign-born: | 100.0% (618) |
White alone - Speak only English
| Native: | 88.2% (2,360) |
| Foreign-born: | 19.1% (151) |
White alone - Speak another language
| Native: | 11.6% (309) |
| Foreign-born: | 81.0% (640) |
Hispanic or Latino - Speak only English
| Native: | 42.4% (1,176) |
| Foreign-born: | 3.8% (52) |
Hispanic or Latino - Speak another language
| Native: | 56.9% (1,580) |
| Foreign-born: | 95.4% (1,301) |
Foreign-born residents in Ridgefield
5,197 residents are foreign born (26.6% Asia, 11.6% Latin America, 5.1% Europe).
| This city: | 45.3% |
| New Jersey: | 23.2% |


Marital status for residents in Ridgefield
Marital status - White (Caucasian) population 15 years and over
- Males
- 42.4%Never married
- 48.3%Now married
- 0.0%Separated
- 2.9%Widowed
- 6.4%Divorced
- Females
- 33.3%Never married
- 38.9%Now married
- 3.1%Separated
- 8.6%Widowed
- 16.1%Divorced
Women who did not give birth in the past 12 months
| Now married: | 27.1% (285) |
| Unmarried: | 72.9% (768) |
Marital status - Black or African American population 15 years and over
- Males
- 49.4%Never married
- 36.4%Now married
- 1.3%Separated
- 13.0%Widowed
- 0.0%Divorced
- Females
- 0.0%Never married
- 68.8%Now married
- 0.0%Separated
- 31.2%Widowed
- 0.0%Divorced
Women who did not give birth in the past 12 months
| Now married: | 100.0% (6) |
| Unmarried: | 0.0% (0) |
Marital status - Asian population 15 years and over
- Males
- 23.3%Never married
- 68.5%Now married
- 0.0%Separated
- 0.8%Widowed
- 7.3%Divorced
- Females
- 27.5%Never married
- 63.9%Now married
- 1.1%Separated
- 4.4%Widowed
- 3.1%Divorced
Women who gave birth in the past 12 months
| Now married: | 100.0% (16) |
| Unmarried: | 0.0% (0) |
Women who did not give birth in the past 12 months
| Now married: | 51.0% (490) |
| Unmarried: | 49.0% (470) |
Marital status - Other race population 15 years and over
- Males
- 41.0%Never married
- 54.0%Now married
- 0.0%Separated
- 0.0%Widowed
- 5.0%Divorced
- Females
- 23.0%Never married
- 29.6%Now married
- 37.4%Separated
- 1.1%Widowed
- 8.9%Divorced
Women who did not give birth in the past 12 months
| Now married: | 58.0% (314) |
| Unmarried: | 42.0% (228) |
Marital status - Two or more races population 15 years and over
- Males
- 44.8%Never married
- 26.0%Now married
- 0.0%Separated
- 0.0%Widowed
- 29.3%Divorced
- Females
- 55.5%Never married
- 29.1%Now married
- 2.7%Separated
- 0.0%Widowed
- 12.7%Divorced
Women who did not give birth in the past 12 months
| Now married: | 16.8% (90) |
| Unmarried: | 83.2% (448) |
Marital status - White alone, not Hispanic / Latino population 15 years and over
- Males
- 38.4%Never married
- 50.3%Now married
- 0.0%Separated
- 3.8%Widowed
- 7.6%Divorced
- Females
- 30.7%Never married
- 42.4%Now married
- 2.9%Separated
- 11.8%Widowed
- 12.2%Divorced
Women who did not give birth in the past 12 months
| Now married: | 30.7% (191) |
| Unmarried: | 69.3% (430) |
Marital status - Hispanic or Latino population 15 years and over
- Males
- 47.3%Never married
- 36.4%Now married
- 0.0%Separated
- 0.0%Widowed
- 16.3%Divorced
- Females
- 39.8%Never married
- 29.0%Now married
- 13.3%Separated
- 1.9%Widowed
- 15.9%Divorced
Women who did not give birth in the past 12 months
| Now married: | 30.1% (403) |
| Unmarried: | 69.9% (935) |
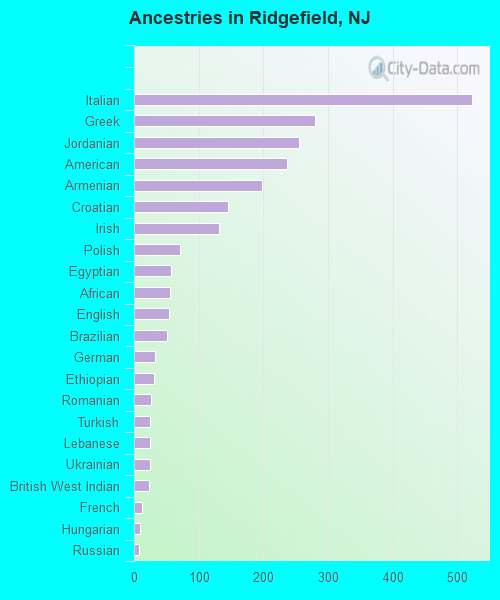
Ancestries in Ridgefield

- 5237.3%Italian
- 2803.9%Greek
- 2563.6%Jordanian
- 2373.3%American
- 1982.8%Armenian
- 1452.0%Croatian
- 1311.8%Irish
- 711.0%Polish
- 580.8%Egyptian
- 550.8%African
- 540.8%English
- 510.7%Brazilian
- 330.5%German
- 310.4%Ethiopian
- 260.4%Romanian
- 250.4%Turkish
- 240.3%Lebanese
- 240.3%Ukrainian
- 230.3%British West Indian
- 130.2%French
- 90.1%Hungarian
- 70.10%Russian
- 40.06%French Canadian
Geographical mobility in Ridgefield

- Same house 1 year ago
- 4,39595.3%White (Caucasian)
- 2822.5%Black or African American
- 2,52974.6%Asian
- 1,39790.0%Other race
- 2,38695.2%Two or more races
- 3,32094.9%White alone, not Hispanic / Latino
- 4,02993.0%Hispanic or Latino

-
- Moved within same county
- 1543.3%White / Caucasian
- 118.8%Black or African American
- 61818.2%Asian
- 15910.3%Other race
- 1022.9%White alone, not Hispanic / Latino
- 2034.7%Hispanic or Latino

-
- Moved within same state
- 210.4%White / Caucasian
- 32.3%Black or African American
- 923.7%Two or more races
- 240.7%White alone, not Hispanic / Latino
- 721.7%Hispanic or Latino

-
- Moved from different state
- 430.9%White / Caucasian
- 1905.6%Asian
- 200.8%Two or more races
- 481.4%White alone, not Hispanic / Latino
- 130.3%Hispanic or Latino

-
- Moved from abroad
- 6954.5%Black or African American
- 1153.4%Asian

Children Nativity (place of birth) in Ridgefield
Place of birth for residents in Ridgefield
![Place of birth for the foreign-born population - Regions]()
- 3,126Asia
- 2,548Eastern Asia
- 1,370Americas
- 1,360Latin America
- 700South America
- 596Europe
- 386Caribbean
- 312Southern Europe
- 273Central America
- 239China
- 219South Eastern Asia
- 209Eastern Europe
- 200Western Asia
- 157South Central Asia
- 103Africa
- 53Eastern Africa
- 50Northern Africa
- 47Western Europe
- 27Northern Europe
- 10Northern America

![Place of birth for the foreign-born population - Countries]()
- 2,256Korea
- 329Colombia
- 258Ecuador
- 219Philippines
- 172Dominican Republic
- 161Hong Kong
- 158Greece
- 125Cuba
- 119Guatemala
- 103Italy
- 100Pakistan
- 89Dominica
- 88Croatia
- 72Turkey
- 69Taiwan
- 63Lebanon
- 57India
- 56Nicaragua
- 53Guyana
- 52Japan
- 50Egypt
- 50Spain
- 47France
- 47Poland
- 42Honduras
- 36Georgia
- 35Ethiopia
- 35Peru
- 34Mexico
- 22Brazil
- 21Ukraine
- 20England
- 20El Salvador
- 20Romania
- 17Iraq
- 10Canada
- 8China
- 7Ireland
- 1Argentina

Grandparents responsible for own grandchildren in Ridgefield
Zip codes: 07657.