Races in Richmond Heights, Missouri (MO) Detailed Stats
Data:
Races - White alone (%)
Races - White alone (% change since 2000)
Races - Black alone (%)
Races - Black alone (% change since 2000)
Races - American Indian alone (%)
Races - American Indian alone (% change since 2000)
Races - Asian alone (%)
Races - Asian alone (% change since 2000)
Races - Hispanic (%)
Races - Hispanic (% change since 2000)
Races - Native Hawaiian and Other Pacific Islander alone (%)
Races - Native Hawaiian and Other Pacific Islander alone (% change since 2000)
Races - Two or more races(%)
Races - Two or more races(% change since 2000)
Races - Other race alone (%)
Races - Other race alone (% change since 2000)
Racial diversity
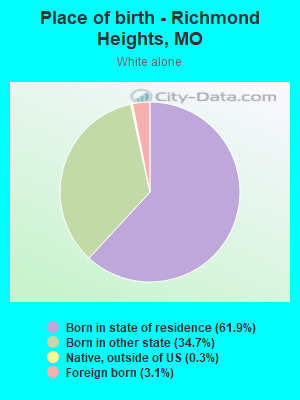
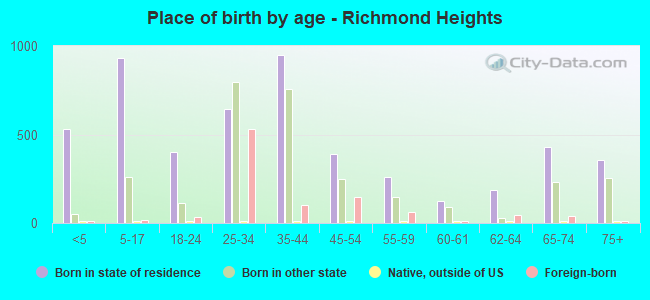
Place of birth - Born in state of residence (%)
Place of birth - Born in state of residence (%) - White
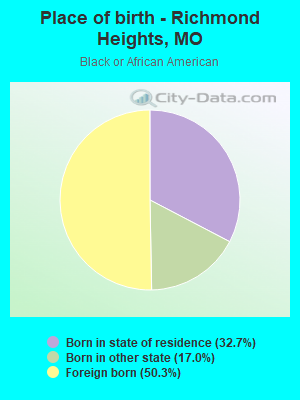
Place of birth - Born in state of residence (%) - Black or African American
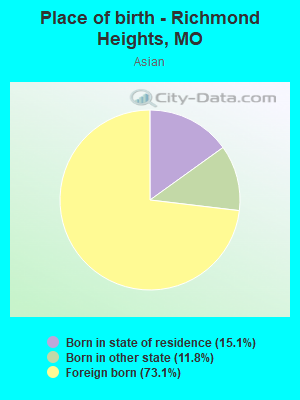
Place of birth - Born in state of residence (%) - Asian
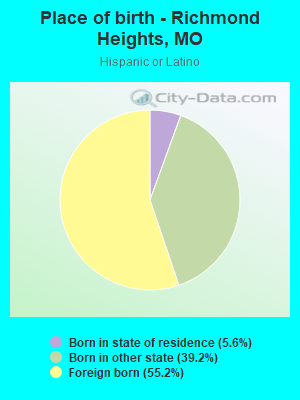
Place of birth - Born in state of residence (%) - Hispanic or Latino
Place of birth - Born in state of residence (%) - American Indian and Alaska Native
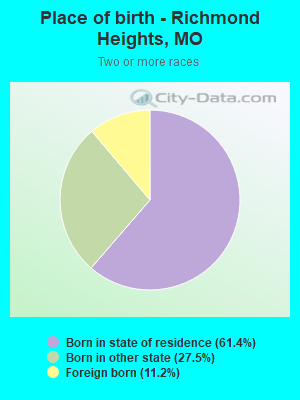
Place of birth - Born in state of residence (%) - Multirace
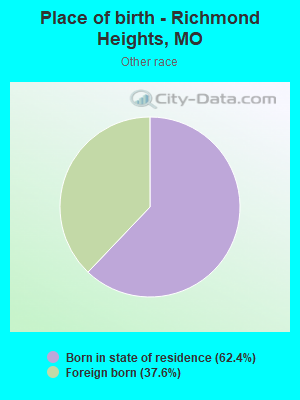
Place of birth - Born in state of residence (%) - Other Race
Place of birth - Born in other state (%)
Place of birth - Born in other state (%) - White
Place of birth - Born in other state (%) - Black or African American
Place of birth - Born in other state (%) - Asian
Place of birth - Born in other state (%) - Hispanic or Latino
Place of birth - Born in other state (%) - American Indian and Alaska Native
Place of birth - Born in other state (%) - Multirace
Place of birth - Born in other state (%) - Other Race
Place of birth - Native, outside of US (%)
Place of birth - Native, outside of US (%) - White
Place of birth - Native, outside of US (%) - Black or African American
Place of birth - Native, outside of US (%) - Asian
Place of birth - Native, outside of US (%) - Hispanic or Latino
Place of birth - Native, outside of US (%) - American Indian and Alaska Native
Place of birth - Native, outside of US (%) - Multirace
Place of birth - Native, outside of US (%) - Other Race
Place of birth - Foreign born (%)
Place of birth - Foreign born (%) - White
Place of birth - Foreign born (%) - Black or African American
Place of birth - Foreign born (%) - Asian
Place of birth - Foreign born (%) - Hispanic or Latino
Place of birth - Foreign born (%) - American Indian and Alaska Native
Place of birth - Foreign born (%) - Multirace
Place of birth - Foreign born (%) - Other Race
Residents speaking English at home (%)
Residents speaking English at home - Born in the United States (%)
Residents speaking English at home - Native, born elsewhere (%)
Residents speaking English at home - Foreign born (%)
Residents speaking Spanish at home (%)
Residents speaking Spanish at home - Born in the United States (%)
Residents speaking Spanish at home - Native, born elsewhere (%)
Residents speaking Spanish at home - Foreign born (%)
Residents speaking other language at home (%)
Residents speaking other language at home - Born in the United States (%)
Residents speaking other language at home - Native, born elsewhere (%)
Residents speaking other language at home - Foreign born (%)
Marital status - Never married (%)
Marital status - Now married (%)
Marital status - Separated (%)
Marital status - Widowed (%)
Marital status - Divorced (%)
Ancestries Reported - Arab (%)
Ancestries Reported - Czech (%)
Ancestries Reported - Danish (%)
Ancestries Reported - Dutch (%)
Ancestries Reported - English (%)
Ancestries Reported - French (%)
Ancestries Reported - French Canadian (%)
Ancestries Reported - German (%)
Ancestries Reported - Greek (%)
Ancestries Reported - Hungarian (%)
Ancestries Reported - Irish (%)
Ancestries Reported - Italian (%)
Ancestries Reported - Lithuanian (%)
Ancestries Reported - Norwegian (%)
Ancestries Reported - Polish (%)
Ancestries Reported - Portuguese (%)
Ancestries Reported - Russian (%)
Ancestries Reported - Scotch-Irish (%)
Ancestries Reported - Scottish (%)
Ancestries Reported - Slovak (%)
Ancestries Reported - Subsaharan African (%)
Ancestries Reported - Swedish (%)
Ancestries Reported - Swiss (%)
Ancestries Reported - Ukrainian (%)
Ancestries Reported - United States (%)
Ancestries Reported - Welsh (%)
Ancestries Reported - West Indian (%)
Ancestries Reported - Other (%)
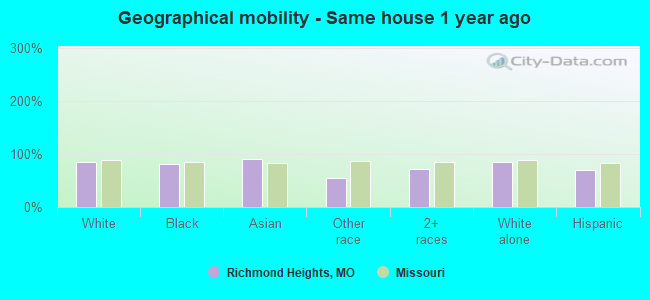
Geographical mobility - Same house 1 year ago (%)
Geographical mobility - Same house 1 year ago (%) - White
Geographical mobility - Same house 1 year ago (%) - Black or African American
Geographical mobility - Same house 1 year ago (%) - Asian
Geographical mobility - Same house 1 year ago (%) - Hispanic or Latino
Geographical mobility - Same house 1 year ago (%) - American Indian and Alaska Native
Geographical mobility - Same house 1 year ago (%) - Multirace
Geographical mobility - Same house 1 year ago (%) - Other Race
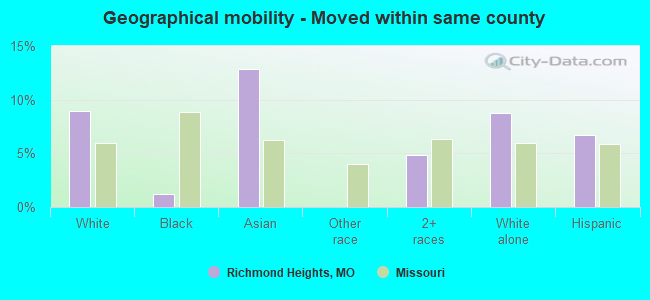
Geographical mobility - Moved within same county (%)
Geographical mobility - Moved within same county (%) - White
Geographical mobility - Moved within same county (%) - Black or African American
Geographical mobility - Moved within same county (%) - Asian
Geographical mobility - Moved within same county (%) - Hispanic or Latino
Geographical mobility - Moved within same county (%) - American Indian and Alaska Native
Geographical mobility - Moved within same county (%) - Multirace
Geographical mobility - Moved within same county (%) - Other Race
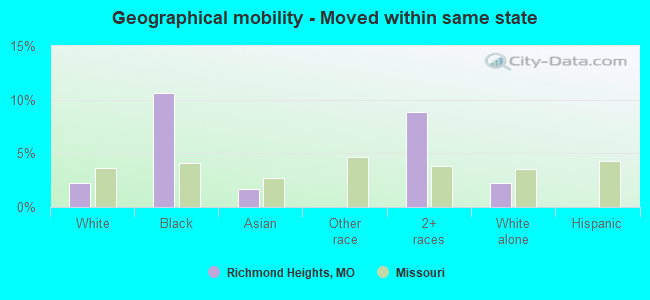
Geographical mobility - Moved from different county within same state (%)
Geographical mobility - Moved from different county within same state (%) - White
Geographical mobility - Moved from different county within same state (%) - Black or African American
Geographical mobility - Moved from different county within same state (%) - Asian
Geographical mobility - Moved from different county within same state (%) - Hispanic or Latino
Geographical mobility - Moved from different county within same state (%) - American Indian and Alaska Native
Geographical mobility - Moved from different county within same state (%) - Multirace
Geographical mobility - Moved from different county within same state (%) - Other Race
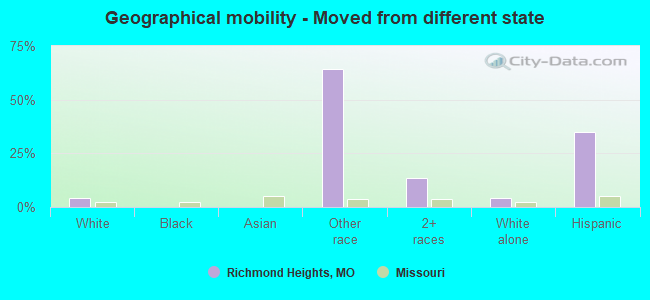
Geographical mobility - Moved from different state (%)
Geographical mobility - Moved from different state (%) - White
Geographical mobility - Moved from different state (%) - Black or African American
Geographical mobility - Moved from different state (%) - Asian
Geographical mobility - Moved from different state (%) - Hispanic or Latino
Geographical mobility - Moved from different state (%) - American Indian and Alaska Native
Geographical mobility - Moved from different state (%) - Multirace
Geographical mobility - Moved from different state (%) - Other Race
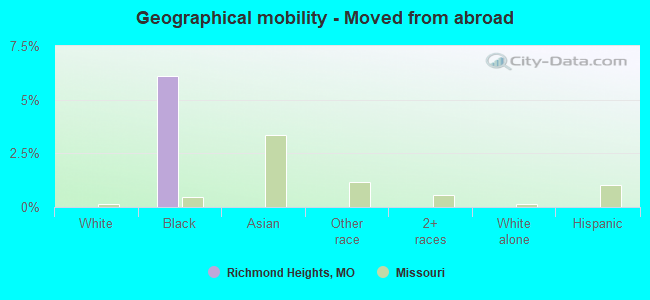
Geographical mobility - Moved from abroad (%)
Geographical mobility - Moved from abroad (%) - White
Geographical mobility - Moved from abroad (%) - Black or African American
Geographical mobility - Moved from abroad (%) - Asian
Geographical mobility - Moved from abroad (%) - Hispanic or Latino
Geographical mobility - Moved from abroad (%) - American Indian and Alaska Native
Geographical mobility - Moved from abroad (%) - Multirace
Geographical mobility - Moved from abroad (%) - Other Race
Place of birth for the foreign-born population - Ireland (%)
Place of birth for the foreign-born population - Denmark (%)
Place of birth for the foreign-born population - Norway (%)
Place of birth for the foreign-born population - Sweden (%)
Place of birth for the foreign-born population - United Kingdom (%)
Place of birth for the foreign-born population - England (%)
Place of birth for the foreign-born population - Scotland (%)
Place of birth for the foreign-born population - Other Northern Europe (%)
Place of birth for the foreign-born population - Austria (%)
Place of birth for the foreign-born population - Belgium (%)
Place of birth for the foreign-born population - France (%)
Place of birth for the foreign-born population - Germany (%)
Place of birth for the foreign-born population - Netherlands (%)
Place of birth for the foreign-born population - Switzerland (%)
Place of birth for the foreign-born population - Other Western Europe (%)
Place of birth for the foreign-born population - Greece (%)
Place of birth for the foreign-born population - Italy (%)
Place of birth for the foreign-born population - Portugal (%)
Place of birth for the foreign-born population - Spain (%)
Place of birth for the foreign-born population - Other Southern Europe (%)
Place of birth for the foreign-born population - Albania (%)
Place of birth for the foreign-born population - Belarus (%)
Place of birth for the foreign-born population - Bosnia and Herzegovina (%)
Place of birth for the foreign-born population - Bulgaria (%)
Place of birth for the foreign-born population - Croatia (%)
Place of birth for the foreign-born population - Czechoslovakia (%)
Place of birth for the foreign-born population - Hungary (%)
Place of birth for the foreign-born population - Latvia (%)
Place of birth for the foreign-born population - Lithuania (%)
Place of birth for the foreign-born population - North Macedonia (Macedonia) (%)
Place of birth for the foreign-born population - Moldova (%)
Place of birth for the foreign-born population - Poland (%)
Place of birth for the foreign-born population - Romania (%)
Place of birth for the foreign-born population - Russia (%)
Place of birth for the foreign-born population - Serbia (%)
Place of birth for the foreign-born population - Ukraine (%)
Place of birth for the foreign-born population - Other Eastern Europe (%)
Place of birth for the foreign-born population - China (%)
Place of birth for the foreign-born population - Hong Kong (%)
Place of birth for the foreign-born population - Taiwan (%)
Place of birth for the foreign-born population - Japan (%)
Place of birth for the foreign-born population - Korea (%)
Place of birth for the foreign-born population - Other Eastern Asia (%)
Place of birth for the foreign-born population - Afghanistan (%)
Place of birth for the foreign-born population - Bangladesh (%)
Place of birth for the foreign-born population - India (%)
Place of birth for the foreign-born population - Iran (%)
Place of birth for the foreign-born population - Kazakhstan (%)
Place of birth for the foreign-born population - Nepal (%)
Place of birth for the foreign-born population - Pakistan (%)
Place of birth for the foreign-born population - Sri Lanka (%)
Place of birth for the foreign-born population - Uzbekistan (%)
Place of birth for the foreign-born population - Other South Central Asia (%)
Place of birth for the foreign-born population - Burma (%)
Place of birth for the foreign-born population - Cambodia (%)
Place of birth for the foreign-born population - Indonesia (%)
Place of birth for the foreign-born population - Laos (%)
Place of birth for the foreign-born population - Malaysia (%)
Place of birth for the foreign-born population - Philippines (%)
Place of birth for the foreign-born population - Singapore (%)
Place of birth for the foreign-born population - Thailand (%)
Place of birth for the foreign-born population - Vietnam (%)
Place of birth for the foreign-born population - Other South Eastern Asia (%)
Place of birth for the foreign-born population - Armenia (%)
Place of birth for the foreign-born population - Iraq (%)
Place of birth for the foreign-born population - Israel (%)
Place of birth for the foreign-born population - Jordan (%)
Place of birth for the foreign-born population - Kuwait (%)
Place of birth for the foreign-born population - Lebanon (%)
Place of birth for the foreign-born population - Saudi Arabia (%)
Place of birth for the foreign-born population - Syria (%)
Place of birth for the foreign-born population - Turkey (%)
Place of birth for the foreign-born population - Yemen (%)
Place of birth for the foreign-born population - Other Western Asia (%)
Place of birth for the foreign-born population - Eritrea (%)
Place of birth for the foreign-born population - Ethiopia (%)
Place of birth for the foreign-born population - Kenya (%)
Place of birth for the foreign-born population - Somalia (%)
Place of birth for the foreign-born population - Uganda (%)
Place of birth for the foreign-born population - Zimbabwe (%)
Place of birth for the foreign-born population - Other Eastern Africa (%)
Place of birth for the foreign-born population - Cameroon (%)
Place of birth for the foreign-born population - Congo (%)
Place of birth for the foreign-born population - Democratic Republic of Congo (Zaire) (%)
Place of birth for the foreign-born population - Other Middle Africa (%)
Place of birth for the foreign-born population - Egypt (%)
Place of birth for the foreign-born population - Morocco (%)
Place of birth for the foreign-born population - Sudan (%)
Place of birth for the foreign-born population - Other Northern Africa (%)
Place of birth for the foreign-born population - South Africa (%)
Place of birth for the foreign-born population - Other Southern Africa (%)
Place of birth for the foreign-born population - Cabo Verde (%)
Place of birth for the foreign-born population - Ghana (%)
Place of birth for the foreign-born population - Liberia (%)
Place of birth for the foreign-born population - Nigeria (%)
Place of birth for the foreign-born population - Senegal (%)
Place of birth for the foreign-born population - Sierra Leone (%)
Place of birth for the foreign-born population - Other Western Africa (%)
Place of birth for the foreign-born population - Australia (%)
Place of birth for the foreign-born population - New Zealand (%)
Place of birth for the foreign-born population - Fiji (%)
Place of birth for the foreign-born population - Micronesia (%)
Place of birth for the foreign-born population - Bahamas (%)
Place of birth for the foreign-born population - Barbados (%)
Place of birth for the foreign-born population - Cuba (%)
Place of birth for the foreign-born population - Dominica (%)
Place of birth for the foreign-born population - Dominican Republic (%)
Place of birth for the foreign-born population - Grenada (%)
Place of birth for the foreign-born population - Haiti (%)
Place of birth for the foreign-born population - Jamaica (%)
Place of birth for the foreign-born population - St. Vincent and the Grenadines (%)
Place of birth for the foreign-born population - Trinidad and Tobago (%)
Place of birth for the foreign-born population - West Indies (%)
Place of birth for the foreign-born population - Other Caribbean (%)
Place of birth for the foreign-born population - Belize (%)
Place of birth for the foreign-born population - Costa Rica (%)
Place of birth for the foreign-born population - El Salvador (%)
Place of birth for the foreign-born population - Guatemala (%)
Place of birth for the foreign-born population - Honduras (%)
Place of birth for the foreign-born population - Mexico (%)
Place of birth for the foreign-born population - Nicaragua (%)
Place of birth for the foreign-born population - Panama (%)
Place of birth for the foreign-born population - Other Central America (%)
Place of birth for the foreign-born population - Argentina (%)
Place of birth for the foreign-born population - Bolivia (%)
Place of birth for the foreign-born population - Brazil (%)
Place of birth for the foreign-born population - Chile (%)
Place of birth for the foreign-born population - Colombia (%)
Place of birth for the foreign-born population - Ecuador (%)
Place of birth for the foreign-born population - Guyana (%)
Place of birth for the foreign-born population - Peru (%)
Place of birth for the foreign-born population - Uruguay (%)
Place of birth for the foreign-born population - Venezuela (%)
Place of birth for the foreign-born population - Other South America (%)
Place of birth for the foreign-born population - Canada (%)
Place of birth for the foreign-born population - Other Northern America (%)
Place of birth for the foreign-born population - Other (%)
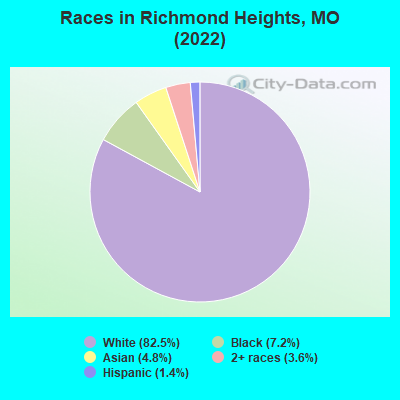
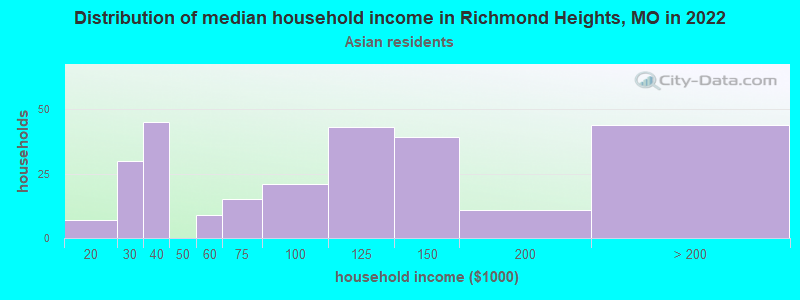
According to 2022 data, the most numerous races in Richmond Heights, MO are White alone (7,505 residents), Black alone (659 residents), and Two or more races (330 residents). 93.3% of Richmond Heights residents speak English at home. 10.2% of Richmond Heights, MO residents are foreign-born (3.8% born in Asia, 3.6% born in Africa, 1.5% born in Europe), which is 60.6% greater than the foreign-born rate of 4.0% across the entire state of Missouri.
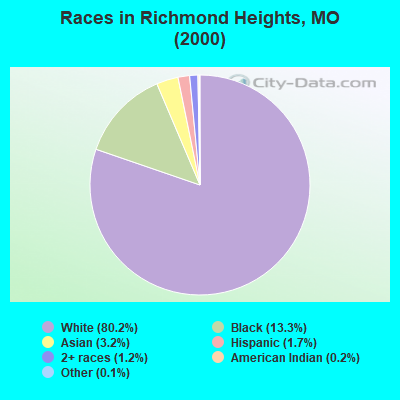
Race distribution in Richmond Heights
2000 2022
4,686,474 83.8% White alone 625,667 11.2% Black alone 118,592 2.1% Hispanic 71,905 1.3% Two or more races 61,041 1.1% Asian alone 23,302 0.4% American Indian alone 5,291 0.09% Other race alone 2,939 0.05% Native Hawaiian and Other
4,733,411 76.6% White alone 656,739 10.6% Black alone 316,300 5.1% Two or more races 291,763 4.7% Hispanic 132,436 2.1% Asian alone 27,467 0.4% Other race alone 12,313 0.2% American Indian alone 7,528 0.1% Native Hawaiian and Other
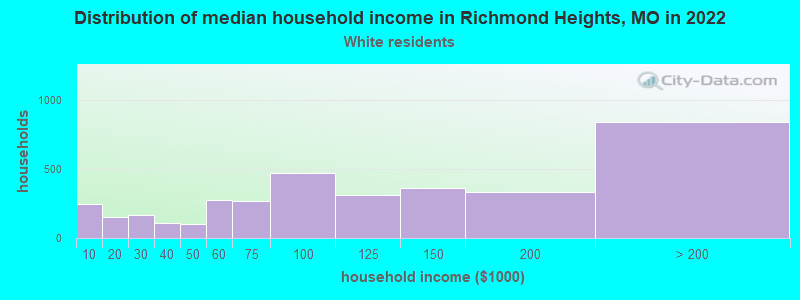
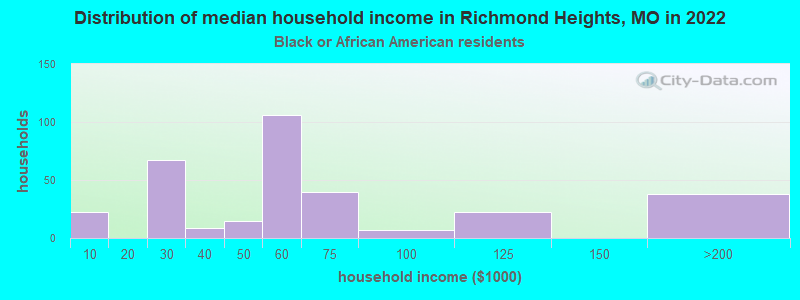
Income and house value in Richmond Heights Median household income in 2022 $108,215 White non-Hispanic householders$58,934 Black householders$110,151 Asian householders$48,613 Two or more races householdersMedian 2022 house value $345,953 White Non-Hispanic householders$193,147 Black or African American householders$432,992 American Indian or Alaska Native householders $312,458 Asian householders$290,454 Two or more races householders$325,171 Hispanic or Latino householders
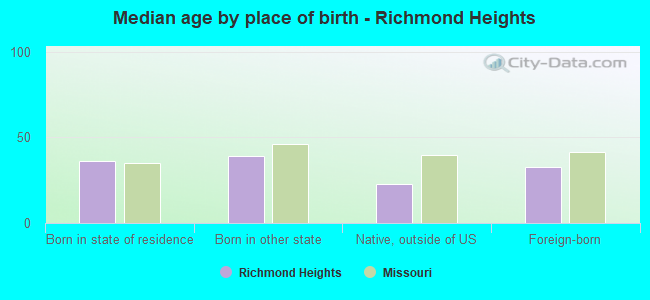
Median age by race in Richmond Heights
37.5 Median age for White residents35.1 38.2 30.8 Median age for Black or African American residents48.6 31.7 -520,187,792.9 Median age for American Indian / Alaska Native residents-644,003,776.5 -505,494,505.0 33.4 Median age for Asian residents34.1 34.1 -710,303,029.6 Median age for Native Hawaiian / Pacific Islander residents-1,449,781,657.9 -752,136,751.4 10.1 Median age for Other race residents-623,582,765.8 10.5 29.5 Median age for Two or more races residents33.0 29.3 37.4 Median age for White alone residents35.1 38.2 32.1 Median age for Hispanic or Latino residents40.2 31.4
Owner/renter occupied households by race in Richmond Heights
House owners and renters - White residents 2,013 55.8% Owner occupied1,594 44.2% Renter occupiedHouse owners and renters - Black or African American residents 115 35.7% Owner occupied207 64.3% Renter occupiedHouse owners and renters - Asian residents 77 31.9% Owner occupied164 68.1% Renter occupiedHouse owners and renters - Two or more races residents 98 41.7% Owner occupied136 58.3% Renter occupiedHouse owners and renters - White alone residents 2,021 56.0% Owner occupied1,585 44.0% Renter occupiedHouse owners and renters - Hispanic or Latino residents 6 12.4% Owner occupied43 87.6% Renter occupied
Language usage in Richmond Heights
English speakers - Total 93.3% of residents of Richmond Heights speak English at home.
1.1% of residents speak Spanish at home 56 62.2% Speak English very well34 37.8% Speak English less than very well5.6% of residents speak other language at home 385 81.2% Speak English very well89 18.8% Speak English less than very well
English speakers - Born in the United States 96.2% of residents of Richmond Heights speak English at home.
0.6% of residents speak Spanish at home 18 100.0% Speak English very well3.1% of residents speak other language at home 58 64.4% Speak English very well32 35.6% Speak English less than very well
English speakers - Native, born elsewhere 45.5% of residents of Richmond Heights speak English at home.
77.3% of residents speak other language at home 17 100.0% Speak English very well
English speakers - Foreign-born 61.7% of residents of Richmond Heights speak English at home.
8.2% of residents speak Spanish at home 39 51.3% Speak English very well37 48.7% Speak English less than very well32.8% of residents speak other language at home 264 86.6% Speak English very well41 13.4% Speak English less than very well
White (Caucasian) - Speak only English Native:
98.2% (6,609)Foreign-born:
42.9% (106)
White (Caucasian) - Speak another language Native:
1.8% (120)Foreign-born:
52.7% (131)
Black or African American - Speak only English Native:
99.0% (364)Foreign-born:
100.0% (350)
Asian - Speak only English Native:
56.2% (58)Foreign-born:
42.4% (133)
Asian - Speak another language Native:
43.8% (45)Foreign-born:
64.9% (204)
Two or more races - Speak another language Native:
0.4% (2)Foreign-born:
100.0% (45)
White alone - Speak only English Native:
98.2% (6,600)Foreign-born:
48.1% (109)
White alone - Speak another language Native:
1.8% (123)Foreign-born:
46.5% (105)
Hispanic or Latino - Speak another language Native:
8.1% (4)Foreign-born:
100.0% (73)
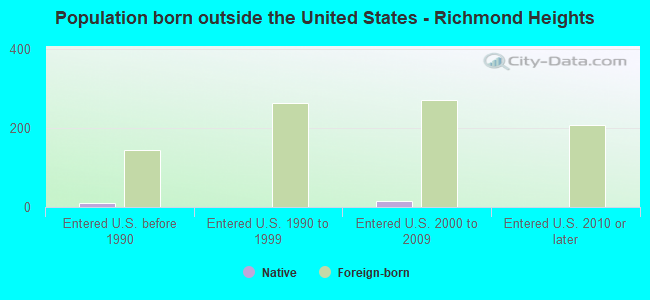
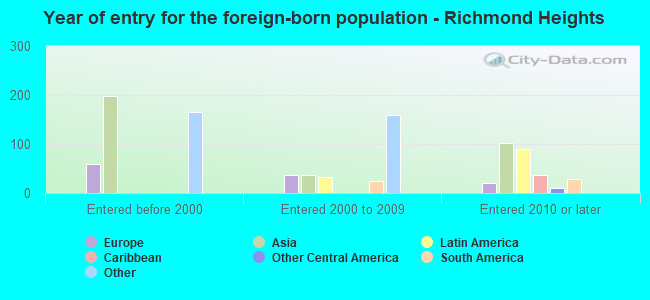
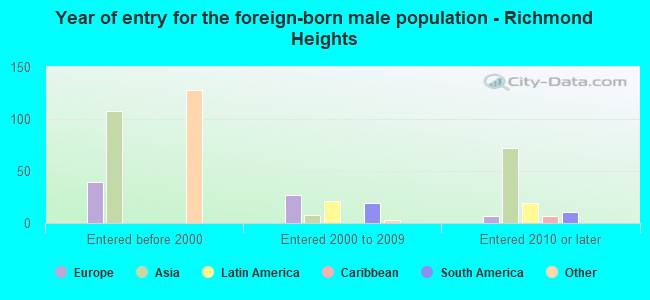
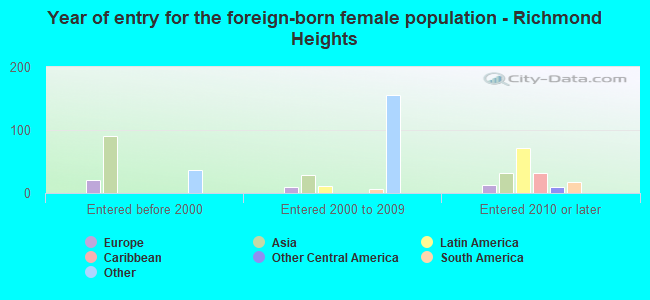
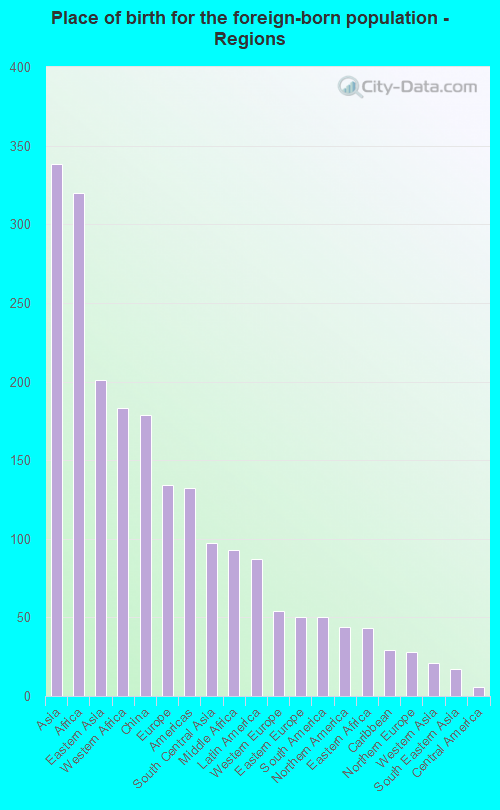
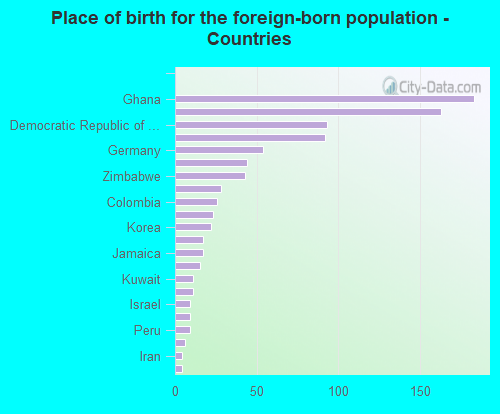
Foreign-born residents in Richmond Heights 925 residents are foreign born (3.8% Asia , 3.6% Africa , 1.5% Europe ).
This city:
10.2%Missouri:
4.2%
Marital status for residents in Richmond Heights Marital status - White (Caucasian) population 15 years and over
Males 35.9% Never married54.2% Now married0.5% Separated2.0% Widowed7.4% DivorcedFemales 32.7% Never married44.5% Now married3.2% Separated7.0% Widowed12.6% DivorcedWomen who gave birth in the past 12 months Now married:
100.0% (127)Unmarried:
0.0% (0)
Women who did not give birth in the past 12 months Now married:
45.6% (736)Unmarried:
54.4% (878)
Marital status - Black or African American population 15 years and over
Males 59.6% Never married16.9% Now married12.3% Separated3.5% Widowed7.7% DivorcedFemales 18.7% Never married56.5% Now married0.0% Separated5.4% Widowed19.4% DivorcedWomen who did not give birth in the past 12 months Now married:
80.2% (183)Unmarried:
19.8% (45)
Marital status - Asian population 15 years and over
Males 40.7% Never married38.6% Now married0.0% Separated0.0% Widowed20.6% DivorcedFemales 52.3% Never married41.0% Now married0.0% Separated0.0% Widowed6.7% DivorcedWomen who gave birth in the past 12 months Now married:
100.0% (5)Unmarried:
0.0% (0)
Women who did not give birth in the past 12 months Now married:
28.8% (49)Unmarried:
71.2% (121)
Marital status - Two or more races population 15 years and over
Males 73.4% Never married23.8% Now married0.0% Separated0.0% Widowed2.8% DivorcedFemales 60.5% Never married38.4% Now married0.0% Separated0.0% Widowed1.2% DivorcedWomen who did not give birth in the past 12 months Now married:
34.2% (36)Unmarried:
65.8% (68)
Marital status - White alone, not Hispanic / Latino population 15 years and over
Males 36.3% Never married54.1% Now married0.5% Separated2.0% Widowed7.2% DivorcedFemales 32.6% Never married44.4% Now married3.2% Separated7.0% Widowed12.7% DivorcedWomen who gave birth in the past 12 months Now married:
100.0% (128)Unmarried:
0.0% (0)
Women who did not give birth in the past 12 months Now married:
45.4% (726)Unmarried:
54.6% (874)
Marital status - Hispanic or Latino population 15 years and over
Males 13.0% Never married59.3% Now married0.0% Separated0.0% Widowed27.8% DivorcedFemales 39.1% Never married60.9% Now married0.0% Separated0.0% Widowed0.0% DivorcedWomen who did not give birth in the past 12 months Now married:
55.0% (24)Unmarried:
45.0% (19)
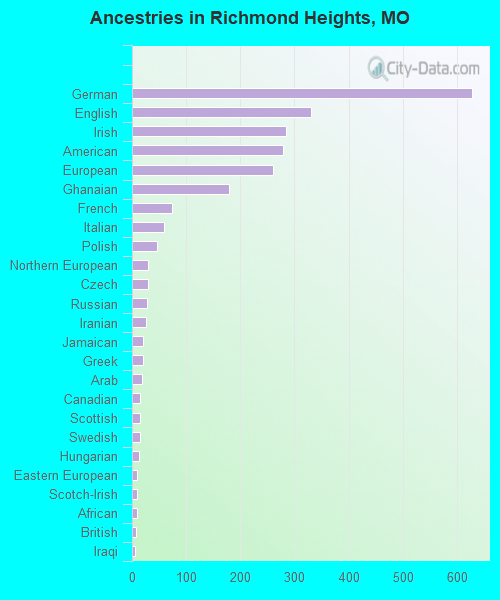
Ancestries in Richmond Heights
628 18.7% German330 9.8% English285 8.5% Irish278 8.3% American261 7.8% European180 5.4% Ghanaian73 2.2% French59 1.8% Italian47 1.4% Polish30 0.9% Northern European29 0.9% Czech28 0.8% Russian25 0.7% Iranian21 0.6% Jamaican20 0.6% Greek19 0.6% Arab14 0.4% Canadian14 0.4% Scottish14 0.4% Swedish13 0.4% Hungarian10 0.3% Eastern European9 0.3% Scotch-Irish9 0.3% African7 0.2% British6 0.2% Iraqi6 0.2% Finnish6 0.2% Norwegian4 0.1% Dutch
Children Nativity (place of birth) in Richmond Heights
Children under 6 years - Living with two parents Both parents native 591 99.5% Native3 0.5% Foreign-bornBoth parents foreign-born 29 82.4% Native6 17.6% Foreign-bornChildren under 6 years - Living with one parent Native parent 89 100.0% NativeChildren 6 to 17 years - Living with two parents Both parents native 746 100.0% NativeBoth parents foreign-born 25 54.5% Native21 45.5% Foreign-bornOne native, one foreign-born parent 31 100.0% NativeChildren 6 to 17 years - Living with one parent Native parent 261 100.0% Native