Races in Reynoldsburg, Ohio (OH) Detailed Stats
Data:
Races - White alone (%)
Races - White alone (% change since 2000)
Races - Black alone (%)
Races - Black alone (% change since 2000)
Races - American Indian alone (%)
Races - American Indian alone (% change since 2000)
Races - Asian alone (%)
Races - Asian alone (% change since 2000)
Races - Hispanic (%)
Races - Hispanic (% change since 2000)
Races - Native Hawaiian and Other Pacific Islander alone (%)
Races - Native Hawaiian and Other Pacific Islander alone (% change since 2000)
Races - Two or more races(%)
Races - Two or more races(% change since 2000)
Races - Other race alone (%)
Races - Other race alone (% change since 2000)
Racial diversity
Place of birth - Born in state of residence (%)
Place of birth - Born in state of residence (%) - White
Place of birth - Born in state of residence (%) - Black or African American
Place of birth - Born in state of residence (%) - Asian
Place of birth - Born in state of residence (%) - Hispanic or Latino
Place of birth - Born in state of residence (%) - American Indian and Alaska Native
Place of birth - Born in state of residence (%) - Multirace
Place of birth - Born in state of residence (%) - Other Race
Place of birth - Born in other state (%)
Place of birth - Born in other state (%) - White
Place of birth - Born in other state (%) - Black or African American
Place of birth - Born in other state (%) - Asian
Place of birth - Born in other state (%) - Hispanic or Latino
Place of birth - Born in other state (%) - American Indian and Alaska Native
Place of birth - Born in other state (%) - Multirace
Place of birth - Born in other state (%) - Other Race
Place of birth - Native, outside of US (%)
Place of birth - Native, outside of US (%) - White
Place of birth - Native, outside of US (%) - Black or African American
Place of birth - Native, outside of US (%) - Asian
Place of birth - Native, outside of US (%) - Hispanic or Latino
Place of birth - Native, outside of US (%) - American Indian and Alaska Native
Place of birth - Native, outside of US (%) - Multirace
Place of birth - Native, outside of US (%) - Other Race
Place of birth - Foreign born (%)
Place of birth - Foreign born (%) - White
Place of birth - Foreign born (%) - Black or African American
Place of birth - Foreign born (%) - Asian
Place of birth - Foreign born (%) - Hispanic or Latino
Place of birth - Foreign born (%) - American Indian and Alaska Native
Place of birth - Foreign born (%) - Multirace
Place of birth - Foreign born (%) - Other Race
Residents speaking English at home (%)
Residents speaking English at home - Born in the United States (%)
Residents speaking English at home - Native, born elsewhere (%)
Residents speaking English at home - Foreign born (%)
Residents speaking Spanish at home (%)
Residents speaking Spanish at home - Born in the United States (%)
Residents speaking Spanish at home - Native, born elsewhere (%)
Residents speaking Spanish at home - Foreign born (%)
Residents speaking other language at home (%)
Residents speaking other language at home - Born in the United States (%)
Residents speaking other language at home - Native, born elsewhere (%)
Residents speaking other language at home - Foreign born (%)
Marital status - Never married (%)
Marital status - Now married (%)
Marital status - Separated (%)
Marital status - Widowed (%)
Marital status - Divorced (%)
Ancestries Reported - Arab (%)
Ancestries Reported - Czech (%)
Ancestries Reported - Danish (%)
Ancestries Reported - Dutch (%)
Ancestries Reported - English (%)
Ancestries Reported - French (%)
Ancestries Reported - French Canadian (%)
Ancestries Reported - German (%)
Ancestries Reported - Greek (%)
Ancestries Reported - Hungarian (%)
Ancestries Reported - Irish (%)
Ancestries Reported - Italian (%)
Ancestries Reported - Lithuanian (%)
Ancestries Reported - Norwegian (%)
Ancestries Reported - Polish (%)
Ancestries Reported - Portuguese (%)
Ancestries Reported - Russian (%)
Ancestries Reported - Scotch-Irish (%)
Ancestries Reported - Scottish (%)
Ancestries Reported - Slovak (%)
Ancestries Reported - Subsaharan African (%)
Ancestries Reported - Swedish (%)
Ancestries Reported - Swiss (%)
Ancestries Reported - Ukrainian (%)
Ancestries Reported - United States (%)
Ancestries Reported - Welsh (%)
Ancestries Reported - West Indian (%)
Ancestries Reported - Other (%)
Geographical mobility - Same house 1 year ago (%)
Geographical mobility - Same house 1 year ago (%) - White
Geographical mobility - Same house 1 year ago (%) - Black or African American
Geographical mobility - Same house 1 year ago (%) - Asian
Geographical mobility - Same house 1 year ago (%) - Hispanic or Latino
Geographical mobility - Same house 1 year ago (%) - American Indian and Alaska Native
Geographical mobility - Same house 1 year ago (%) - Multirace
Geographical mobility - Same house 1 year ago (%) - Other Race
Geographical mobility - Moved within same county (%)
Geographical mobility - Moved within same county (%) - White
Geographical mobility - Moved within same county (%) - Black or African American
Geographical mobility - Moved within same county (%) - Asian
Geographical mobility - Moved within same county (%) - Hispanic or Latino
Geographical mobility - Moved within same county (%) - American Indian and Alaska Native
Geographical mobility - Moved within same county (%) - Multirace
Geographical mobility - Moved within same county (%) - Other Race
Geographical mobility - Moved from different county within same state (%)
Geographical mobility - Moved from different county within same state (%) - White
Geographical mobility - Moved from different county within same state (%) - Black or African American
Geographical mobility - Moved from different county within same state (%) - Asian
Geographical mobility - Moved from different county within same state (%) - Hispanic or Latino
Geographical mobility - Moved from different county within same state (%) - American Indian and Alaska Native
Geographical mobility - Moved from different county within same state (%) - Multirace
Geographical mobility - Moved from different county within same state (%) - Other Race
Geographical mobility - Moved from different state (%)
Geographical mobility - Moved from different state (%) - White
Geographical mobility - Moved from different state (%) - Black or African American
Geographical mobility - Moved from different state (%) - Asian
Geographical mobility - Moved from different state (%) - Hispanic or Latino
Geographical mobility - Moved from different state (%) - American Indian and Alaska Native
Geographical mobility - Moved from different state (%) - Multirace
Geographical mobility - Moved from different state (%) - Other Race
Geographical mobility - Moved from abroad (%)
Geographical mobility - Moved from abroad (%) - White
Geographical mobility - Moved from abroad (%) - Black or African American
Geographical mobility - Moved from abroad (%) - Asian
Geographical mobility - Moved from abroad (%) - Hispanic or Latino
Geographical mobility - Moved from abroad (%) - American Indian and Alaska Native
Geographical mobility - Moved from abroad (%) - Multirace
Geographical mobility - Moved from abroad (%) - Other Race
Place of birth for the foreign-born population - Ireland (%)
Place of birth for the foreign-born population - Denmark (%)
Place of birth for the foreign-born population - Norway (%)
Place of birth for the foreign-born population - Sweden (%)
Place of birth for the foreign-born population - United Kingdom (%)
Place of birth for the foreign-born population - England (%)
Place of birth for the foreign-born population - Scotland (%)
Place of birth for the foreign-born population - Other Northern Europe (%)
Place of birth for the foreign-born population - Austria (%)
Place of birth for the foreign-born population - Belgium (%)
Place of birth for the foreign-born population - France (%)
Place of birth for the foreign-born population - Germany (%)
Place of birth for the foreign-born population - Netherlands (%)
Place of birth for the foreign-born population - Switzerland (%)
Place of birth for the foreign-born population - Other Western Europe (%)
Place of birth for the foreign-born population - Greece (%)
Place of birth for the foreign-born population - Italy (%)
Place of birth for the foreign-born population - Portugal (%)
Place of birth for the foreign-born population - Spain (%)
Place of birth for the foreign-born population - Other Southern Europe (%)
Place of birth for the foreign-born population - Albania (%)
Place of birth for the foreign-born population - Belarus (%)
Place of birth for the foreign-born population - Bosnia and Herzegovina (%)
Place of birth for the foreign-born population - Bulgaria (%)
Place of birth for the foreign-born population - Croatia (%)
Place of birth for the foreign-born population - Czechoslovakia (%)
Place of birth for the foreign-born population - Hungary (%)
Place of birth for the foreign-born population - Latvia (%)
Place of birth for the foreign-born population - Lithuania (%)
Place of birth for the foreign-born population - North Macedonia (Macedonia) (%)
Place of birth for the foreign-born population - Moldova (%)
Place of birth for the foreign-born population - Poland (%)
Place of birth for the foreign-born population - Romania (%)
Place of birth for the foreign-born population - Russia (%)
Place of birth for the foreign-born population - Serbia (%)
Place of birth for the foreign-born population - Ukraine (%)
Place of birth for the foreign-born population - Other Eastern Europe (%)
Place of birth for the foreign-born population - China (%)
Place of birth for the foreign-born population - Hong Kong (%)
Place of birth for the foreign-born population - Taiwan (%)
Place of birth for the foreign-born population - Japan (%)
Place of birth for the foreign-born population - Korea (%)
Place of birth for the foreign-born population - Other Eastern Asia (%)
Place of birth for the foreign-born population - Afghanistan (%)
Place of birth for the foreign-born population - Bangladesh (%)
Place of birth for the foreign-born population - India (%)
Place of birth for the foreign-born population - Iran (%)
Place of birth for the foreign-born population - Kazakhstan (%)
Place of birth for the foreign-born population - Nepal (%)
Place of birth for the foreign-born population - Pakistan (%)
Place of birth for the foreign-born population - Sri Lanka (%)
Place of birth for the foreign-born population - Uzbekistan (%)
Place of birth for the foreign-born population - Other South Central Asia (%)
Place of birth for the foreign-born population - Burma (%)
Place of birth for the foreign-born population - Cambodia (%)
Place of birth for the foreign-born population - Indonesia (%)
Place of birth for the foreign-born population - Laos (%)
Place of birth for the foreign-born population - Malaysia (%)
Place of birth for the foreign-born population - Philippines (%)
Place of birth for the foreign-born population - Singapore (%)
Place of birth for the foreign-born population - Thailand (%)
Place of birth for the foreign-born population - Vietnam (%)
Place of birth for the foreign-born population - Other South Eastern Asia (%)
Place of birth for the foreign-born population - Armenia (%)
Place of birth for the foreign-born population - Iraq (%)
Place of birth for the foreign-born population - Israel (%)
Place of birth for the foreign-born population - Jordan (%)
Place of birth for the foreign-born population - Kuwait (%)
Place of birth for the foreign-born population - Lebanon (%)
Place of birth for the foreign-born population - Saudi Arabia (%)
Place of birth for the foreign-born population - Syria (%)
Place of birth for the foreign-born population - Turkey (%)
Place of birth for the foreign-born population - Yemen (%)
Place of birth for the foreign-born population - Other Western Asia (%)
Place of birth for the foreign-born population - Eritrea (%)
Place of birth for the foreign-born population - Ethiopia (%)
Place of birth for the foreign-born population - Kenya (%)
Place of birth for the foreign-born population - Somalia (%)
Place of birth for the foreign-born population - Uganda (%)
Place of birth for the foreign-born population - Zimbabwe (%)
Place of birth for the foreign-born population - Other Eastern Africa (%)
Place of birth for the foreign-born population - Cameroon (%)
Place of birth for the foreign-born population - Congo (%)
Place of birth for the foreign-born population - Democratic Republic of Congo (Zaire) (%)
Place of birth for the foreign-born population - Other Middle Africa (%)
Place of birth for the foreign-born population - Egypt (%)
Place of birth for the foreign-born population - Morocco (%)
Place of birth for the foreign-born population - Sudan (%)
Place of birth for the foreign-born population - Other Northern Africa (%)
Place of birth for the foreign-born population - South Africa (%)
Place of birth for the foreign-born population - Other Southern Africa (%)
Place of birth for the foreign-born population - Cabo Verde (%)
Place of birth for the foreign-born population - Ghana (%)
Place of birth for the foreign-born population - Liberia (%)
Place of birth for the foreign-born population - Nigeria (%)
Place of birth for the foreign-born population - Senegal (%)
Place of birth for the foreign-born population - Sierra Leone (%)
Place of birth for the foreign-born population - Other Western Africa (%)
Place of birth for the foreign-born population - Australia (%)
Place of birth for the foreign-born population - New Zealand (%)
Place of birth for the foreign-born population - Fiji (%)
Place of birth for the foreign-born population - Micronesia (%)
Place of birth for the foreign-born population - Bahamas (%)
Place of birth for the foreign-born population - Barbados (%)
Place of birth for the foreign-born population - Cuba (%)
Place of birth for the foreign-born population - Dominica (%)
Place of birth for the foreign-born population - Dominican Republic (%)
Place of birth for the foreign-born population - Grenada (%)
Place of birth for the foreign-born population - Haiti (%)
Place of birth for the foreign-born population - Jamaica (%)
Place of birth for the foreign-born population - St. Vincent and the Grenadines (%)
Place of birth for the foreign-born population - Trinidad and Tobago (%)
Place of birth for the foreign-born population - West Indies (%)
Place of birth for the foreign-born population - Other Caribbean (%)
Place of birth for the foreign-born population - Belize (%)
Place of birth for the foreign-born population - Costa Rica (%)
Place of birth for the foreign-born population - El Salvador (%)
Place of birth for the foreign-born population - Guatemala (%)
Place of birth for the foreign-born population - Honduras (%)
Place of birth for the foreign-born population - Mexico (%)
Place of birth for the foreign-born population - Nicaragua (%)
Place of birth for the foreign-born population - Panama (%)
Place of birth for the foreign-born population - Other Central America (%)
Place of birth for the foreign-born population - Argentina (%)
Place of birth for the foreign-born population - Bolivia (%)
Place of birth for the foreign-born population - Brazil (%)
Place of birth for the foreign-born population - Chile (%)
Place of birth for the foreign-born population - Colombia (%)
Place of birth for the foreign-born population - Ecuador (%)
Place of birth for the foreign-born population - Guyana (%)
Place of birth for the foreign-born population - Peru (%)
Place of birth for the foreign-born population - Uruguay (%)
Place of birth for the foreign-born population - Venezuela (%)
Place of birth for the foreign-born population - Other South America (%)
Place of birth for the foreign-born population - Canada (%)
Place of birth for the foreign-born population - Other Northern America (%)
Place of birth for the foreign-born population - Other (%)
Latest news about races in Reynoldsburg, OH collected exclusively by city-data.com from local newspapers, TV, and radio stations
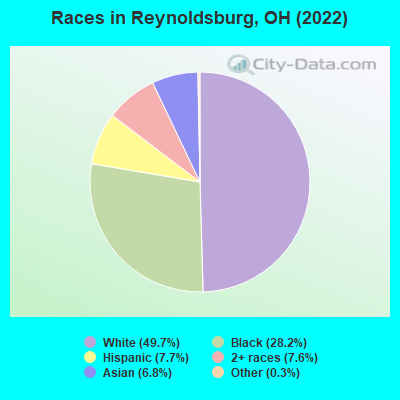
According to 2022 data, the most numerous races in Reynoldsburg, OH are White alone (20,408 residents), Black alone (11,591 residents), and Two or more races (3,110 residents). 81.6% of Reynoldsburg residents speak English at home. 12.8% of Reynoldsburg, OH residents are foreign-born (5.1% born in Asia, 3.7% born in Africa, 2.6% born in Latin America), which is 68.8% greater than the foreign-born rate of 4.0% across the entire state of Ohio.
Race distribution in Reynoldsburg
2000 2022
9,538,111 84.0% White alone 1,290,662 11.4% Black alone 217,123 1.9% Hispanic 137,770 1.2% Two or more races 131,670 1.2% Asian alone 21,985 0.2% American Indian alone 13,483 0.1% Other race alone 2,336 0.02% Native Hawaiian and Other
8,948,793 76.1% White alone 1,401,403 11.9% Black alone 529,291 4.5% Two or more races 517,232 4.4% Hispanic 293,387 2.5% Asian alone 52,805 0.4% Other race alone 9,785 0.08% American Indian alone 3,362 0.03% Native Hawaiian and Other
Income and house value in Reynoldsburg Median household income in 2022 $67,471 White non-Hispanic householders$70,820 Black householders$74,602 Asian householders$37,999 Some other race householders$81,739 Two or more races householders$37,691 Hispanic or Latino race householdersMedian 2022 house value $251,057 White Non-Hispanic householders$301,933 Black or African American householders$181,699 American Indian or Alaska Native householders $323,114 Asian householders$202,465 Some other race householders$328,513 Two or more races householders$332,666 Hispanic or Latino householders
Median age by race in Reynoldsburg
44.8 Median age for White residents42.4 48.6 35.9 Median age for Black or African American residents32.4 38.9 -691,029,899.6 Median age for American Indian / Alaska Native residents-670,953,911.4 -732,121,211.4 32.0 Median age for Asian residents30.9 33.1 -497,206,703.4 Median age for Native Hawaiian / Pacific Islander residents-544,891,640.3 -805,394,989.6 16.0 Median age for Other race residents30.1 11.7 19.5 Median age for Two or more races residents20.2 16.0 45.8 Median age for White alone residents42.7 49.5 15.3 Median age for Hispanic or Latino residents15.0 15.7
Owner/renter occupied households by race in Reynoldsburg
House owners and renters - White residents 7,110 72.1% Owner occupied2,748 27.9% Renter occupiedHouse owners and renters - Black or African American residents 1,889 44.2% Owner occupied2,385 55.8% Renter occupiedHouse owners and renters - Asian residents 422 59.0% Owner occupied293 41.0% Renter occupiedHouse owners and renters - Other race residents 102 18.1% Owner occupied460 81.9% Renter occupiedHouse owners and renters - Two or more races residents 978 74.1% Owner occupied342 25.9% Renter occupiedHouse owners and renters - White alone residents 7,057 72.7% Owner occupied2,652 27.3% Renter occupiedHouse owners and renters - Hispanic or Latino residents 260 29.7% Owner occupied616 70.3% Renter occupied
Language usage in Reynoldsburg
English speakers - Total 81.6% of residents of Reynoldsburg speak English at home.
6.0% of residents speak Spanish at home 1,375 59.7% Speak English very well930 40.3% Speak English less than very well12.6% of residents speak other language at home 2,617 54.2% Speak English very well2,211 45.8% Speak English less than very well
English speakers - Born in the United States 92.6% of residents of Reynoldsburg speak English at home.
3.4% of residents speak Spanish at home 320 100.0% Speak English very well3.8% of residents speak other language at home 281 78.1% Speak English very well79 21.9% Speak English less than very well
English speakers - Native, born elsewhere 40.6% of residents of Reynoldsburg speak English at home.
48.4% of residents speak Spanish at home 81 31.8% Speak English very well174 68.2% Speak English less than very well11.8% of residents speak other language at home 19 30.6% Speak English very well43 69.4% Speak English less than very well
English speakers - Foreign-born 11.8% of residents of Reynoldsburg speak English at home.
16.1% of residents speak Spanish at home 256 29.9% Speak English very well599 70.1% Speak English less than very well72.4% of residents speak other language at home 1,859 48.5% Speak English very well1,977 51.5% Speak English less than very well
White (Caucasian) - Speak only English Native:
97.7% (18,884)Foreign-born:
29.4% (135)
White (Caucasian) - Speak another language Native:
2.3% (442)Foreign-born:
70.8% (325)
Black or African American - Speak only English Native:
93.4% (8,718)Foreign-born:
16.1% (272)
Black or African American - Speak another language Native:
6.6% (617)Foreign-born:
84.1% (1,422)
Asian - Speak only English Native:
15.0% (76)Foreign-born:
6.3% (124)
Asian - Speak another language Native:
73.4% (371)Foreign-born:
95.6% (1,868)
Other race - Speak only English Native:
13.7% (109)Foreign-born:
2.0% (19)
Other race - Speak another language Native:
100.0% (791)Foreign-born:
98.9% (926)
Two or more races - Speak only English Native:
90.8% (2,822)Foreign-born:
23.8% (88)
Two or more races - Speak another language Native:
9.2% (286)Foreign-born:
76.3% (283)
White alone - Speak only English Native:
98.1% (18,682)Foreign-born:
28.1% (139)
White alone - Speak another language Native:
1.9% (372)Foreign-born:
71.3% (351)
Hispanic or Latino - Speak only English Native:
34.9% (608)Foreign-born:
5.5% (50)
Hispanic or Latino - Speak another language Native:
69.5% (1,212)Foreign-born:
94.3% (845)
Foreign-born residents in Reynoldsburg 5,259 residents are foreign born (5.1% Asia , 3.7% Africa , 2.6% Latin America ).
Marital status for residents in Reynoldsburg Marital status - White (Caucasian) population 15 years and over
Males 32.0% Never married51.1% Now married0.7% Separated3.7% Widowed12.4% DivorcedFemales 21.1% Never married47.5% Now married0.8% Separated12.6% Widowed17.9% DivorcedWomen who gave birth in the past 12 months Now married:
48.2% (105)Unmarried:
51.8% (112)
Women who did not give birth in the past 12 months Now married:
45.7% (1,870)Unmarried:
54.3% (2,223)
Marital status - Black or African American population 15 years and over
Males 49.4% Never married37.9% Now married4.4% Separated2.2% Widowed6.2% DivorcedFemales 43.2% Never married34.1% Now married0.4% Separated3.7% Widowed18.6% DivorcedWomen who gave birth in the past 12 months Now married:
29.9% (39)Unmarried:
70.1% (91)
Women who did not give birth in the past 12 months Now married:
30.7% (881)Unmarried:
69.3% (1,986)
Marital status - Asian population 15 years and over
Males 30.5% Never married67.2% Now married0.0% Separated2.3% Widowed0.0% DivorcedFemales 18.5% Never married60.9% Now married4.6% Separated11.8% Widowed4.2% DivorcedWomen who gave birth in the past 12 months Now married:
100.0% (61)Unmarried:
0.0% (0)
Women who did not give birth in the past 12 months Now married:
66.0% (424)Unmarried:
34.0% (219)
Marital status - Other race population 15 years and over
Males 34.8% Never married32.9% Now married10.5% Separated0.0% Widowed21.7% DivorcedFemales 65.8% Never married21.9% Now married12.2% Separated0.0% Widowed0.0% DivorcedWomen who gave birth in the past 12 months Now married:
45.0% (43)Unmarried:
55.0% (53)
Women who did not give birth in the past 12 months Now married:
21.0% (69)Unmarried:
79.0% (258)
Marital status - Two or more races population 15 years and over
Males 47.3% Never married46.2% Now married3.6% Separated0.0% Widowed2.9% DivorcedFemales 47.2% Never married39.9% Now married3.4% Separated1.5% Widowed8.0% DivorcedWomen who gave birth in the past 12 months Now married:
31.0% (33)Unmarried:
69.0% (73)
Women who did not give birth in the past 12 months Now married:
39.6% (257)Unmarried:
60.4% (392)
Marital status - White alone, not Hispanic / Latino population 15 years and over
Males 31.7% Never married51.2% Now married0.7% Separated3.8% Widowed12.6% DivorcedFemales 21.1% Never married47.3% Now married0.9% Separated12.2% Widowed18.5% DivorcedWomen who gave birth in the past 12 months Now married:
57.7% (106)Unmarried:
42.3% (78)
Women who did not give birth in the past 12 months Now married:
44.2% (1,761)Unmarried:
55.8% (2,222)
Marital status - Hispanic or Latino population 15 years and over
Males 41.5% Never married34.5% Now married7.8% Separated0.0% Widowed16.1% DivorcedFemales 38.8% Never married43.3% Now married7.2% Separated7.9% Widowed2.8% DivorcedWomen who gave birth in the past 12 months Now married:
30.9% (64)Unmarried:
69.1% (144)
Women who did not give birth in the past 12 months Now married:
58.4% (348)Unmarried:
41.6% (248)
Ancestries in Reynoldsburg
2,037 8.8% German1,722 7.5% English1,300 5.6% American1,035 4.5% African914 4.0% Irish703 3.1% European580 2.5% Ethiopian449 1.9% Italian263 1.1% Polish219 1.0% Haitian211 0.9% Czech179 0.8% Ghanaian143 0.6% Welsh136 0.6% Romanian118 0.5% French110 0.5% Hungarian107 0.5% Scotch-Irish102 0.4% Jordanian97 0.4% Portuguese73 0.3% Nigerian67 0.3% Scottish55 0.2% Jamaican42 0.2% Canadian38 0.2% Scandinavian38 0.2% Turkish29 0.1% British28 0.1% Norwegian27 0.1% Pennsylvania German24 0.1% Eastern European24 0.1% Swedish24 0.1% Russian21 0.09% Greek16 0.07% Ukrainian15 0.07% West Indian13 0.06% Slovene12 0.05% Dutch10 0.04% Iranian7 0.03% Serbian7 0.03% Slovak5 0.02% Arab5 0.02% Swiss4 0.02% Latvian2 0.01% Czechoslovakian
Geographical mobility in Reynoldsburg Same house 1 year ago 18,583 90.2% White (Caucasian)9,684 83.2% Black or African American2,307 85.0% Asian1,691 83.4% Other race3,453 89.4% Two or more races18,443 90.8% White alone, not Hispanic / Latino2,524 81.8% Hispanic or LatinoMoved within same county 797 3.9% White / Caucasian1,097 9.4% Black or African American250 9.2% Asian53 1.4% Two or more races767 3.8% White alone, not Hispanic / Latino55 1.8% Hispanic or LatinoMoved within same state 901 4.4% White / Caucasian357 3.1% Black or African American194 7.2% Asian104 5.1% Other race375 9.7% Two or more races813 4.0% White alone, not Hispanic / Latino239 7.7% Hispanic or LatinoMoved from different state 339 1.6% White / Caucasian215 1.8% Black or African American60 2.2% Asian60 2.9% Other race21 0.6% Two or more races268 1.3% White alone, not Hispanic / Latino113 3.7% Hispanic or LatinoMoved from abroad 4 0.0% White234 2.0% Black or African American188 9.3% Other race5 0.0% White alone, not Hispanic / Latino131 4.3% Hispanic or Latino
Children Nativity (place of birth) in Reynoldsburg
Children under 6 years - Living with two parents Both parents native 1,033 100.0% NativeBoth parents foreign-born 419 95.8% Native18 4.2% Foreign-bornOne native, one foreign-born parent 419 100.0% NativeChildren under 6 years - Living with one parent Native parent 864 100.0% NativeForeign-born parent 251 75.1% Native83 24.9% Foreign-bornChildren 6 to 17 years - Living with two parents Both parents native 2,374 99.9% Native3 0.1% Foreign-bornBoth parents foreign-born 857 79.4% Native222 20.6% Foreign-bornOne native, one foreign-born parent 262 100.0% NativeChildren 6 to 17 years - Living with one parent Native parent 2,491 98.8% Native30 1.2% Foreign-bornForeign-born parent 322 69.5% Native141 30.5% Foreign-born
Grandparents responsible for own grandchildren in Reynoldsburg
Grandparents (30 to 59 years) White / Caucasian 49 70.1% Responsible for grandchildren21 29.9% Not responsible for grandchildrenBlack or African American 19 100.0% Responsible for grandchildrenAsian 31 100.0% Not responsible for grandchildrenWhite alone, not Hispanic / Latino 50 69.5% Responsible for grandchildren22 30.5% Not responsible for grandchildrenGrandparents (60 years and over) White / Caucasian 75 35.5% Responsible for grandchildren136 64.5% Not responsible for grandchildrenBlack or African American 260 100.0% Not responsible for grandchildrenAsian 112 100.0% Not responsible for grandchildrenWhite alone, not Hispanic / Latino 76 38.9% Responsible for grandchildren119 61.1% Not responsible for grandchildren