Races in Reno, Nevada (NV) Detailed Stats
Data:
Races - White alone (%)
Races - White alone (% change since 2000)
Races - Black alone (%)
Races - Black alone (% change since 2000)
Races - American Indian alone (%)
Races - American Indian alone (% change since 2000)
Races - Asian alone (%)
Races - Asian alone (% change since 2000)
Races - Hispanic (%)
Races - Hispanic (% change since 2000)
Races - Native Hawaiian and Other Pacific Islander alone (%)
Races - Native Hawaiian and Other Pacific Islander alone (% change since 2000)
Races - Two or more races(%)
Races - Two or more races(% change since 2000)
Races - Other race alone (%)
Races - Other race alone (% change since 2000)
Racial diversity
Place of birth - Born in state of residence (%)
Place of birth - Born in state of residence (%) - White
Place of birth - Born in state of residence (%) - Black or African American
Place of birth - Born in state of residence (%) - Asian
Place of birth - Born in state of residence (%) - Hispanic or Latino
Place of birth - Born in state of residence (%) - American Indian and Alaska Native
Place of birth - Born in state of residence (%) - Multirace
Place of birth - Born in state of residence (%) - Other Race
Place of birth - Born in other state (%)
Place of birth - Born in other state (%) - White
Place of birth - Born in other state (%) - Black or African American
Place of birth - Born in other state (%) - Asian
Place of birth - Born in other state (%) - Hispanic or Latino
Place of birth - Born in other state (%) - American Indian and Alaska Native
Place of birth - Born in other state (%) - Multirace
Place of birth - Born in other state (%) - Other Race
Place of birth - Native, outside of US (%)
Place of birth - Native, outside of US (%) - White
Place of birth - Native, outside of US (%) - Black or African American
Place of birth - Native, outside of US (%) - Asian
Place of birth - Native, outside of US (%) - Hispanic or Latino
Place of birth - Native, outside of US (%) - American Indian and Alaska Native
Place of birth - Native, outside of US (%) - Multirace
Place of birth - Native, outside of US (%) - Other Race
Place of birth - Foreign born (%)
Place of birth - Foreign born (%) - White
Place of birth - Foreign born (%) - Black or African American
Place of birth - Foreign born (%) - Asian
Place of birth - Foreign born (%) - Hispanic or Latino
Place of birth - Foreign born (%) - American Indian and Alaska Native
Place of birth - Foreign born (%) - Multirace
Place of birth - Foreign born (%) - Other Race
Residents speaking English at home (%)
Residents speaking English at home - Born in the United States (%)
Residents speaking English at home - Native, born elsewhere (%)
Residents speaking English at home - Foreign born (%)
Residents speaking Spanish at home (%)
Residents speaking Spanish at home - Born in the United States (%)
Residents speaking Spanish at home - Native, born elsewhere (%)
Residents speaking Spanish at home - Foreign born (%)
Residents speaking other language at home (%)
Residents speaking other language at home - Born in the United States (%)
Residents speaking other language at home - Native, born elsewhere (%)
Residents speaking other language at home - Foreign born (%)
Marital status - Never married (%)
Marital status - Now married (%)
Marital status - Separated (%)
Marital status - Widowed (%)
Marital status - Divorced (%)
Ancestries Reported - Arab (%)
Ancestries Reported - Czech (%)
Ancestries Reported - Danish (%)
Ancestries Reported - Dutch (%)
Ancestries Reported - English (%)
Ancestries Reported - French (%)
Ancestries Reported - French Canadian (%)
Ancestries Reported - German (%)
Ancestries Reported - Greek (%)
Ancestries Reported - Hungarian (%)
Ancestries Reported - Irish (%)
Ancestries Reported - Italian (%)
Ancestries Reported - Lithuanian (%)
Ancestries Reported - Norwegian (%)
Ancestries Reported - Polish (%)
Ancestries Reported - Portuguese (%)
Ancestries Reported - Russian (%)
Ancestries Reported - Scotch-Irish (%)
Ancestries Reported - Scottish (%)
Ancestries Reported - Slovak (%)
Ancestries Reported - Subsaharan African (%)
Ancestries Reported - Swedish (%)
Ancestries Reported - Swiss (%)
Ancestries Reported - Ukrainian (%)
Ancestries Reported - United States (%)
Ancestries Reported - Welsh (%)
Ancestries Reported - West Indian (%)
Ancestries Reported - Other (%)
Geographical mobility - Same house 1 year ago (%)
Geographical mobility - Same house 1 year ago (%) - White
Geographical mobility - Same house 1 year ago (%) - Black or African American
Geographical mobility - Same house 1 year ago (%) - Asian
Geographical mobility - Same house 1 year ago (%) - Hispanic or Latino
Geographical mobility - Same house 1 year ago (%) - American Indian and Alaska Native
Geographical mobility - Same house 1 year ago (%) - Multirace
Geographical mobility - Same house 1 year ago (%) - Other Race
Geographical mobility - Moved within same county (%)
Geographical mobility - Moved within same county (%) - White
Geographical mobility - Moved within same county (%) - Black or African American
Geographical mobility - Moved within same county (%) - Asian
Geographical mobility - Moved within same county (%) - Hispanic or Latino
Geographical mobility - Moved within same county (%) - American Indian and Alaska Native
Geographical mobility - Moved within same county (%) - Multirace
Geographical mobility - Moved within same county (%) - Other Race
Geographical mobility - Moved from different county within same state (%)
Geographical mobility - Moved from different county within same state (%) - White
Geographical mobility - Moved from different county within same state (%) - Black or African American
Geographical mobility - Moved from different county within same state (%) - Asian
Geographical mobility - Moved from different county within same state (%) - Hispanic or Latino
Geographical mobility - Moved from different county within same state (%) - American Indian and Alaska Native
Geographical mobility - Moved from different county within same state (%) - Multirace
Geographical mobility - Moved from different county within same state (%) - Other Race
Geographical mobility - Moved from different state (%)
Geographical mobility - Moved from different state (%) - White
Geographical mobility - Moved from different state (%) - Black or African American
Geographical mobility - Moved from different state (%) - Asian
Geographical mobility - Moved from different state (%) - Hispanic or Latino
Geographical mobility - Moved from different state (%) - American Indian and Alaska Native
Geographical mobility - Moved from different state (%) - Multirace
Geographical mobility - Moved from different state (%) - Other Race
Geographical mobility - Moved from abroad (%)
Geographical mobility - Moved from abroad (%) - White
Geographical mobility - Moved from abroad (%) - Black or African American
Geographical mobility - Moved from abroad (%) - Asian
Geographical mobility - Moved from abroad (%) - Hispanic or Latino
Geographical mobility - Moved from abroad (%) - American Indian and Alaska Native
Geographical mobility - Moved from abroad (%) - Multirace
Geographical mobility - Moved from abroad (%) - Other Race
Place of birth for the foreign-born population - Ireland (%)
Place of birth for the foreign-born population - Denmark (%)
Place of birth for the foreign-born population - Norway (%)
Place of birth for the foreign-born population - Sweden (%)
Place of birth for the foreign-born population - United Kingdom (%)
Place of birth for the foreign-born population - England (%)
Place of birth for the foreign-born population - Scotland (%)
Place of birth for the foreign-born population - Other Northern Europe (%)
Place of birth for the foreign-born population - Austria (%)
Place of birth for the foreign-born population - Belgium (%)
Place of birth for the foreign-born population - France (%)
Place of birth for the foreign-born population - Germany (%)
Place of birth for the foreign-born population - Netherlands (%)
Place of birth for the foreign-born population - Switzerland (%)
Place of birth for the foreign-born population - Other Western Europe (%)
Place of birth for the foreign-born population - Greece (%)
Place of birth for the foreign-born population - Italy (%)
Place of birth for the foreign-born population - Portugal (%)
Place of birth for the foreign-born population - Spain (%)
Place of birth for the foreign-born population - Other Southern Europe (%)
Place of birth for the foreign-born population - Albania (%)
Place of birth for the foreign-born population - Belarus (%)
Place of birth for the foreign-born population - Bosnia and Herzegovina (%)
Place of birth for the foreign-born population - Bulgaria (%)
Place of birth for the foreign-born population - Croatia (%)
Place of birth for the foreign-born population - Czechoslovakia (%)
Place of birth for the foreign-born population - Hungary (%)
Place of birth for the foreign-born population - Latvia (%)
Place of birth for the foreign-born population - Lithuania (%)
Place of birth for the foreign-born population - North Macedonia (Macedonia) (%)
Place of birth for the foreign-born population - Moldova (%)
Place of birth for the foreign-born population - Poland (%)
Place of birth for the foreign-born population - Romania (%)
Place of birth for the foreign-born population - Russia (%)
Place of birth for the foreign-born population - Serbia (%)
Place of birth for the foreign-born population - Ukraine (%)
Place of birth for the foreign-born population - Other Eastern Europe (%)
Place of birth for the foreign-born population - China (%)
Place of birth for the foreign-born population - Hong Kong (%)
Place of birth for the foreign-born population - Taiwan (%)
Place of birth for the foreign-born population - Japan (%)
Place of birth for the foreign-born population - Korea (%)
Place of birth for the foreign-born population - Other Eastern Asia (%)
Place of birth for the foreign-born population - Afghanistan (%)
Place of birth for the foreign-born population - Bangladesh (%)
Place of birth for the foreign-born population - India (%)
Place of birth for the foreign-born population - Iran (%)
Place of birth for the foreign-born population - Kazakhstan (%)
Place of birth for the foreign-born population - Nepal (%)
Place of birth for the foreign-born population - Pakistan (%)
Place of birth for the foreign-born population - Sri Lanka (%)
Place of birth for the foreign-born population - Uzbekistan (%)
Place of birth for the foreign-born population - Other South Central Asia (%)
Place of birth for the foreign-born population - Burma (%)
Place of birth for the foreign-born population - Cambodia (%)
Place of birth for the foreign-born population - Indonesia (%)
Place of birth for the foreign-born population - Laos (%)
Place of birth for the foreign-born population - Malaysia (%)
Place of birth for the foreign-born population - Philippines (%)
Place of birth for the foreign-born population - Singapore (%)
Place of birth for the foreign-born population - Thailand (%)
Place of birth for the foreign-born population - Vietnam (%)
Place of birth for the foreign-born population - Other South Eastern Asia (%)
Place of birth for the foreign-born population - Armenia (%)
Place of birth for the foreign-born population - Iraq (%)
Place of birth for the foreign-born population - Israel (%)
Place of birth for the foreign-born population - Jordan (%)
Place of birth for the foreign-born population - Kuwait (%)
Place of birth for the foreign-born population - Lebanon (%)
Place of birth for the foreign-born population - Saudi Arabia (%)
Place of birth for the foreign-born population - Syria (%)
Place of birth for the foreign-born population - Turkey (%)
Place of birth for the foreign-born population - Yemen (%)
Place of birth for the foreign-born population - Other Western Asia (%)
Place of birth for the foreign-born population - Eritrea (%)
Place of birth for the foreign-born population - Ethiopia (%)
Place of birth for the foreign-born population - Kenya (%)
Place of birth for the foreign-born population - Somalia (%)
Place of birth for the foreign-born population - Uganda (%)
Place of birth for the foreign-born population - Zimbabwe (%)
Place of birth for the foreign-born population - Other Eastern Africa (%)
Place of birth for the foreign-born population - Cameroon (%)
Place of birth for the foreign-born population - Congo (%)
Place of birth for the foreign-born population - Democratic Republic of Congo (Zaire) (%)
Place of birth for the foreign-born population - Other Middle Africa (%)
Place of birth for the foreign-born population - Egypt (%)
Place of birth for the foreign-born population - Morocco (%)
Place of birth for the foreign-born population - Sudan (%)
Place of birth for the foreign-born population - Other Northern Africa (%)
Place of birth for the foreign-born population - South Africa (%)
Place of birth for the foreign-born population - Other Southern Africa (%)
Place of birth for the foreign-born population - Cabo Verde (%)
Place of birth for the foreign-born population - Ghana (%)
Place of birth for the foreign-born population - Liberia (%)
Place of birth for the foreign-born population - Nigeria (%)
Place of birth for the foreign-born population - Senegal (%)
Place of birth for the foreign-born population - Sierra Leone (%)
Place of birth for the foreign-born population - Other Western Africa (%)
Place of birth for the foreign-born population - Australia (%)
Place of birth for the foreign-born population - New Zealand (%)
Place of birth for the foreign-born population - Fiji (%)
Place of birth for the foreign-born population - Micronesia (%)
Place of birth for the foreign-born population - Bahamas (%)
Place of birth for the foreign-born population - Barbados (%)
Place of birth for the foreign-born population - Cuba (%)
Place of birth for the foreign-born population - Dominica (%)
Place of birth for the foreign-born population - Dominican Republic (%)
Place of birth for the foreign-born population - Grenada (%)
Place of birth for the foreign-born population - Haiti (%)
Place of birth for the foreign-born population - Jamaica (%)
Place of birth for the foreign-born population - St. Vincent and the Grenadines (%)
Place of birth for the foreign-born population - Trinidad and Tobago (%)
Place of birth for the foreign-born population - West Indies (%)
Place of birth for the foreign-born population - Other Caribbean (%)
Place of birth for the foreign-born population - Belize (%)
Place of birth for the foreign-born population - Costa Rica (%)
Place of birth for the foreign-born population - El Salvador (%)
Place of birth for the foreign-born population - Guatemala (%)
Place of birth for the foreign-born population - Honduras (%)
Place of birth for the foreign-born population - Mexico (%)
Place of birth for the foreign-born population - Nicaragua (%)
Place of birth for the foreign-born population - Panama (%)
Place of birth for the foreign-born population - Other Central America (%)
Place of birth for the foreign-born population - Argentina (%)
Place of birth for the foreign-born population - Bolivia (%)
Place of birth for the foreign-born population - Brazil (%)
Place of birth for the foreign-born population - Chile (%)
Place of birth for the foreign-born population - Colombia (%)
Place of birth for the foreign-born population - Ecuador (%)
Place of birth for the foreign-born population - Guyana (%)
Place of birth for the foreign-born population - Peru (%)
Place of birth for the foreign-born population - Uruguay (%)
Place of birth for the foreign-born population - Venezuela (%)
Place of birth for the foreign-born population - Other South America (%)
Place of birth for the foreign-born population - Canada (%)
Place of birth for the foreign-born population - Other Northern America (%)
Place of birth for the foreign-born population - Other (%)
Latest news about races in Reno, NV collected exclusively by city-data.com from local newspapers, TV, and radio stations
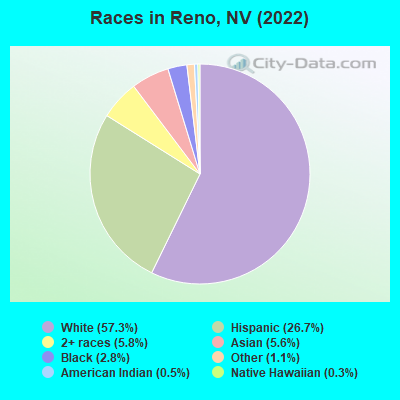
According to 2022 data, the most numerous races in Reno, NV are White alone (156,649 residents), Hispanic (72,892 residents), and Black alone (7,599 residents). 78.5% of Reno residents speak English at home. 15.8% of Reno, NV residents are foreign-born (8.0% born in Latin America, 5.2% born in Asia), which is 14.1% less than the foreign-born rate of 18.0% across the entire state of Nevada.
Race distribution in Reno
2000 2022
124,870 69.2% White alone 34,616 19.2% Hispanic 9,423 5.2% Asian alone 4,414 2.4% Black alone 4,164 2.3% Two or more races 1,772 1.0% American Indian alone 971 0.5% Native Hawaiian and Other 250 0.1% Other race alone
156,649 57.3% White alone 72,892 26.7% Hispanic 15,831 5.8% Two or more races 15,339 5.6% Asian alone 7,599 2.8% Black alone 2,961 1.1% Other race alone 1,345 0.5% American Indian alone 831 0.3% Native Hawaiian and Other
2000 2022
1,303,001 65.2% White alone 393,970 19.7% Hispanic 131,509 6.6% Black alone 88,593 4.4% Asian alone 49,231 2.5% Two or more races 21,397 1.1% American Indian alone 7,769 0.4% Native Hawaiian and Other 2,787 0.1% Other race alone
1,410,145 44.4% White alone 961,357 30.3% Hispanic 286,471 9.0% Black alone 281,149 8.8% Asian alone 182,151 5.7% Two or more races 20,102 0.6% Native Hawaiian and Other 18,781 0.6% Other race alone 17,616 0.6% American Indian alone
Income and house value in Reno Median household income in 2022 $74,211 White non-Hispanic householders$53,758 Black householders$79,470 American Indian and Alaska Native householders$64,042 Asian householders$99,805 Native Hawaiian and other Pacific Islander householders$70,996 Some other race householders$67,698 Two or more races householders$70,476 Hispanic or Latino race householdersMedian 2022 house value $592,866 White Non-Hispanic householders$488,887 Black or African American householders$489,616 American Indian or Alaska Native householders $576,448 Asian householders$444,011 Native Hawaiian and other Pacific Islander householders$458,605 Some other race householders$533,762 Two or more races householders$481,590 Hispanic or Latino householders
Median age by race in Reno
42.3 Median age for White residents42.5 42.1 37.3 Median age for Black or African American residents37.5 33.9 36.9 Median age for American Indian / Alaska Native residents36.8 45.1 42.0 Median age for Asian residents37.2 43.5 42.7 Median age for Native Hawaiian / Pacific Islander residents52.4 36.5 31.1 Median age for Other race residents30.7 33.5 25.8 Median age for Two or more races residents25.8 25.8 43.4 Median age for White alone residents43.1 44.2 28.3 Median age for Hispanic or Latino residents29.2 26.8
Owner/renter occupied households by race in Reno
House owners and renters - White residents 43,230 53.9% Owner occupied37,044 46.1% Renter occupiedHouse owners and renters - Black or African American residents 667 21.3% Owner occupied2,470 78.7% Renter occupiedHouse owners and renters - American Indian / Alaska Native residents 519 38.2% Owner occupied841 61.8% Renter occupiedHouse owners and renters - Asian residents 3,223 55.6% Owner occupied2,577 44.4% Renter occupiedHouse owners and renters - Native Hawaiian / Pacific Islander residents 304 39.9% Owner occupied458 60.1% Renter occupiedHouse owners and renters - Other race residents 4,001 39.7% Owner occupied6,084 60.3% Renter occupiedHouse owners and renters - Two or more races residents 5,472 42.1% Owner occupied7,530 57.9% Renter occupiedHouse owners and renters - White alone residents 41,960 54.5% Owner occupied35,095 45.5% Renter occupiedHouse owners and renters - Hispanic or Latino residents 8,005 37.9% Owner occupied13,113 62.1% Renter occupied
Language usage in Reno
English speakers - Total 78.5% of residents of Reno speak English at home.
16.2% of residents speak Spanish at home 25,872 61.2% Speak English very well16,383 38.8% Speak English less than very well5.4% of residents speak other language at home 9,921 70.7% Speak English very well4,116 29.3% Speak English less than very well
English speakers - Born in the United States 92.1% of residents of Reno speak English at home.
6.8% of residents speak Spanish at home 7,895 85.2% Speak English very well1,376 14.8% Speak English less than very well1.1% of residents speak other language at home 1,356 92.6% Speak English very well108 7.4% Speak English less than very well
English speakers - Native, born elsewhere 49.1% of residents of Reno speak English at home.
37.2% of residents speak Spanish at home 1,576 66.9% Speak English very well779 33.1% Speak English less than very well13.7% of residents speak other language at home 800 92.5% Speak English very well65 7.5% Speak English less than very well
English speakers - Foreign-born 28.5% of residents of Reno speak English at home.
47.2% of residents speak Spanish at home 7,369 37.5% Speak English very well12,304 62.5% Speak English less than very well24.3% of residents speak other language at home 6,271 61.8% Speak English very well3,870 38.2% Speak English less than very well
White (Caucasian) - Speak only English Native:
95.8% (149,102)Foreign-born:
42.9% (2,901)
White (Caucasian) - Speak another language Native:
4.2% (6,595)Foreign-born:
57.1% (3,866)
Black or African American - Speak only English Native:
95.2% (7,104)Foreign-born:
24.1% (277)
Black or African American - Speak another language Native:
4.4% (332)Foreign-born:
75.9% (872)
American Indian / Alaska Native - Speak only English Native:
75.5% (1,454)Foreign-born:
12.8% (87)
American Indian / Alaska Native - Speak another language Native:
26.6% (513)Foreign-born:
46.1% (314)
Asian - Speak only English Native:
67.9% (4,091)Foreign-born:
25.7% (2,287)
Asian - Speak another language Native:
32.1% (1,932)Foreign-born:
74.3% (6,604)
Native Hawaiian / Pacific Islander - Speak only English Native:
72.7% (1,157)Foreign-born:
42.4% (199)
Native Hawaiian / Pacific Islander - Speak another language Native:
27.6% (438)Foreign-born:
61.8% (290)
Other race - Speak only English Native:
52.7% (7,715)Foreign-born:
39.6% (6,220)
Other race - Speak another language Native:
47.3% (6,928)Foreign-born:
60.4% (9,474)
Two or more races - Speak only English Native:
70.6% (23,667)Foreign-born:
3.5% (307)
Two or more races - Speak another language Native:
29.4% (9,877)Foreign-born:
96.5% (8,500)
White alone - Speak only English Native:
97.9% (144,144)Foreign-born:
55.0% (2,901)
White alone - Speak another language Native:
2.1% (3,152)Foreign-born:
45.0% (2,371)
Hispanic or Latino - Speak only English Native:
51.1% (21,091)Foreign-born:
24.1% (6,292)
Hispanic or Latino - Speak another language Native:
48.9% (20,185)Foreign-born:
75.9% (19,842)
Foreign-born residents in Reno 42,704 residents are foreign born (8.0% Latin America , 5.2% Asia ).
This city:
15.8%Nevada:
19.1%
Marital status for residents in Reno Marital status - White (Caucasian) population 15 years and over
Males 36.9% Never married42.0% Now married0.9% Separated4.0% Widowed16.2% DivorcedFemales 33.9% Never married38.8% Now married1.4% Separated8.2% Widowed17.7% DivorcedWomen who gave birth in the past 12 months Now married:
47.2% (405)Unmarried:
52.8% (453)
Women who did not give birth in the past 12 months Now married:
35.4% (13,095)Unmarried:
64.6% (23,862)
Marital status - Black or African American population 15 years and over
Males 64.5% Never married19.4% Now married0.0% Separated0.0% Widowed16.2% DivorcedFemales 43.7% Never married14.8% Now married11.4% Separated11.3% Widowed18.8% DivorcedWomen who gave birth in the past 12 months Now married:
39.1% (8)Unmarried:
60.9% (12)
Women who did not give birth in the past 12 months Now married:
23.7% (468)Unmarried:
76.3% (1,505)
Marital status - American Indian / Alaska Native population 15 years and over
Males 48.2% Never married22.2% Now married0.0% Separated1.3% Widowed28.3% DivorcedFemales 39.7% Never married25.2% Now married2.5% Separated8.5% Widowed24.1% DivorcedWomen who gave birth in the past 12 months Now married:
100.0% (37)Unmarried:
0.0% (0)
Women who did not give birth in the past 12 months Now married:
33.0% (250)Unmarried:
67.0% (508)
Marital status - Asian population 15 years and over
Males 39.4% Never married45.2% Now married2.4% Separated0.0% Widowed13.1% DivorcedFemales 23.9% Never married49.3% Now married0.5% Separated6.9% Widowed19.4% DivorcedWomen who gave birth in the past 12 months Now married:
100.0% (222)Unmarried:
0.0% (0)
Women who did not give birth in the past 12 months Now married:
42.8% (1,820)Unmarried:
57.2% (2,429)
Marital status - Native Hawaiian / Pacific Islander population 15 years and over
Males 35.1% Never married52.2% Now married0.0% Separated0.6% Widowed12.1% DivorcedFemales 38.6% Never married48.6% Now married0.0% Separated6.7% Widowed6.0% DivorcedWomen who gave birth in the past 12 months Now married:
31.4% (23)Unmarried:
68.6% (51)
Women who did not give birth in the past 12 months Now married:
46.9% (301)Unmarried:
53.1% (342)
Marital status - Other race population 15 years and over
Males 49.0% Never married40.9% Now married4.1% Separated0.3% Widowed5.8% DivorcedFemales 39.1% Never married52.7% Now married1.8% Separated5.6% Widowed0.8% DivorcedWomen who gave birth in the past 12 months Now married:
43.8% (160)Unmarried:
56.2% (205)
Women who did not give birth in the past 12 months Now married:
48.2% (3,613)Unmarried:
51.8% (3,888)
Marital status - Two or more races population 15 years and over
Males 61.8% Never married27.2% Now married0.0% Separated1.0% Widowed10.0% DivorcedFemales 50.5% Never married34.8% Now married2.9% Separated2.7% Widowed9.1% DivorcedWomen who gave birth in the past 12 months Now married:
71.9% (665)Unmarried:
28.1% (260)
Women who did not give birth in the past 12 months Now married:
31.8% (3,609)Unmarried:
68.2% (7,739)
Marital status - White alone, not Hispanic / Latino population 15 years and over
Males 36.2% Never married42.3% Now married0.9% Separated4.0% Widowed16.6% DivorcedFemales 33.0% Never married39.4% Now married1.5% Separated8.5% Widowed17.5% DivorcedWomen who gave birth in the past 12 months Now married:
47.2% (405)Unmarried:
52.8% (453)
Women who did not give birth in the past 12 months Now married:
36.5% (12,490)Unmarried:
63.5% (21,731)
Marital status - Hispanic or Latino population 15 years and over
Males 54.9% Never married36.1% Now married0.6% Separated0.8% Widowed7.7% DivorcedFemales 46.6% Never married40.4% Now married1.7% Separated3.4% Widowed7.9% DivorcedWomen who gave birth in the past 12 months Now married:
66.1% (908)Unmarried:
33.9% (465)
Women who did not give birth in the past 12 months Now married:
34.7% (6,258)Unmarried:
65.3% (11,770)
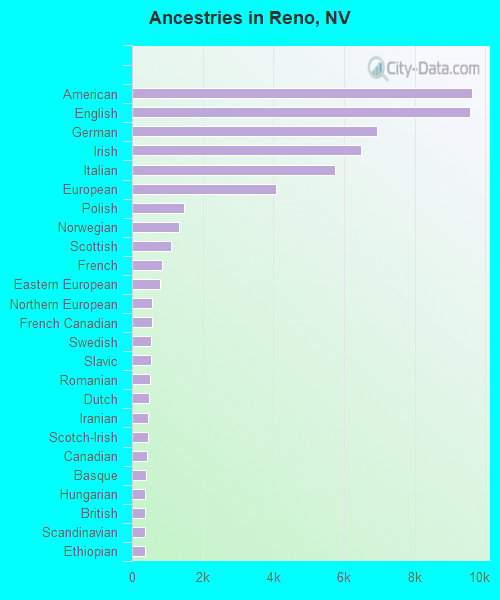
Ancestries in Reno
9,626 6.9% American9,558 6.8% English6,941 5.0% German6,488 4.6% Irish5,756 4.1% Italian4,078 2.9% European1,467 1.1% Polish1,324 0.9% Norwegian1,113 0.8% Scottish854 0.6% French782 0.6% Eastern European559 0.4% Northern European559 0.4% French Canadian547 0.4% Swedish538 0.4% Slavic510 0.4% Romanian473 0.3% Dutch454 0.3% Iranian440 0.3% Scotch-Irish414 0.3% Canadian407 0.3% Basque375 0.3% Hungarian367 0.3% British367 0.3% Scandinavian361 0.3% Ethiopian358 0.3% Swiss349 0.3% Portuguese325 0.2% Nigerian312 0.2% Armenian311 0.2% Czech291 0.2% African284 0.2% Lebanese284 0.2% Russian281 0.2% Greek206 0.1% Kenyan197 0.1% Croatian197 0.1% Danish193 0.1% Lithuanian181 0.1% Haitian147 0.1% Welsh137 0.10% Finnish130 0.09% Serbian124 0.09% Austrian118 0.08% Trinidadian and Tobagonian98 0.07% Syrian91 0.07% Ukrainian88 0.06% Liberian67 0.05% Zimbabwean65 0.05% Australian65 0.05% Yugoslavian64 0.05% Jamaican59 0.04% Bulgarian53 0.04% Assyrian38 0.03% Brazilian34 0.02% Latvian33 0.02% Macedonian31 0.02% Slovene30 0.02% Belgian29 0.02% Slovak26 0.02% Czechoslovakian25 0.02% Moroccan17 0.01% Maltese16 0.01% Cajun14 0.01% Arab13 0.01% Iraqi11 0.01% Icelander10 0.01% Celtic8 0.01% New Zealander7 0.01% Israeli
Geographical mobility in Reno Same house 1 year ago 139,330 83.5% White (Caucasian)6,065 79.1% Black or African American2,128 77.9% American Indian / Alaska Native13,106 83.4% Asian1,955 88.7% Native Hawaiian / Pacific Islander28,148 88.7% Other race35,149 79.3% Two or more races131,104 83.9% White alone, not Hispanic / Latino60,304 84.2% Hispanic or LatinoMoved within same county 17,910 10.7% White / Caucasian661 8.6% Black or African American315 11.5% American Indian / Alaska Native1,428 9.1% Asian153 6.9% Native Hawaiian / Pacific Islander2,285 7.2% Other race6,186 14.0% Two or more races16,194 10.4% White alone, not Hispanic / Latino8,571 12.0% Hispanic or LatinoMoved within same state 3,094 1.9% White / Caucasian227 3.0% Black or African American76 2.8% American Indian / Alaska Native38 0.2% Asian604 1.9% Other race919 2.1% Two or more races2,688 1.7% White alone, not Hispanic / Latino1,151 1.6% Hispanic or LatinoMoved from different state 5,881 3.5% White / Caucasian713 9.3% Black or African American68 2.5% American Indian / Alaska Native893 5.7% Asian97 4.4% Native Hawaiian / Pacific Islander497 1.6% Other race2,057 4.6% Two or more races5,582 3.6% White alone, not Hispanic / Latino1,277 1.8% Hispanic or LatinoMoved from abroad 672 0.4% White244 1.6% Asian197 0.6% Other race672 0.4% White alone, not Hispanic / Latino325 0.5% Hispanic or Latino
Children Nativity (place of birth) in Reno
Children under 6 years - Living with two parents Both parents native 5,419 100.0% NativeBoth parents foreign-born 877 100.0% NativeOne native, one foreign-born parent 1,903 100.0% NativeChildren under 6 years - Living with one parent Native parent 5,238 100.0% NativeForeign-born parent 1,291 95.1% Native66 4.9% Foreign-bornChildren 6 to 17 years - Living with two parents Both parents native 12,976 100.0% NativeBoth parents foreign-born 3,202 92.7% Native252 7.3% Foreign-bornOne native, one foreign-born parent 3,279 100.0% NativeChildren 6 to 17 years - Living with one parent Native parent 10,954 100.0% NativeForeign-born parent 4,022 55.0% Native3,292 45.0% Foreign-born
Place of birth for residents in Reno 22,534 Americas21,603 Latin America19,892 Central America13,905 Asia7,273 South Eastern Asia3,951 Europe3,772 South Central Asia2,325 Eastern Asia1,531 Eastern Europe1,472 China1,468 Africa1,134 Western Europe1,087 South America959 Northern Europe931 Northern America844 Oceania623 Caribbean582 Eastern Africa531 Western Africa512 Western Asia309 Southern Europe220 Middle Africa165 Australia and New Zealand Subregion106 Northern Africa16 Southern Africa14,631 Mexico6,026 Philippines2,489 El Salvador2,053 Guatemala1,753 India1,061 China969 Bangladesh931 Canada752 Vietnam644 Germany581 Iran513 Korea475 Romania357 England354 United Kingdom345 Poland339 Japan323 Nigeria313 Ethiopia304 Colombia295 Honduras275 Cuba265 Thailand264 Taiwan262 Peru249 Nicaragua220 Cameroon179 Ghana174 France172 Ireland170 Micronesia166 Pakistan160 Kenya146 Hong Kong134 Indonesia133 Costa Rica124 Chile123 Armenia122 Brazil121 Netherlands113 Italy106 Austria99 Hungary96 Czechoslovakia94 Israel93 Haiti90 Dominican Republic89 Trinidad and Tobago87 Switzerland87 Australia86 Russia83 Argentina79 Fiji78 New Zealand71 Ukraine68 Lebanon65 Portugal65 Ecuador62 Syria60 Bulgaria60 Spain60 Lithuania58 Bosnia and Herzegovina58 Jamaica58 Eritrea49 Algeria47 Saudi Arabia46 Greece46 Venezuela43 Croatia41 Singapore38 Iraq38 Scotland38 Cambodia36 Uzbekistan34 Marshall Islands32 Nepal31 Egypt31 Zimbabwe28 Afghanistan28 Panama27 Serbia26 Azerbaijan25 United Arab Emirates25 Morocco25 Bolivia23 Moldova19 Liberia18 Kuwait17 Sweden16 South Africa15 Norway14 Kazakhstan13 Malaysia12 Guyana11 Barbados10 Belize9 Latvia9 Uganda8 Azores Islands7 Sri Lanka7 Belarus6 Turkey5 Denmark4 Bahamas
Grandparents responsible for own grandchildren in Reno
Grandparents (30 to 59 years) White / Caucasian 254 47.4% Responsible for grandchildren282 52.6% Not responsible for grandchildrenBlack or African American 189 73.2% Responsible for grandchildren69 26.8% Not responsible for grandchildrenAmerican Indian / Alaska Native 117 100.0% Not responsible for grandchildrenAsian 74 46.8% Responsible for grandchildren84 53.2% Not responsible for grandchildrenNative Hawaiian / Pacific Islander 10 100.0% Not responsible for grandchildrenOther race 140 30.8% Responsible for grandchildren314 69.2% Not responsible for grandchildrenTwo or more races 15 8.8% Responsible for grandchildren156 91.2% Not responsible for grandchildrenWhite alone, not Hispanic / Latino 141 52.1% Responsible for grandchildren130 47.9% Not responsible for grandchildrenHispanic or Latino 371 24.7% Responsible for grandchildren1,130 75.3% Not responsible for grandchildrenGrandparents (60 years and over) White / Caucasian 540 31.0% Responsible for grandchildren1,201 69.0% Not responsible for grandchildrenBlack or African American 15 18.0% Responsible for grandchildren67 82.0% Not responsible for grandchildrenAmerican Indian / Alaska Native 48 62.7% Responsible for grandchildren29 37.3% Not responsible for grandchildrenAsian 60 16.2% Responsible for grandchildren309 83.8% Not responsible for grandchildrenNative Hawaiian / Pacific Islander 39 100.0% Not responsible for grandchildrenOther race 118 39.0% Responsible for grandchildren185 61.0% Not responsible for grandchildrenTwo or more races 154 100.0% Not responsible for grandchildrenWhite alone, not Hispanic / Latino 515 30.0% Responsible for grandchildren1,199 70.0% Not responsible for grandchildrenHispanic or Latino 544 100.0% Not responsible for grandchildren