Races in Red Bud, Georgia (GA) Detailed Stats
Ancestries, Foreign-born residents, place of birth
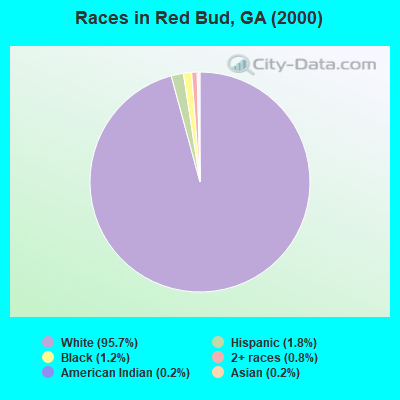
Race distribution in Red Bud

- 5,11895.7%White alone
- 951.8%Hispanic
- 641.2%Black alone
- 440.8%Two or more races
- 120.2%Asian alone
- 130.2%American Indian alone
- 20.04%Other race alone
- 10.02%Native Hawaiian and Other
Pacific Islander alone
2000
2022
-
- 5,128,66162.6%White alone
- 2,331,46528.5%Black alone
- 435,2275.3%Hispanic
- 171,5132.1%Asian alone
- 87,3641.1%Two or more races
- 17,6700.2%American Indian alone
- 11,2750.1%Other race alone
- 3,2780.04%Native Hawaiian and Other
Pacific Islander alone

-
- 5,415,65749.6%White alone
- 3,349,24030.7%Black alone
- 1,132,60410.4%Hispanic
- 479,1564.4%Asian alone
- 462,9234.2%Two or more races
- 54,4160.5%Other race alone
- 11,9230.1%American Indian alone
- 6,9570.06%Native Hawaiian and Other
Pacific Islander alone

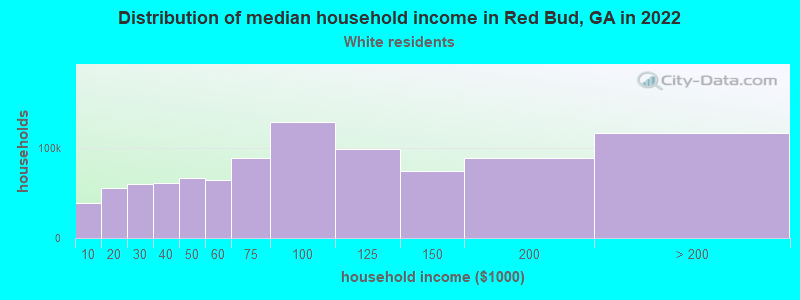
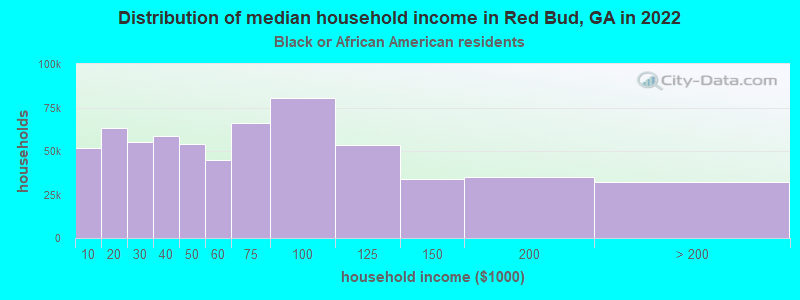
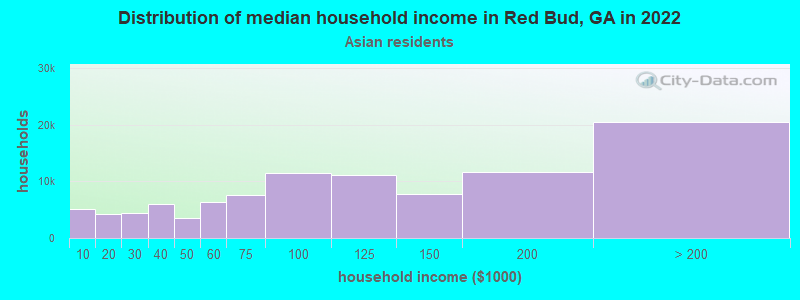
Income and house value in Red Bud
- Median household income in 2022
- $69,420White non-Hispanic householders
- $55,132Black householders
- $134,646Asian householders
- $111,179Some other race householders
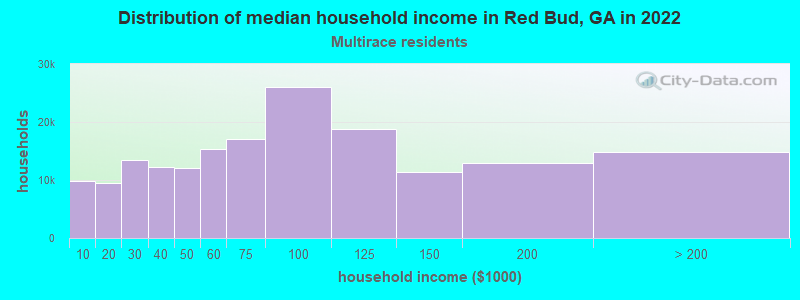
- $99,591Two or more races householders
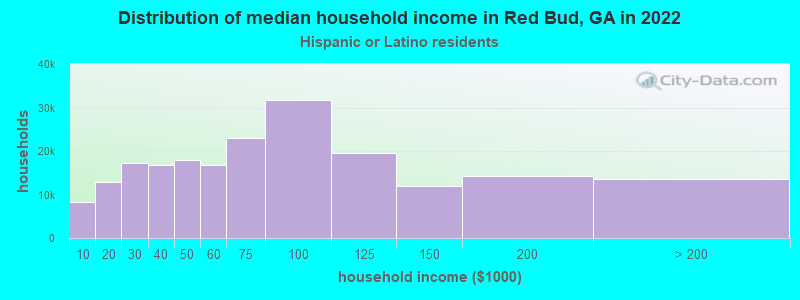
- $99,315Hispanic or Latino race householders
- Median 2022 house value
- $220,094White Non-Hispanic householders
- $193,822Black or African American householders
- $120,636Asian householders
- $227,869Some other race householders
- $214,465Hispanic or Latino householders
Household income for White non-Hispanic householders
Household income for Black householders
Household income for Asian householders
Household income for Two or more races householders
Household income for Hispanic or Latino race householders
Zip code: 30734