Races in Reading, Massachusetts (MA) Detailed Stats
Data:
Races - White alone (%)
Races - White alone (% change since 2000)
Races - Black alone (%)
Races - Black alone (% change since 2000)
Races - American Indian alone (%)
Races - American Indian alone (% change since 2000)
Races - Asian alone (%)
Races - Asian alone (% change since 2000)
Races - Hispanic (%)
Races - Hispanic (% change since 2000)
Races - Native Hawaiian and Other Pacific Islander alone (%)
Races - Native Hawaiian and Other Pacific Islander alone (% change since 2000)
Races - Two or more races(%)
Races - Two or more races(% change since 2000)
Races - Other race alone (%)
Races - Other race alone (% change since 2000)
Racial diversity
Place of birth - Born in state of residence (%)
Place of birth - Born in state of residence (%) - White
Place of birth - Born in state of residence (%) - Black or African American
Place of birth - Born in state of residence (%) - Asian
Place of birth - Born in state of residence (%) - Hispanic or Latino
Place of birth - Born in state of residence (%) - American Indian and Alaska Native
Place of birth - Born in state of residence (%) - Multirace
Place of birth - Born in state of residence (%) - Other Race
Place of birth - Born in other state (%)
Place of birth - Born in other state (%) - White
Place of birth - Born in other state (%) - Black or African American
Place of birth - Born in other state (%) - Asian
Place of birth - Born in other state (%) - Hispanic or Latino
Place of birth - Born in other state (%) - American Indian and Alaska Native
Place of birth - Born in other state (%) - Multirace
Place of birth - Born in other state (%) - Other Race
Place of birth - Native, outside of US (%)
Place of birth - Native, outside of US (%) - White
Place of birth - Native, outside of US (%) - Black or African American
Place of birth - Native, outside of US (%) - Asian
Place of birth - Native, outside of US (%) - Hispanic or Latino
Place of birth - Native, outside of US (%) - American Indian and Alaska Native
Place of birth - Native, outside of US (%) - Multirace
Place of birth - Native, outside of US (%) - Other Race
Place of birth - Foreign born (%)
Place of birth - Foreign born (%) - White
Place of birth - Foreign born (%) - Black or African American
Place of birth - Foreign born (%) - Asian
Place of birth - Foreign born (%) - Hispanic or Latino
Place of birth - Foreign born (%) - American Indian and Alaska Native
Place of birth - Foreign born (%) - Multirace
Place of birth - Foreign born (%) - Other Race
Residents speaking English at home (%)
Residents speaking English at home - Born in the United States (%)
Residents speaking English at home - Native, born elsewhere (%)
Residents speaking English at home - Foreign born (%)
Residents speaking Spanish at home (%)
Residents speaking Spanish at home - Born in the United States (%)
Residents speaking Spanish at home - Native, born elsewhere (%)
Residents speaking Spanish at home - Foreign born (%)
Residents speaking other language at home (%)
Residents speaking other language at home - Born in the United States (%)
Residents speaking other language at home - Native, born elsewhere (%)
Residents speaking other language at home - Foreign born (%)
Marital status - Never married (%)
Marital status - Now married (%)
Marital status - Separated (%)
Marital status - Widowed (%)
Marital status - Divorced (%)
Ancestries Reported - Arab (%)
Ancestries Reported - Czech (%)
Ancestries Reported - Danish (%)
Ancestries Reported - Dutch (%)
Ancestries Reported - English (%)
Ancestries Reported - French (%)
Ancestries Reported - French Canadian (%)
Ancestries Reported - German (%)
Ancestries Reported - Greek (%)
Ancestries Reported - Hungarian (%)
Ancestries Reported - Irish (%)
Ancestries Reported - Italian (%)
Ancestries Reported - Lithuanian (%)
Ancestries Reported - Norwegian (%)
Ancestries Reported - Polish (%)
Ancestries Reported - Portuguese (%)
Ancestries Reported - Russian (%)
Ancestries Reported - Scotch-Irish (%)
Ancestries Reported - Scottish (%)
Ancestries Reported - Slovak (%)
Ancestries Reported - Subsaharan African (%)
Ancestries Reported - Swedish (%)
Ancestries Reported - Swiss (%)
Ancestries Reported - Ukrainian (%)
Ancestries Reported - United States (%)
Ancestries Reported - Welsh (%)
Ancestries Reported - West Indian (%)
Ancestries Reported - Other (%)
Geographical mobility - Same house 1 year ago (%)
Geographical mobility - Same house 1 year ago (%) - White
Geographical mobility - Same house 1 year ago (%) - Black or African American
Geographical mobility - Same house 1 year ago (%) - Asian
Geographical mobility - Same house 1 year ago (%) - Hispanic or Latino
Geographical mobility - Same house 1 year ago (%) - American Indian and Alaska Native
Geographical mobility - Same house 1 year ago (%) - Multirace
Geographical mobility - Same house 1 year ago (%) - Other Race
Geographical mobility - Moved within same county (%)
Geographical mobility - Moved within same county (%) - White
Geographical mobility - Moved within same county (%) - Black or African American
Geographical mobility - Moved within same county (%) - Asian
Geographical mobility - Moved within same county (%) - Hispanic or Latino
Geographical mobility - Moved within same county (%) - American Indian and Alaska Native
Geographical mobility - Moved within same county (%) - Multirace
Geographical mobility - Moved within same county (%) - Other Race
Geographical mobility - Moved from different county within same state (%)
Geographical mobility - Moved from different county within same state (%) - White
Geographical mobility - Moved from different county within same state (%) - Black or African American
Geographical mobility - Moved from different county within same state (%) - Asian
Geographical mobility - Moved from different county within same state (%) - Hispanic or Latino
Geographical mobility - Moved from different county within same state (%) - American Indian and Alaska Native
Geographical mobility - Moved from different county within same state (%) - Multirace
Geographical mobility - Moved from different county within same state (%) - Other Race
Geographical mobility - Moved from different state (%)
Geographical mobility - Moved from different state (%) - White
Geographical mobility - Moved from different state (%) - Black or African American
Geographical mobility - Moved from different state (%) - Asian
Geographical mobility - Moved from different state (%) - Hispanic or Latino
Geographical mobility - Moved from different state (%) - American Indian and Alaska Native
Geographical mobility - Moved from different state (%) - Multirace
Geographical mobility - Moved from different state (%) - Other Race
Geographical mobility - Moved from abroad (%)
Geographical mobility - Moved from abroad (%) - White
Geographical mobility - Moved from abroad (%) - Black or African American
Geographical mobility - Moved from abroad (%) - Asian
Geographical mobility - Moved from abroad (%) - Hispanic or Latino
Geographical mobility - Moved from abroad (%) - American Indian and Alaska Native
Geographical mobility - Moved from abroad (%) - Multirace
Geographical mobility - Moved from abroad (%) - Other Race
Place of birth for the foreign-born population - Ireland (%)
Place of birth for the foreign-born population - Denmark (%)
Place of birth for the foreign-born population - Norway (%)
Place of birth for the foreign-born population - Sweden (%)
Place of birth for the foreign-born population - United Kingdom (%)
Place of birth for the foreign-born population - England (%)
Place of birth for the foreign-born population - Scotland (%)
Place of birth for the foreign-born population - Other Northern Europe (%)
Place of birth for the foreign-born population - Austria (%)
Place of birth for the foreign-born population - Belgium (%)
Place of birth for the foreign-born population - France (%)
Place of birth for the foreign-born population - Germany (%)
Place of birth for the foreign-born population - Netherlands (%)
Place of birth for the foreign-born population - Switzerland (%)
Place of birth for the foreign-born population - Other Western Europe (%)
Place of birth for the foreign-born population - Greece (%)
Place of birth for the foreign-born population - Italy (%)
Place of birth for the foreign-born population - Portugal (%)
Place of birth for the foreign-born population - Spain (%)
Place of birth for the foreign-born population - Other Southern Europe (%)
Place of birth for the foreign-born population - Albania (%)
Place of birth for the foreign-born population - Belarus (%)
Place of birth for the foreign-born population - Bosnia and Herzegovina (%)
Place of birth for the foreign-born population - Bulgaria (%)
Place of birth for the foreign-born population - Croatia (%)
Place of birth for the foreign-born population - Czechoslovakia (%)
Place of birth for the foreign-born population - Hungary (%)
Place of birth for the foreign-born population - Latvia (%)
Place of birth for the foreign-born population - Lithuania (%)
Place of birth for the foreign-born population - North Macedonia (Macedonia) (%)
Place of birth for the foreign-born population - Moldova (%)
Place of birth for the foreign-born population - Poland (%)
Place of birth for the foreign-born population - Romania (%)
Place of birth for the foreign-born population - Russia (%)
Place of birth for the foreign-born population - Serbia (%)
Place of birth for the foreign-born population - Ukraine (%)
Place of birth for the foreign-born population - Other Eastern Europe (%)
Place of birth for the foreign-born population - China (%)
Place of birth for the foreign-born population - Hong Kong (%)
Place of birth for the foreign-born population - Taiwan (%)
Place of birth for the foreign-born population - Japan (%)
Place of birth for the foreign-born population - Korea (%)
Place of birth for the foreign-born population - Other Eastern Asia (%)
Place of birth for the foreign-born population - Afghanistan (%)
Place of birth for the foreign-born population - Bangladesh (%)
Place of birth for the foreign-born population - India (%)
Place of birth for the foreign-born population - Iran (%)
Place of birth for the foreign-born population - Kazakhstan (%)
Place of birth for the foreign-born population - Nepal (%)
Place of birth for the foreign-born population - Pakistan (%)
Place of birth for the foreign-born population - Sri Lanka (%)
Place of birth for the foreign-born population - Uzbekistan (%)
Place of birth for the foreign-born population - Other South Central Asia (%)
Place of birth for the foreign-born population - Burma (%)
Place of birth for the foreign-born population - Cambodia (%)
Place of birth for the foreign-born population - Indonesia (%)
Place of birth for the foreign-born population - Laos (%)
Place of birth for the foreign-born population - Malaysia (%)
Place of birth for the foreign-born population - Philippines (%)
Place of birth for the foreign-born population - Singapore (%)
Place of birth for the foreign-born population - Thailand (%)
Place of birth for the foreign-born population - Vietnam (%)
Place of birth for the foreign-born population - Other South Eastern Asia (%)
Place of birth for the foreign-born population - Armenia (%)
Place of birth for the foreign-born population - Iraq (%)
Place of birth for the foreign-born population - Israel (%)
Place of birth for the foreign-born population - Jordan (%)
Place of birth for the foreign-born population - Kuwait (%)
Place of birth for the foreign-born population - Lebanon (%)
Place of birth for the foreign-born population - Saudi Arabia (%)
Place of birth for the foreign-born population - Syria (%)
Place of birth for the foreign-born population - Turkey (%)
Place of birth for the foreign-born population - Yemen (%)
Place of birth for the foreign-born population - Other Western Asia (%)
Place of birth for the foreign-born population - Eritrea (%)
Place of birth for the foreign-born population - Ethiopia (%)
Place of birth for the foreign-born population - Kenya (%)
Place of birth for the foreign-born population - Somalia (%)
Place of birth for the foreign-born population - Uganda (%)
Place of birth for the foreign-born population - Zimbabwe (%)
Place of birth for the foreign-born population - Other Eastern Africa (%)
Place of birth for the foreign-born population - Cameroon (%)
Place of birth for the foreign-born population - Congo (%)
Place of birth for the foreign-born population - Democratic Republic of Congo (Zaire) (%)
Place of birth for the foreign-born population - Other Middle Africa (%)
Place of birth for the foreign-born population - Egypt (%)
Place of birth for the foreign-born population - Morocco (%)
Place of birth for the foreign-born population - Sudan (%)
Place of birth for the foreign-born population - Other Northern Africa (%)
Place of birth for the foreign-born population - South Africa (%)
Place of birth for the foreign-born population - Other Southern Africa (%)
Place of birth for the foreign-born population - Cabo Verde (%)
Place of birth for the foreign-born population - Ghana (%)
Place of birth for the foreign-born population - Liberia (%)
Place of birth for the foreign-born population - Nigeria (%)
Place of birth for the foreign-born population - Senegal (%)
Place of birth for the foreign-born population - Sierra Leone (%)
Place of birth for the foreign-born population - Other Western Africa (%)
Place of birth for the foreign-born population - Australia (%)
Place of birth for the foreign-born population - New Zealand (%)
Place of birth for the foreign-born population - Fiji (%)
Place of birth for the foreign-born population - Micronesia (%)
Place of birth for the foreign-born population - Bahamas (%)
Place of birth for the foreign-born population - Barbados (%)
Place of birth for the foreign-born population - Cuba (%)
Place of birth for the foreign-born population - Dominica (%)
Place of birth for the foreign-born population - Dominican Republic (%)
Place of birth for the foreign-born population - Grenada (%)
Place of birth for the foreign-born population - Haiti (%)
Place of birth for the foreign-born population - Jamaica (%)
Place of birth for the foreign-born population - St. Vincent and the Grenadines (%)
Place of birth for the foreign-born population - Trinidad and Tobago (%)
Place of birth for the foreign-born population - West Indies (%)
Place of birth for the foreign-born population - Other Caribbean (%)
Place of birth for the foreign-born population - Belize (%)
Place of birth for the foreign-born population - Costa Rica (%)
Place of birth for the foreign-born population - El Salvador (%)
Place of birth for the foreign-born population - Guatemala (%)
Place of birth for the foreign-born population - Honduras (%)
Place of birth for the foreign-born population - Mexico (%)
Place of birth for the foreign-born population - Nicaragua (%)
Place of birth for the foreign-born population - Panama (%)
Place of birth for the foreign-born population - Other Central America (%)
Place of birth for the foreign-born population - Argentina (%)
Place of birth for the foreign-born population - Bolivia (%)
Place of birth for the foreign-born population - Brazil (%)
Place of birth for the foreign-born population - Chile (%)
Place of birth for the foreign-born population - Colombia (%)
Place of birth for the foreign-born population - Ecuador (%)
Place of birth for the foreign-born population - Guyana (%)
Place of birth for the foreign-born population - Peru (%)
Place of birth for the foreign-born population - Uruguay (%)
Place of birth for the foreign-born population - Venezuela (%)
Place of birth for the foreign-born population - Other South America (%)
Place of birth for the foreign-born population - Canada (%)
Place of birth for the foreign-born population - Other Northern America (%)
Place of birth for the foreign-born population - Other (%)
Latest news about races in Reading, MA collected exclusively by city-data.com from local newspapers, TV, and radio stations
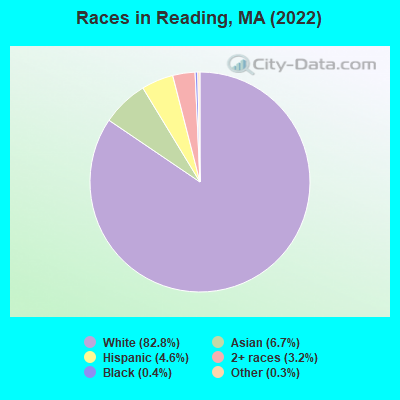
According to 2022 data, the most numerous races in Reading, MA are White alone (20,965 residents), Hispanic (1,174 residents), and Asian alone (1,697 residents). 86.6% of Reading residents speak English at home. 8.8% of Reading, MA residents are foreign-born (4.5% born in Asia, 2.0% born in Europe, 1.1% born in Latin America), which is 103.6% less than the foreign-born rate of 18.0% across the entire state of Massachusetts.
Race distribution in Reading
2000 2022
5,198,359 81.9% White alone 428,729 6.8% Hispanic 318,329 5.0% Black alone 236,786 3.7% Asian alone 110,338 1.7% Two or more races 43,586 0.7% Other race alone 11,264 0.2% American Indian alone 1,706 0.03% Native Hawaiian and Other
4,676,627 67.0% White alone 911,038 13.0% Hispanic 501,463 7.2% Asian alone 459,740 6.6% Black alone 341,889 4.9% Two or more races 84,403 1.2% Other race alone 5,838 0.08% American Indian alone 976 0.01% Native Hawaiian and Other
Income and house value in Reading Median household income in 2022 $148,804 White non-Hispanic householdersover $200,000 Asian householders$38,717 Some other race householders$163,334 Two or more races householders$188,835 Hispanic or Latino race householdersMedian 2022 house value $763,381 White Non-Hispanic householders$555,467 Black or African American householders$772,653 American Indian or Alaska Native householders $688,925 Asian householders$860,595 Some other race householders$835,027 Two or more races householders$723,484 Hispanic or Latino householders
Median age by race in Reading
46.3 Median age for White residents44.4 49.2 45.8 Median age for Black or African American residents31.7 52.6 -761,044,175.9 Median age for American Indian / Alaska Native residents-751,004,015.3 -1,078,313,251.9 46.6 Median age for Asian residents46.3 48.0 -514,227,641.8 Median age for Native Hawaiian / Pacific Islander residents-513,131,312.6 -508,717,948.2 29.3 Median age for Other race residents16.6 30.5 18.5 Median age for Two or more races residents27.8 15.3 46.5 Median age for White alone residents44.3 49.6 19.0 Median age for Hispanic or Latino residents26.8 18.2
Owner/renter occupied households by race in Reading
House owners and renters - White residents 7,141 83.8% Owner occupied1,375 16.2% Renter occupiedHouse owners and renters - Black or African American residents 50 76.0% Owner occupied16 24.0% Renter occupiedHouse owners and renters - Asian residents 395 89.7% Owner occupied45 10.3% Renter occupiedHouse owners and renters - Other race residents 62 100.0% Owner occupiedHouse owners and renters - Two or more races residents 283 82.5% Owner occupied60 17.5% Renter occupiedHouse owners and renters - White alone residents 7,135 83.5% Owner occupied1,410 16.5% Renter occupiedHouse owners and renters - Hispanic or Latino residents 225 100.0% Owner occupied
Language usage in Reading
English speakers - Total 86.6% of residents of Reading speak English at home.
1.3% of residents speak Spanish at home 240 75.9% Speak English very well76 24.1% Speak English less than very well10.9% of residents speak other language at home 1,940 73.9% Speak English very well684 26.1% Speak English less than very well
English speakers - Born in the United States 94.9% of residents of Reading speak English at home.
1.7% of residents speak Spanish at home 51 69.9% Speak English very well22 30.1% Speak English less than very well2.8% of residents speak other language at home 125 100.0% Speak English very well
English speakers - Native, born elsewhere 56.5% of residents of Reading speak English at home.
27.2% of residents speak Spanish at home 25 100.0% Speak English very well17.4% of residents speak other language at home 16 100.0% Speak English less than very well
English speakers - Foreign-born 26.1% of residents of Reading speak English at home.
4.9% of residents speak Spanish at home 109 100.0% Speak English very well67.7% of residents speak other language at home 921 60.8% Speak English very well595 39.2% Speak English less than very well
White (Caucasian) - Speak only English Native:
97.2% (18,843)Foreign-born:
50.8% (339)
White (Caucasian) - Speak another language Native:
3.1% (609)Foreign-born:
48.1% (321)
Black or African American - Speak only English Native:
95.9% (16)Foreign-born:
70.0% (56)
Asian - Speak only English Native:
26.0% (145)Foreign-born:
10.8% (120)
Asian - Speak another language Native:
74.0% (412)Foreign-born:
89.2% (997)
Other race - Speak only English Native:
44.0% (50)Foreign-born:
56.2% (38)
Other race - Speak another language Native:
56.2% (64)Foreign-born:
48.8% (33)
Two or more races - Speak only English Native:
85.1% (1,014)Foreign-born:
7.6% (21)
Two or more races - Speak another language Native:
12.5% (148)Foreign-born:
92.5% (260)
White alone - Speak only English Native:
96.7% (18,706)Foreign-born:
49.6% (339)
White alone - Speak another language Native:
3.4% (650)Foreign-born:
47.9% (327)
Hispanic or Latino - Speak only English Native:
85.5% (733)Foreign-born:
26.6% (32)
Hispanic or Latino - Speak another language Native:
18.9% (162)Foreign-born:
73.4% (89)
Foreign-born residents in Reading 2,239 residents are foreign born (4.5% Asia , 2.0% Europe , 1.1% Latin America ).
This city:
8.8%Massachusetts:
17.6%
Marital status for residents in Reading Marital status - White (Caucasian) population 15 years and over
Males 24.0% Never married67.7% Now married0.3% Separated2.3% Widowed5.7% DivorcedFemales 25.8% Never married57.7% Now married1.5% Separated8.3% Widowed6.7% DivorcedWomen who gave birth in the past 12 months Now married:
92.8% (285)Unmarried:
7.2% (22)
Women who did not give birth in the past 12 months Now married:
52.4% (1,947)Unmarried:
47.6% (1,772)
Marital status - Black or African American population 15 years and over
Males 9.1% Never married90.9% Now married0.0% Separated0.0% Widowed0.0% DivorcedFemales 52.4% Never married47.6% Now married0.0% Separated0.0% Widowed0.0% DivorcedWomen who did not give birth in the past 12 months Now married:
34.4% (11)Unmarried:
65.6% (20)
Marital status - Asian population 15 years and over
Males 15.6% Never married80.9% Now married1.2% Separated0.0% Widowed2.3% DivorcedFemales 0.0% Never married84.5% Now married0.0% Separated8.3% Widowed7.2% DivorcedWomen who gave birth in the past 12 months Now married:
100.0% (12)Unmarried:
0.0% (0)
Women who did not give birth in the past 12 months Now married:
100.0% (382)Unmarried:
0.0% (0)
Marital status - Other race population 15 years and over
Males 39.5% Never married60.5% Now married0.0% Separated0.0% Widowed0.0% DivorcedFemales 45.5% Never married53.5% Now married0.0% Separated0.0% Widowed1.0% DivorcedWomen who gave birth in the past 12 months Now married:
100.0% (16)Unmarried:
0.0% (0)
Women who did not give birth in the past 12 months Now married:
33.3% (27)Unmarried:
66.7% (54)
Marital status - Two or more races population 15 years and over
Males 36.1% Never married56.0% Now married3.8% Separated0.0% Widowed4.2% DivorcedFemales 54.6% Never married34.7% Now married0.0% Separated4.8% Widowed5.9% DivorcedWomen who did not give birth in the past 12 months Now married:
19.6% (55)Unmarried:
80.4% (224)
Marital status - White alone, not Hispanic / Latino population 15 years and over
Males 24.1% Never married67.6% Now married0.3% Separated2.3% Widowed5.7% DivorcedFemales 25.7% Never married57.7% Now married1.6% Separated8.3% Widowed6.8% DivorcedWomen who gave birth in the past 12 months Now married:
92.8% (291)Unmarried:
7.2% (22)
Women who did not give birth in the past 12 months Now married:
52.1% (1,926)Unmarried:
47.9% (1,768)
Marital status - Hispanic or Latino population 15 years and over
Males 26.9% Never married73.1% Now married0.0% Separated0.0% Widowed0.0% DivorcedFemales 40.6% Never married54.3% Now married0.0% Separated4.7% Widowed0.4% DivorcedWomen who did not give birth in the past 12 months Now married:
50.9% (120)Unmarried:
49.1% (116)
Ancestries in Reading
2,719 25.5% Irish2,046 19.2% Italian778 7.3% English694 6.5% American278 2.6% French Canadian225 2.1% Greek213 2.0% European173 1.6% Portuguese120 1.1% Eastern European119 1.1% Brazilian97 0.9% Dutch96 0.9% French93 0.9% German75 0.7% Polish69 0.6% Scottish63 0.6% Norwegian58 0.5% Scotch-Irish40 0.4% Slavic38 0.4% Syrian30 0.3% Jamaican26 0.2% Armenian24 0.2% British21 0.2% Egyptian18 0.2% Swedish13 0.1% Lithuanian13 0.1% Northern European12 0.1% Bulgarian7 0.07% Iranian6 0.06% Canadian4 0.04% Croatian
Children Nativity (place of birth) in Reading
Children under 6 years - Living with two parents Both parents native 1,231 100.0% NativeBoth parents foreign-born 65 100.0% NativeOne native, one foreign-born parent 194 100.0% NativeChildren under 6 years - Living with one parent Native parent 37 100.0% NativeChildren 6 to 17 years - Living with two parents Both parents native 3,275 99.4% Native21 0.6% Foreign-bornBoth parents foreign-born 328 85.3% Native56 14.7% Foreign-bornOne native, one foreign-born parent 282 100.0% NativeChildren 6 to 17 years - Living with one parent Native parent 417 100.0% NativeForeign-born parent 10 53.1% Native9 46.9% Foreign-born
Grandparents responsible for own grandchildren in Reading
Grandparents (30 to 59 years) White / Caucasian 30 100.0% Not responsible for grandchildrenWhite alone, not Hispanic / Latino 33 100.0% Not responsible for grandchildrenGrandparents (60 years and over) White / Caucasian 19 23.4% Responsible for grandchildren61 76.6% Not responsible for grandchildrenWhite alone, not Hispanic / Latino 19 28.8% Responsible for grandchildren47 71.2% Not responsible for grandchildren