Races in Quantico Station, Virginia (VA) Detailed Stats
Ancestries, Foreign-born residents, place of birth

Discuss Quantico Station, Virginia races on our local forum with over 2,400,000 registered users
6.0% of Quantico Station, VA residents are foreign-born (2.8% born in Latin America, 2.0% born in Asia, 0.7% born in Europe), which is 101.7% less than the foreign-born rate of 12.0% across the entire state of Virginia.
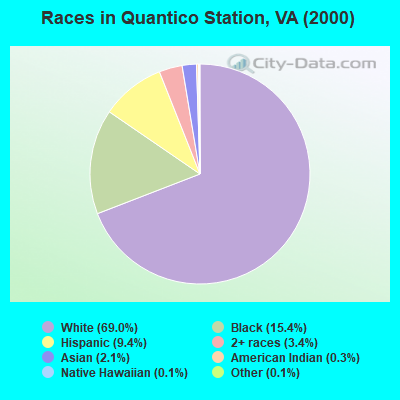
Race distribution in Quantico Station

- 4,53769.0%White alone
- 1,01315.4%Black alone
- 6169.4%Hispanic
- 2263.4%Two or more races
- 1402.1%Asian alone
- 220.3%American Indian alone
- 80.1%Other race alone
- 90.1%Native Hawaiian and Other
Pacific Islander alone
2000
2022
-
- 4,965,63770.2%White alone
- 1,376,37819.4%Black alone
- 329,5404.7%Hispanic
- 259,2773.7%Asian alone
- 114,0221.6%Two or more races
- 18,5960.3%American Indian alone
- 11,6850.2%Other race alone
- 3,3800.05%Native Hawaiian and Other
Pacific Islander alone

-
- 5,095,13058.7%White alone
- 1,594,78518.4%Black alone
- 905,75010.4%Hispanic
- 602,8816.9%Asian alone
- 406,0474.7%Two or more races
- 60,4190.7%Other race alone
- 11,7380.1%American Indian alone
- 6,8690.08%Native Hawaiian and Other
Pacific Islander alone

Income and house value in Quantico Station
- Median household income in 2022
- $88,955White non-Hispanic householders
- $63,777Black householders
- $124,208Asian householders
- $62,199Some other race householders
- $85,160Two or more races householders
- $55,100Hispanic or Latino race householders
- Median 2022 house value
- $242,562White Non-Hispanic householders
Household income for White non-Hispanic householders

Household income for Black householders

Household income for Asian householders

Household income for Two or more races householders

Household income for Hispanic or Latino race householders

Foreign-born residents in Quantico Station
391 residents are foreign born (2.8% Latin America, 2.0% Asia, 0.7% Europe).
| This city: | 6.0% |
| Virginia: | 8.1% |
Ancestries in Quantico Station

- 2,33931.8%Other
- 1,17816.0%German
- 85611.6%Irish
- 5347.3%Italian
- 4886.6%United States
- 3915.3%English
- 2223.0%French
- 1892.6%Polish
- 1512.1%Scottish
- 1241.7%Dutch
- 1171.6%West Indian
- 1161.6%French Canadian
- 871.2%Norwegian
- 871.2%Scotch-Irish
- 690.9%Arab
- 620.8%Russian
- 500.7%Swedish
- 500.7%Welsh
- 450.6%Czech
- 400.5%Subsaharan African
- 350.5%Hungarian
- 310.4%Swiss
- 240.3%Danish
- 200.3%Portuguese
- 200.3%Slovak
- 180.2%Greek
- 80.1%Lithuanian
- 30.04%Ukrainian

Zip codes: 22134.