Races in Port St. Lucie, Florida (FL) Detailed Stats
Data:
Races - White alone (%)
Races - White alone (% change since 2000)
Races - Black alone (%)
Races - Black alone (% change since 2000)
Races - American Indian alone (%)
Races - American Indian alone (% change since 2000)
Races - Asian alone (%)
Races - Asian alone (% change since 2000)
Races - Hispanic (%)
Races - Hispanic (% change since 2000)
Races - Native Hawaiian and Other Pacific Islander alone (%)
Races - Native Hawaiian and Other Pacific Islander alone (% change since 2000)
Races - Two or more races(%)
Races - Two or more races(% change since 2000)
Races - Other race alone (%)
Races - Other race alone (% change since 2000)
Racial diversity
Place of birth - Born in state of residence (%)
Place of birth - Born in state of residence (%) - White
Place of birth - Born in state of residence (%) - Black or African American
Place of birth - Born in state of residence (%) - Asian
Place of birth - Born in state of residence (%) - Hispanic or Latino
Place of birth - Born in state of residence (%) - American Indian and Alaska Native
Place of birth - Born in state of residence (%) - Multirace
Place of birth - Born in state of residence (%) - Other Race
Place of birth - Born in other state (%)
Place of birth - Born in other state (%) - White
Place of birth - Born in other state (%) - Black or African American
Place of birth - Born in other state (%) - Asian
Place of birth - Born in other state (%) - Hispanic or Latino
Place of birth - Born in other state (%) - American Indian and Alaska Native
Place of birth - Born in other state (%) - Multirace
Place of birth - Born in other state (%) - Other Race
Place of birth - Native, outside of US (%)
Place of birth - Native, outside of US (%) - White
Place of birth - Native, outside of US (%) - Black or African American
Place of birth - Native, outside of US (%) - Asian
Place of birth - Native, outside of US (%) - Hispanic or Latino
Place of birth - Native, outside of US (%) - American Indian and Alaska Native
Place of birth - Native, outside of US (%) - Multirace
Place of birth - Native, outside of US (%) - Other Race
Place of birth - Foreign born (%)
Place of birth - Foreign born (%) - White
Place of birth - Foreign born (%) - Black or African American
Place of birth - Foreign born (%) - Asian
Place of birth - Foreign born (%) - Hispanic or Latino
Place of birth - Foreign born (%) - American Indian and Alaska Native
Place of birth - Foreign born (%) - Multirace
Place of birth - Foreign born (%) - Other Race
Residents speaking English at home (%)
Residents speaking English at home - Born in the United States (%)
Residents speaking English at home - Native, born elsewhere (%)
Residents speaking English at home - Foreign born (%)
Residents speaking Spanish at home (%)
Residents speaking Spanish at home - Born in the United States (%)
Residents speaking Spanish at home - Native, born elsewhere (%)
Residents speaking Spanish at home - Foreign born (%)
Residents speaking other language at home (%)
Residents speaking other language at home - Born in the United States (%)
Residents speaking other language at home - Native, born elsewhere (%)
Residents speaking other language at home - Foreign born (%)
Marital status - Never married (%)
Marital status - Now married (%)
Marital status - Separated (%)
Marital status - Widowed (%)
Marital status - Divorced (%)
Ancestries Reported - Arab (%)
Ancestries Reported - Czech (%)
Ancestries Reported - Danish (%)
Ancestries Reported - Dutch (%)
Ancestries Reported - English (%)
Ancestries Reported - French (%)
Ancestries Reported - French Canadian (%)
Ancestries Reported - German (%)
Ancestries Reported - Greek (%)
Ancestries Reported - Hungarian (%)
Ancestries Reported - Irish (%)
Ancestries Reported - Italian (%)
Ancestries Reported - Lithuanian (%)
Ancestries Reported - Norwegian (%)
Ancestries Reported - Polish (%)
Ancestries Reported - Portuguese (%)
Ancestries Reported - Russian (%)
Ancestries Reported - Scotch-Irish (%)
Ancestries Reported - Scottish (%)
Ancestries Reported - Slovak (%)
Ancestries Reported - Subsaharan African (%)
Ancestries Reported - Swedish (%)
Ancestries Reported - Swiss (%)
Ancestries Reported - Ukrainian (%)
Ancestries Reported - United States (%)
Ancestries Reported - Welsh (%)
Ancestries Reported - West Indian (%)
Ancestries Reported - Other (%)
Geographical mobility - Same house 1 year ago (%)
Geographical mobility - Same house 1 year ago (%) - White
Geographical mobility - Same house 1 year ago (%) - Black or African American
Geographical mobility - Same house 1 year ago (%) - Asian
Geographical mobility - Same house 1 year ago (%) - Hispanic or Latino
Geographical mobility - Same house 1 year ago (%) - American Indian and Alaska Native
Geographical mobility - Same house 1 year ago (%) - Multirace
Geographical mobility - Same house 1 year ago (%) - Other Race
Geographical mobility - Moved within same county (%)
Geographical mobility - Moved within same county (%) - White
Geographical mobility - Moved within same county (%) - Black or African American
Geographical mobility - Moved within same county (%) - Asian
Geographical mobility - Moved within same county (%) - Hispanic or Latino
Geographical mobility - Moved within same county (%) - American Indian and Alaska Native
Geographical mobility - Moved within same county (%) - Multirace
Geographical mobility - Moved within same county (%) - Other Race
Geographical mobility - Moved from different county within same state (%)
Geographical mobility - Moved from different county within same state (%) - White
Geographical mobility - Moved from different county within same state (%) - Black or African American
Geographical mobility - Moved from different county within same state (%) - Asian
Geographical mobility - Moved from different county within same state (%) - Hispanic or Latino
Geographical mobility - Moved from different county within same state (%) - American Indian and Alaska Native
Geographical mobility - Moved from different county within same state (%) - Multirace
Geographical mobility - Moved from different county within same state (%) - Other Race
Geographical mobility - Moved from different state (%)
Geographical mobility - Moved from different state (%) - White
Geographical mobility - Moved from different state (%) - Black or African American
Geographical mobility - Moved from different state (%) - Asian
Geographical mobility - Moved from different state (%) - Hispanic or Latino
Geographical mobility - Moved from different state (%) - American Indian and Alaska Native
Geographical mobility - Moved from different state (%) - Multirace
Geographical mobility - Moved from different state (%) - Other Race
Geographical mobility - Moved from abroad (%)
Geographical mobility - Moved from abroad (%) - White
Geographical mobility - Moved from abroad (%) - Black or African American
Geographical mobility - Moved from abroad (%) - Asian
Geographical mobility - Moved from abroad (%) - Hispanic or Latino
Geographical mobility - Moved from abroad (%) - American Indian and Alaska Native
Geographical mobility - Moved from abroad (%) - Multirace
Geographical mobility - Moved from abroad (%) - Other Race
Place of birth for the foreign-born population - Ireland (%)
Place of birth for the foreign-born population - Denmark (%)
Place of birth for the foreign-born population - Norway (%)
Place of birth for the foreign-born population - Sweden (%)
Place of birth for the foreign-born population - United Kingdom (%)
Place of birth for the foreign-born population - England (%)
Place of birth for the foreign-born population - Scotland (%)
Place of birth for the foreign-born population - Other Northern Europe (%)
Place of birth for the foreign-born population - Austria (%)
Place of birth for the foreign-born population - Belgium (%)
Place of birth for the foreign-born population - France (%)
Place of birth for the foreign-born population - Germany (%)
Place of birth for the foreign-born population - Netherlands (%)
Place of birth for the foreign-born population - Switzerland (%)
Place of birth for the foreign-born population - Other Western Europe (%)
Place of birth for the foreign-born population - Greece (%)
Place of birth for the foreign-born population - Italy (%)
Place of birth for the foreign-born population - Portugal (%)
Place of birth for the foreign-born population - Spain (%)
Place of birth for the foreign-born population - Other Southern Europe (%)
Place of birth for the foreign-born population - Albania (%)
Place of birth for the foreign-born population - Belarus (%)
Place of birth for the foreign-born population - Bosnia and Herzegovina (%)
Place of birth for the foreign-born population - Bulgaria (%)
Place of birth for the foreign-born population - Croatia (%)
Place of birth for the foreign-born population - Czechoslovakia (%)
Place of birth for the foreign-born population - Hungary (%)
Place of birth for the foreign-born population - Latvia (%)
Place of birth for the foreign-born population - Lithuania (%)
Place of birth for the foreign-born population - North Macedonia (Macedonia) (%)
Place of birth for the foreign-born population - Moldova (%)
Place of birth for the foreign-born population - Poland (%)
Place of birth for the foreign-born population - Romania (%)
Place of birth for the foreign-born population - Russia (%)
Place of birth for the foreign-born population - Serbia (%)
Place of birth for the foreign-born population - Ukraine (%)
Place of birth for the foreign-born population - Other Eastern Europe (%)
Place of birth for the foreign-born population - China (%)
Place of birth for the foreign-born population - Hong Kong (%)
Place of birth for the foreign-born population - Taiwan (%)
Place of birth for the foreign-born population - Japan (%)
Place of birth for the foreign-born population - Korea (%)
Place of birth for the foreign-born population - Other Eastern Asia (%)
Place of birth for the foreign-born population - Afghanistan (%)
Place of birth for the foreign-born population - Bangladesh (%)
Place of birth for the foreign-born population - India (%)
Place of birth for the foreign-born population - Iran (%)
Place of birth for the foreign-born population - Kazakhstan (%)
Place of birth for the foreign-born population - Nepal (%)
Place of birth for the foreign-born population - Pakistan (%)
Place of birth for the foreign-born population - Sri Lanka (%)
Place of birth for the foreign-born population - Uzbekistan (%)
Place of birth for the foreign-born population - Other South Central Asia (%)
Place of birth for the foreign-born population - Burma (%)
Place of birth for the foreign-born population - Cambodia (%)
Place of birth for the foreign-born population - Indonesia (%)
Place of birth for the foreign-born population - Laos (%)
Place of birth for the foreign-born population - Malaysia (%)
Place of birth for the foreign-born population - Philippines (%)
Place of birth for the foreign-born population - Singapore (%)
Place of birth for the foreign-born population - Thailand (%)
Place of birth for the foreign-born population - Vietnam (%)
Place of birth for the foreign-born population - Other South Eastern Asia (%)
Place of birth for the foreign-born population - Armenia (%)
Place of birth for the foreign-born population - Iraq (%)
Place of birth for the foreign-born population - Israel (%)
Place of birth for the foreign-born population - Jordan (%)
Place of birth for the foreign-born population - Kuwait (%)
Place of birth for the foreign-born population - Lebanon (%)
Place of birth for the foreign-born population - Saudi Arabia (%)
Place of birth for the foreign-born population - Syria (%)
Place of birth for the foreign-born population - Turkey (%)
Place of birth for the foreign-born population - Yemen (%)
Place of birth for the foreign-born population - Other Western Asia (%)
Place of birth for the foreign-born population - Eritrea (%)
Place of birth for the foreign-born population - Ethiopia (%)
Place of birth for the foreign-born population - Kenya (%)
Place of birth for the foreign-born population - Somalia (%)
Place of birth for the foreign-born population - Uganda (%)
Place of birth for the foreign-born population - Zimbabwe (%)
Place of birth for the foreign-born population - Other Eastern Africa (%)
Place of birth for the foreign-born population - Cameroon (%)
Place of birth for the foreign-born population - Congo (%)
Place of birth for the foreign-born population - Democratic Republic of Congo (Zaire) (%)
Place of birth for the foreign-born population - Other Middle Africa (%)
Place of birth for the foreign-born population - Egypt (%)
Place of birth for the foreign-born population - Morocco (%)
Place of birth for the foreign-born population - Sudan (%)
Place of birth for the foreign-born population - Other Northern Africa (%)
Place of birth for the foreign-born population - South Africa (%)
Place of birth for the foreign-born population - Other Southern Africa (%)
Place of birth for the foreign-born population - Cabo Verde (%)
Place of birth for the foreign-born population - Ghana (%)
Place of birth for the foreign-born population - Liberia (%)
Place of birth for the foreign-born population - Nigeria (%)
Place of birth for the foreign-born population - Senegal (%)
Place of birth for the foreign-born population - Sierra Leone (%)
Place of birth for the foreign-born population - Other Western Africa (%)
Place of birth for the foreign-born population - Australia (%)
Place of birth for the foreign-born population - New Zealand (%)
Place of birth for the foreign-born population - Fiji (%)
Place of birth for the foreign-born population - Micronesia (%)
Place of birth for the foreign-born population - Bahamas (%)
Place of birth for the foreign-born population - Barbados (%)
Place of birth for the foreign-born population - Cuba (%)
Place of birth for the foreign-born population - Dominica (%)
Place of birth for the foreign-born population - Dominican Republic (%)
Place of birth for the foreign-born population - Grenada (%)
Place of birth for the foreign-born population - Haiti (%)
Place of birth for the foreign-born population - Jamaica (%)
Place of birth for the foreign-born population - St. Vincent and the Grenadines (%)
Place of birth for the foreign-born population - Trinidad and Tobago (%)
Place of birth for the foreign-born population - West Indies (%)
Place of birth for the foreign-born population - Other Caribbean (%)
Place of birth for the foreign-born population - Belize (%)
Place of birth for the foreign-born population - Costa Rica (%)
Place of birth for the foreign-born population - El Salvador (%)
Place of birth for the foreign-born population - Guatemala (%)
Place of birth for the foreign-born population - Honduras (%)
Place of birth for the foreign-born population - Mexico (%)
Place of birth for the foreign-born population - Nicaragua (%)
Place of birth for the foreign-born population - Panama (%)
Place of birth for the foreign-born population - Other Central America (%)
Place of birth for the foreign-born population - Argentina (%)
Place of birth for the foreign-born population - Bolivia (%)
Place of birth for the foreign-born population - Brazil (%)
Place of birth for the foreign-born population - Chile (%)
Place of birth for the foreign-born population - Colombia (%)
Place of birth for the foreign-born population - Ecuador (%)
Place of birth for the foreign-born population - Guyana (%)
Place of birth for the foreign-born population - Peru (%)
Place of birth for the foreign-born population - Uruguay (%)
Place of birth for the foreign-born population - Venezuela (%)
Place of birth for the foreign-born population - Other South America (%)
Place of birth for the foreign-born population - Canada (%)
Place of birth for the foreign-born population - Other Northern America (%)
Place of birth for the foreign-born population - Other (%)
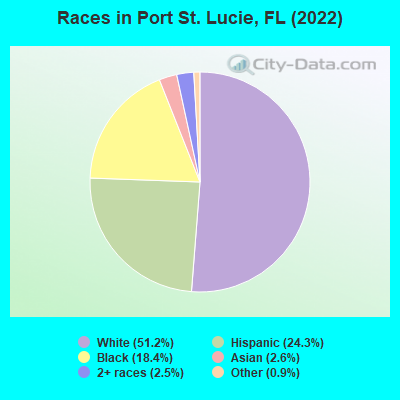
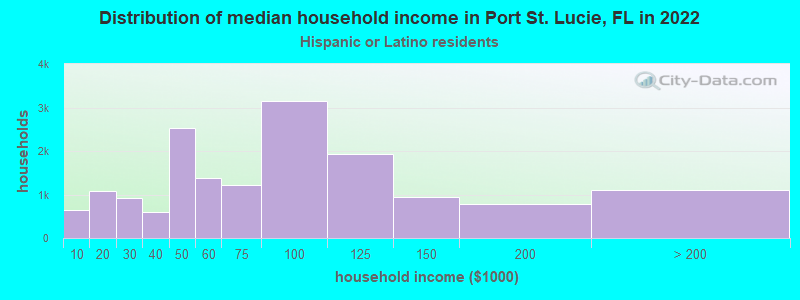
According to 2022 data, the most numerous races in Port St. Lucie, FL are White alone (118,592 residents), Hispanic (56,430 residents), and Black alone (42,721 residents). 72.1% of Port St. Lucie residents speak English at home. 19.2% of Port St. Lucie, FL residents are foreign-born (15.1% born in Latin America), which is 9.5% less than the foreign-born rate of 21.0% across the entire state of Florida.
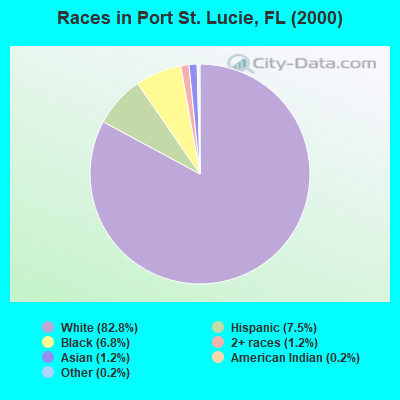
Race distribution in Port St. Lucie
2000 2022
73,489 82.8% White alone 6,677 7.5% Hispanic 6,035 6.8% Black alone 1,099 1.2% Two or more races 1,089 1.2% Asian alone 173 0.2% Other race alone 183 0.2% American Indian alone 24 0.03% Native Hawaiian and Other
118,592 51.2% White alone 56,430 24.3% Hispanic 42,721 18.4% Black alone 5,914 2.6% Asian alone 5,708 2.5% Two or more races 2,053 0.9% Other race alone 220 0.09% American Indian alone 166 0.07% Native Hawaiian and Other
2000 2022
10,458,509 65.4% White alone 2,682,715 16.8% Hispanic 2,264,268 14.2% Black alone 261,693 1.6% Asian alone 236,954 1.5% Two or more races 42,358 0.3% American Indian alone 28,994 0.2% Other race alone 6,887 0.04% Native Hawaiian and Other
11,309,403 50.8% White alone 6,025,039 27.1% Hispanic 3,241,015 14.6% Black alone 861,630 3.9% Two or more races 623,692 2.8% Asian alone 152,054 0.7% Other race alone 22,504 0.1% American Indian alone 9,486 0.04% Native Hawaiian and Other
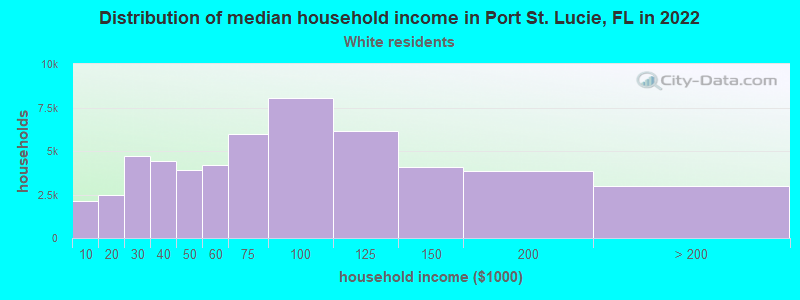
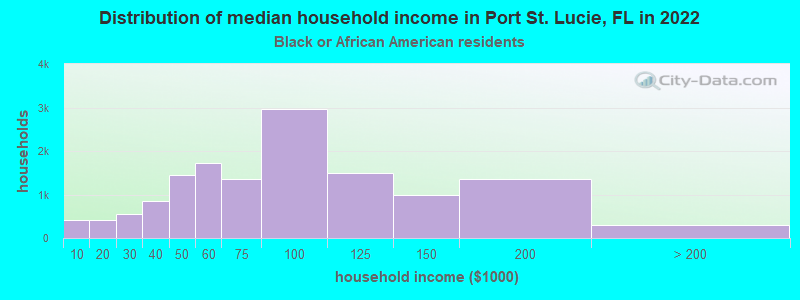
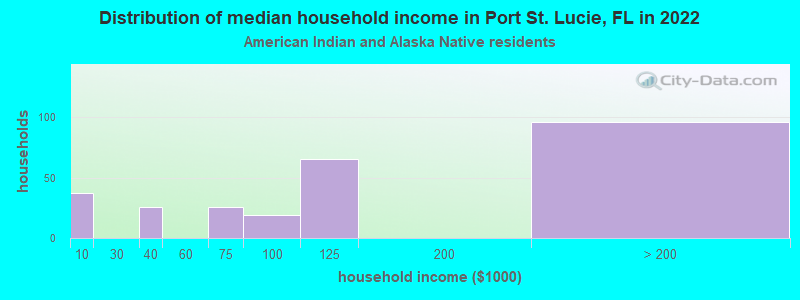
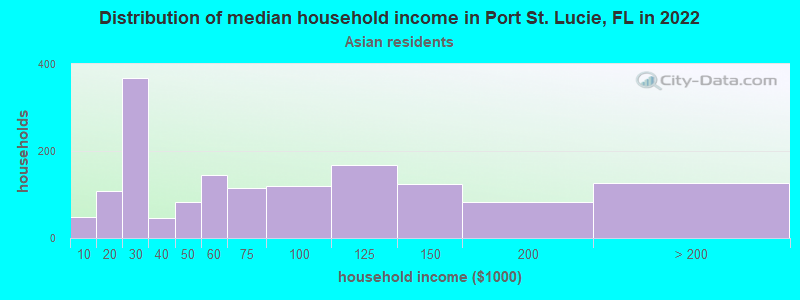
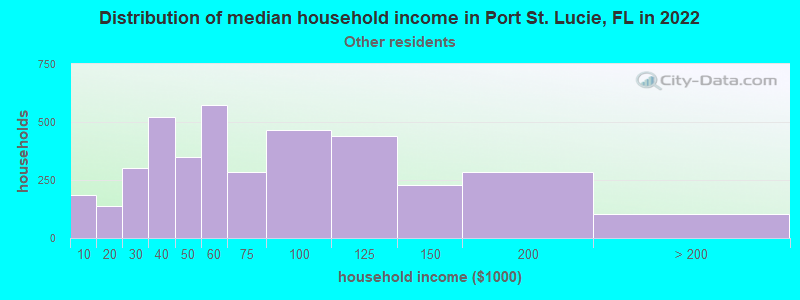
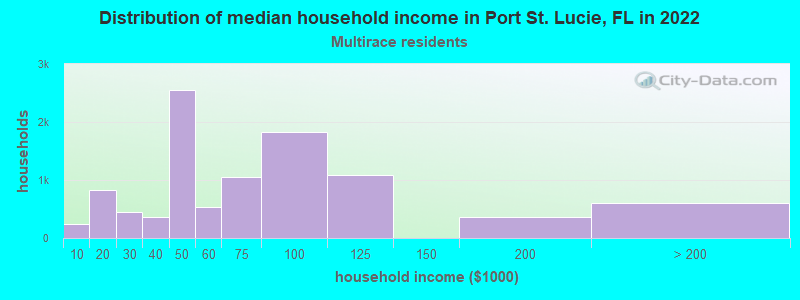
Income and house value in Port St. Lucie Median household income in 2022 $69,115 White non-Hispanic householders$78,080 Black householders$92,483 Asian householders$171,855 Native Hawaiian and other Pacific Islander householders$59,958 Some other race householders$59,838 Two or more races householders$72,075 Hispanic or Latino race householdersMedian 2022 house value $368,453 White Non-Hispanic householders$380,500 Black or African American householders$377,177 American Indian or Alaska Native householders $390,469 Asian householders$351,838 Some other race householders$349,345 Two or more races householders$354,745 Hispanic or Latino householders
Median age by race in Port St. Lucie
49.3 Median age for White residents46.8 51.3 36.0 Median age for Black or African American residents31.6 37.0 55.3 Median age for American Indian / Alaska Native residents47.6 -666,666,666.0 48.9 Median age for Asian residents48.2 49.7 30.7 Median age for Native Hawaiian / Pacific Islander residents30.5 62.7 40.7 Median age for Other race residents35.4 45.3 39.9 Median age for Two or more races residents39.8 41.4 52.8 Median age for White alone residents50.5 55.5 36.9 Median age for Hispanic or Latino residents36.1 38.3
Owner/renter occupied households by race in Port St. Lucie
House owners and renters - White residents 45,536 86.1% Owner occupied7,353 13.9% Renter occupiedHouse owners and renters - Black or African American residents 11,777 85.1% Owner occupied2,059 14.9% Renter occupiedHouse owners and renters - American Indian / Alaska Native residents 154 46.9% Owner occupied174 53.1% Renter occupiedHouse owners and renters - Asian residents 1,808 93.3% Owner occupied129 6.7% Renter occupiedHouse owners and renters - Native Hawaiian / Pacific Islander residents 34 55.2% Owner occupied28 44.8% Renter occupiedHouse owners and renters - Other race residents 3,028 80.3% Owner occupied742 19.7% Renter occupiedHouse owners and renters - Two or more races residents 7,629 77.2% Owner occupied2,257 22.8% Renter occupiedHouse owners and renters - White alone residents 42,156 86.2% Owner occupied6,747 13.8% Renter occupiedHouse owners and renters - Hispanic or Latino residents 13,081 80.4% Owner occupied3,198 19.6% Renter occupied
Language usage in Port St. Lucie
English speakers - Total 72.1% of residents of Port St. Lucie speak English at home.
18.7% of residents speak Spanish at home 28,684 69.2% Speak English very well12,752 30.8% Speak English less than very well9.2% of residents speak other language at home 14,113 69.5% Speak English very well6,186 30.5% Speak English less than very well
English speakers - Born in the United States 92.7% of residents of Port St. Lucie speak English at home.
6.0% of residents speak Spanish at home 4,770 79.8% Speak English very well1,206 20.2% Speak English less than very well1.3% of residents speak other language at home 1,210 94.0% Speak English very well77 6.0% Speak English less than very well
English speakers - Native, born elsewhere 19.3% of residents of Port St. Lucie speak English at home.
75.0% of residents speak Spanish at home 4,831 72.2% Speak English very well1,858 27.8% Speak English less than very well5.7% of residents speak other language at home 445 88.3% Speak English very well59 11.7% Speak English less than very well
English speakers - Foreign-born 26.2% of residents of Port St. Lucie speak English at home.
39.4% of residents speak Spanish at home 9,623 52.3% Speak English very well8,768 47.7% Speak English less than very well34.4% of residents speak other language at home 10,027 62.4% Speak English very well6,050 37.6% Speak English less than very well
White (Caucasian) - Speak only English Native:
89.6% (111,633)Foreign-born:
34.0% (2,603)
White (Caucasian) - Speak another language Native:
10.4% (13,023)Foreign-born:
66.0% (5,050)
Black or African American - Speak only English Native:
86.6% (23,629)Foreign-born:
42.5% (6,103)
Black or African American - Speak another language Native:
13.4% (3,652)Foreign-born:
57.5% (8,269)
American Indian / Alaska Native - Speak another language Native:
15.0% (60)Foreign-born:
100.0% (211)
Asian - Speak only English Native:
64.3% (844)Foreign-born:
24.4% (1,108)
Asian - Speak another language Native:
35.7% (469)Foreign-born:
75.6% (3,435)
Other race - Speak only English Native:
42.7% (3,649)Foreign-born:
29.6% (1,153)
Other race - Speak another language Native:
57.3% (4,906)Foreign-born:
70.4% (2,741)
Two or more races - Speak only English Native:
57.4% (7,021)Foreign-born:
7.9% (1,266)
Two or more races - Speak another language Native:
42.6% (5,217)Foreign-born:
92.1% (14,791)
White alone - Speak only English Native:
96.9% (105,220)Foreign-born:
45.8% (2,603)
White alone - Speak another language Native:
3.1% (3,402)Foreign-born:
54.2% (3,082)
Hispanic or Latino - Speak only English Native:
41.8% (14,376)Foreign-born:
4.7% (908)
Hispanic or Latino - Speak another language Native:
58.2% (19,977)Foreign-born:
95.3% (18,218)
Foreign-born residents in Port St. Lucie 43,270 residents are foreign born (15.1% Latin America ).
This city:
19.2%Florida:
21.1%
Marital status for residents in Port St. Lucie Marital status - White (Caucasian) population 15 years and over
Males 28.1% Never married57.1% Now married1.4% Separated2.7% Widowed10.6% DivorcedFemales 21.5% Never married47.0% Now married2.3% Separated12.4% Widowed16.8% DivorcedWomen who gave birth in the past 12 months Now married:
15.1% (217)Unmarried:
84.9% (1,220)
Women who did not give birth in the past 12 months Now married:
41.6% (9,568)Unmarried:
58.4% (13,436)
Marital status - Black or African American population 15 years and over
Males 42.4% Never married40.3% Now married1.8% Separated3.1% Widowed12.5% DivorcedFemales 42.4% Never married37.6% Now married0.2% Separated8.2% Widowed11.5% DivorcedWomen who gave birth in the past 12 months Now married:
65.6% (128)Unmarried:
34.4% (67)
Women who did not give birth in the past 12 months Now married:
29.4% (3,025)Unmarried:
70.6% (7,258)
Marital status - American Indian / Alaska Native population 15 years and over
Males 8.7% Never married70.0% Now married0.0% Separated12.1% Widowed9.3% DivorcedFemales 0.0% Never married40.7% Now married0.0% Separated0.0% Widowed59.3% DivorcedWomen who did not give birth in the past 12 months Now married:
100.0% (46)Unmarried:
0.0% (0)
Marital status - Asian population 15 years and over
Males 39.5% Never married57.4% Now married1.3% Separated0.7% Widowed1.1% DivorcedFemales 14.6% Never married69.3% Now married1.5% Separated12.6% Widowed1.9% DivorcedWomen who gave birth in the past 12 months Now married:
100.0% (301)Unmarried:
0.0% (0)
Women who did not give birth in the past 12 months Now married:
67.4% (880)Unmarried:
32.6% (426)
Marital status - Native Hawaiian / Pacific Islander population 15 years and over
Males 28.9% Never married62.2% Now married8.9% Separated0.0% Widowed0.0% DivorcedFemales 30.6% Never married69.4% Now married0.0% Separated0.0% Widowed0.0% DivorcedWomen who did not give birth in the past 12 months Now married:
100.0% (5)Unmarried:
0.0% (0)
Marital status - Other race population 15 years and over
Males 46.5% Never married51.8% Now married0.0% Separated0.0% Widowed1.7% DivorcedFemales 21.1% Never married54.1% Now married6.2% Separated5.4% Widowed13.2% DivorcedWomen who gave birth in the past 12 months Now married:
78.1% (128)Unmarried:
21.9% (36)
Women who did not give birth in the past 12 months Now married:
34.4% (1,420)Unmarried:
65.6% (2,703)
Marital status - Two or more races population 15 years and over
Males 31.0% Never married61.6% Now married0.0% Separated3.7% Widowed3.8% DivorcedFemales 17.6% Never married63.4% Now married4.0% Separated4.1% Widowed10.9% DivorcedWomen who gave birth in the past 12 months Now married:
100.0% (217)Unmarried:
0.0% (0)
Women who did not give birth in the past 12 months Now married:
62.3% (3,900)Unmarried:
37.7% (2,363)
Marital status - White alone, not Hispanic / Latino population 15 years and over
Males 26.8% Never married57.2% Now married1.6% Separated2.7% Widowed11.7% DivorcedFemales 19.6% Never married48.6% Now married2.5% Separated13.6% Widowed15.7% DivorcedWomen who gave birth in the past 12 months Now married:
21.9% (217)Unmarried:
78.1% (775)
Women who did not give birth in the past 12 months Now married:
41.9% (7,718)Unmarried:
58.1% (10,713)
Marital status - Hispanic or Latino population 15 years and over
Males 36.7% Never married57.5% Now married0.0% Separated2.9% Widowed2.8% DivorcedFemales 25.7% Never married50.7% Now married3.8% Separated4.1% Widowed15.6% DivorcedWomen who gave birth in the past 12 months Now married:
42.5% (329)Unmarried:
57.5% (445)
Women who did not give birth in the past 12 months Now married:
50.0% (6,504)Unmarried:
50.0% (6,514)
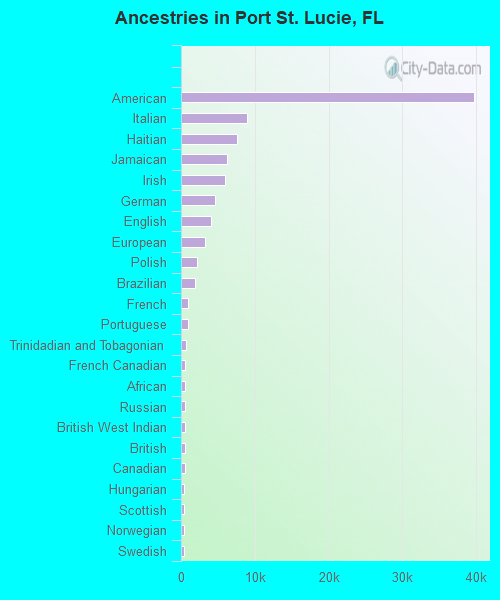
Ancestries in Port St. Lucie
39,760 29.5% American8,943 6.6% Italian7,621 5.7% Haitian6,270 4.7% Jamaican6,012 4.5% Irish4,547 3.4% German4,065 3.0% English3,294 2.4% European2,119 1.6% Polish1,895 1.4% Brazilian958 0.7% French939 0.7% Portuguese625 0.5% Trinidadian and Tobagonian588 0.4% French Canadian587 0.4% African568 0.4% Russian550 0.4% British West Indian486 0.4% British477 0.4% Canadian429 0.3% Hungarian425 0.3% Scottish421 0.3% Norwegian401 0.3% Swedish355 0.3% Lebanese322 0.2% Guyanese305 0.2% Greek296 0.2% Ukrainian293 0.2% Palestinian241 0.2% U.S. Virgin Islander216 0.2% Romanian201 0.1% Scotch-Irish186 0.1% Croatian163 0.1% West Indian150 0.1% South African143 0.1% Barbadian143 0.1% Dutch112 0.08% Czech99 0.07% Welsh98 0.07% Moroccan97 0.07% Eastern European91 0.07% Finnish86 0.06% Israeli82 0.06% Bahamian78 0.06% Belgian76 0.06% Armenian73 0.05% Slovak61 0.05% Swiss53 0.04% Ghanaian44 0.03% Danish40 0.03% Estonian36 0.03% Lithuanian33 0.02% Scandinavian31 0.02% Nigerian30 0.02% Northern European30 0.02% Czechoslovakian30 0.02% Maltese28 0.02% Austrian25 0.02% Arab24 0.02% German Russian22 0.02% Slovene21 0.02% Egyptian20 0.01% Cape Verdean19 0.01% Basque18 0.01% Pennsylvania German18 0.01% Yugoslavian17 0.01% Latvian17 0.01% Syrian14 0.01% Jordanian13 0.01% Serbian11 0.01% Belizean8 0.01% New Zealander
Geographical mobility in Port St. Lucie Same house 1 year ago 125,262 90.8% White (Caucasian)39,522 89.9% Black or African American686 94.4% American Indian / Alaska Native4,260 90.1% Asian85 67.9% Native Hawaiian / Pacific Islander12,315 90.9% Other race26,928 92.7% Two or more races107,594 91.0% White alone, not Hispanic / Latino50,951 90.8% Hispanic or LatinoMoved within same county 4,715 3.4% White / Caucasian874 2.0% Black or African American26 3.6% American Indian / Alaska Native113 2.4% Asian47 37.6% Native Hawaiian / Pacific Islander283 2.1% Other race1,328 4.6% Two or more races4,429 3.7% White alone, not Hispanic / Latino1,739 3.1% Hispanic or LatinoMoved within same state 4,926 3.6% White / Caucasian3,039 6.9% Black or African American25 3.4% American Indian / Alaska Native321 6.8% Asian716 5.3% Other race665 2.3% Two or more races3,278 2.8% White alone, not Hispanic / Latino2,730 4.9% Hispanic or LatinoMoved from different state 3,066 2.2% White / Caucasian438 1.0% Black or African American47 1.0% Asian229 1.7% Other race130 0.4% Two or more races2,896 2.5% White alone, not Hispanic / Latino686 1.2% Hispanic or LatinoMoved from abroad 91 0.2% Black or African American42 0.3% Other race
Children Nativity (place of birth) in Port St. Lucie
Children under 6 years - Living with two parents Both parents native 3,299 100.0% NativeBoth parents foreign-born 3,114 100.0% NativeOne native, one foreign-born parent 1,238 100.0% NativeChildren under 6 years - Living with one parent Native parent 3,345 100.0% NativeForeign-born parent 481 59.5% Native327 40.5% Foreign-bornChildren 6 to 17 years - Living with two parents Both parents native 11,476 100.0% NativeBoth parents foreign-born 7,378 89.7% Native850 10.3% Foreign-bornOne native, one foreign-born parent 2,830 100.0% NativeChildren 6 to 17 years - Living with one parent Native parent 8,405 100.0% NativeForeign-born parent 2,310 50.5% Native2,260 49.5% Foreign-born
Place of birth for residents in Port St. Lucie 34,870 Americas33,539 Latin America21,036 Caribbean8,052 South America4,450 Central America4,203 Europe3,367 Asia2,118 South Eastern Asia1,331 Northern America1,268 Northern Europe1,098 Southern Europe1,001 Eastern Europe835 Western Europe803 Africa569 Eastern Asia354 Western Asia343 Western Africa289 South Central Asia256 Southern Africa254 China103 Northern Africa26 Eastern Africa25 Oceania25 Australia and New Zealand Subregion22 Middle Africa6,588 Jamaica6,437 Haiti3,270 Cuba2,328 Dominican Republic1,887 Colombia1,629 Brazil1,363 Philippines1,357 Trinidad and Tobago1,331 Canada1,260 Peru1,202 Honduras1,058 Mexico915 Guyana857 Ecuador809 Nicaragua701 Venezuela657 Guatemala526 Portugal523 England483 Germany477 Vietnam445 United Kingdom394 El Salvador328 Italy274 Bolivia268 Chile264 Lebanon256 South Africa239 Argentina235 Ghana234 Korea216 St. Vincent and the Grenadines211 Hungary196 India191 Thailand189 Panama182 Grenada167 Spain130 Taiwan123 Dominica119 Costa Rica117 Russia115 Bosnia and Herzegovina114 Barbados114 Belgium113 China111 Ireland107 Nigeria105 Ukraine95 France86 Poland85 Netherlands80 Japan75 Moldova74 Czechoslovakia73 Morocco62 Pakistan57 Sweden50 Bahamas49 Israel48 Romania46 Greece41 Belarus37 Switzerland33 Jordan29 Egypt26 Kenya25 Malaysia24 Laos24 Norway22 Iran22 Democratic Republic of Congo (Zaire)21 Indonesia18 Belize18 Latvia17 Austria15 Singapore15 Lithuania14 Australia11 Scotland10 Hong Kong10 New Zealand8 Bangladesh7 Saudi Arabia6 Uruguay
Grandparents responsible for own grandchildren in Port St. Lucie
Grandparents (30 to 59 years) White / Caucasian 162 34.1% Responsible for grandchildren313 65.9% Not responsible for grandchildrenBlack or African American 216 52.8% Responsible for grandchildren194 47.2% Not responsible for grandchildrenAsian 58 100.0% Not responsible for grandchildrenOther race 211 100.0% Not responsible for grandchildrenTwo or more races 70 82.9% Responsible for grandchildren15 17.1% Not responsible for grandchildrenWhite alone, not Hispanic / Latino 87 29.4% Responsible for grandchildren209 70.6% Not responsible for grandchildrenHispanic or Latino 8 1.8% Responsible for grandchildren429 98.2% Not responsible for grandchildrenGrandparents (60 years and over) White / Caucasian 704 31.2% Responsible for grandchildren1,553 68.8% Not responsible for grandchildrenBlack or African American 72 7.2% Responsible for grandchildren927 92.8% Not responsible for grandchildrenAsian 114 100.0% Not responsible for grandchildrenOther race 50 35.8% Responsible for grandchildren90 64.2% Not responsible for grandchildrenTwo or more races 239 22.0% Responsible for grandchildren848 78.0% Not responsible for grandchildrenWhite alone, not Hispanic / Latino 618 44.6% Responsible for grandchildren768 55.4% Not responsible for grandchildrenHispanic or Latino 206 16.6% Responsible for grandchildren1,039 83.4% Not responsible for grandchildren