Races in Port Royal, South Carolina (SC) Detailed Stats
Data:
Races - White alone (%)
Races - White alone (% change since 2000)
Races - Black alone (%)
Races - Black alone (% change since 2000)
Races - American Indian alone (%)
Races - American Indian alone (% change since 2000)
Races - Asian alone (%)
Races - Asian alone (% change since 2000)
Races - Hispanic (%)
Races - Hispanic (% change since 2000)
Races - Native Hawaiian and Other Pacific Islander alone (%)
Races - Native Hawaiian and Other Pacific Islander alone (% change since 2000)
Races - Two or more races(%)
Races - Two or more races(% change since 2000)
Races - Other race alone (%)
Races - Other race alone (% change since 2000)
Racial diversity
Place of birth - Born in state of residence (%)
Place of birth - Born in state of residence (%) - White
Place of birth - Born in state of residence (%) - Black or African American
Place of birth - Born in state of residence (%) - Asian
Place of birth - Born in state of residence (%) - Hispanic or Latino
Place of birth - Born in state of residence (%) - American Indian and Alaska Native
Place of birth - Born in state of residence (%) - Multirace
Place of birth - Born in state of residence (%) - Other Race
Place of birth - Born in other state (%)
Place of birth - Born in other state (%) - White
Place of birth - Born in other state (%) - Black or African American
Place of birth - Born in other state (%) - Asian
Place of birth - Born in other state (%) - Hispanic or Latino
Place of birth - Born in other state (%) - American Indian and Alaska Native
Place of birth - Born in other state (%) - Multirace
Place of birth - Born in other state (%) - Other Race
Place of birth - Native, outside of US (%)
Place of birth - Native, outside of US (%) - White
Place of birth - Native, outside of US (%) - Black or African American
Place of birth - Native, outside of US (%) - Asian
Place of birth - Native, outside of US (%) - Hispanic or Latino
Place of birth - Native, outside of US (%) - American Indian and Alaska Native
Place of birth - Native, outside of US (%) - Multirace
Place of birth - Native, outside of US (%) - Other Race
Place of birth - Foreign born (%)
Place of birth - Foreign born (%) - White
Place of birth - Foreign born (%) - Black or African American
Place of birth - Foreign born (%) - Asian
Place of birth - Foreign born (%) - Hispanic or Latino
Place of birth - Foreign born (%) - American Indian and Alaska Native
Place of birth - Foreign born (%) - Multirace
Place of birth - Foreign born (%) - Other Race
Residents speaking English at home (%)
Residents speaking English at home - Born in the United States (%)
Residents speaking English at home - Native, born elsewhere (%)
Residents speaking English at home - Foreign born (%)
Residents speaking Spanish at home (%)
Residents speaking Spanish at home - Born in the United States (%)
Residents speaking Spanish at home - Native, born elsewhere (%)
Residents speaking Spanish at home - Foreign born (%)
Residents speaking other language at home (%)
Residents speaking other language at home - Born in the United States (%)
Residents speaking other language at home - Native, born elsewhere (%)
Residents speaking other language at home - Foreign born (%)
Marital status - Never married (%)
Marital status - Now married (%)
Marital status - Separated (%)
Marital status - Widowed (%)
Marital status - Divorced (%)
Ancestries Reported - Arab (%)
Ancestries Reported - Czech (%)
Ancestries Reported - Danish (%)
Ancestries Reported - Dutch (%)
Ancestries Reported - English (%)
Ancestries Reported - French (%)
Ancestries Reported - French Canadian (%)
Ancestries Reported - German (%)
Ancestries Reported - Greek (%)
Ancestries Reported - Hungarian (%)
Ancestries Reported - Irish (%)
Ancestries Reported - Italian (%)
Ancestries Reported - Lithuanian (%)
Ancestries Reported - Norwegian (%)
Ancestries Reported - Polish (%)
Ancestries Reported - Portuguese (%)
Ancestries Reported - Russian (%)
Ancestries Reported - Scotch-Irish (%)
Ancestries Reported - Scottish (%)
Ancestries Reported - Slovak (%)
Ancestries Reported - Subsaharan African (%)
Ancestries Reported - Swedish (%)
Ancestries Reported - Swiss (%)
Ancestries Reported - Ukrainian (%)
Ancestries Reported - United States (%)
Ancestries Reported - Welsh (%)
Ancestries Reported - West Indian (%)
Ancestries Reported - Other (%)
Geographical mobility - Same house 1 year ago (%)
Geographical mobility - Same house 1 year ago (%) - White
Geographical mobility - Same house 1 year ago (%) - Black or African American
Geographical mobility - Same house 1 year ago (%) - Asian
Geographical mobility - Same house 1 year ago (%) - Hispanic or Latino
Geographical mobility - Same house 1 year ago (%) - American Indian and Alaska Native
Geographical mobility - Same house 1 year ago (%) - Multirace
Geographical mobility - Same house 1 year ago (%) - Other Race
Geographical mobility - Moved within same county (%)
Geographical mobility - Moved within same county (%) - White
Geographical mobility - Moved within same county (%) - Black or African American
Geographical mobility - Moved within same county (%) - Asian
Geographical mobility - Moved within same county (%) - Hispanic or Latino
Geographical mobility - Moved within same county (%) - American Indian and Alaska Native
Geographical mobility - Moved within same county (%) - Multirace
Geographical mobility - Moved within same county (%) - Other Race
Geographical mobility - Moved from different county within same state (%)
Geographical mobility - Moved from different county within same state (%) - White
Geographical mobility - Moved from different county within same state (%) - Black or African American
Geographical mobility - Moved from different county within same state (%) - Asian
Geographical mobility - Moved from different county within same state (%) - Hispanic or Latino
Geographical mobility - Moved from different county within same state (%) - American Indian and Alaska Native
Geographical mobility - Moved from different county within same state (%) - Multirace
Geographical mobility - Moved from different county within same state (%) - Other Race
Geographical mobility - Moved from different state (%)
Geographical mobility - Moved from different state (%) - White
Geographical mobility - Moved from different state (%) - Black or African American
Geographical mobility - Moved from different state (%) - Asian
Geographical mobility - Moved from different state (%) - Hispanic or Latino
Geographical mobility - Moved from different state (%) - American Indian and Alaska Native
Geographical mobility - Moved from different state (%) - Multirace
Geographical mobility - Moved from different state (%) - Other Race
Geographical mobility - Moved from abroad (%)
Geographical mobility - Moved from abroad (%) - White
Geographical mobility - Moved from abroad (%) - Black or African American
Geographical mobility - Moved from abroad (%) - Asian
Geographical mobility - Moved from abroad (%) - Hispanic or Latino
Geographical mobility - Moved from abroad (%) - American Indian and Alaska Native
Geographical mobility - Moved from abroad (%) - Multirace
Geographical mobility - Moved from abroad (%) - Other Race
Place of birth for the foreign-born population - Ireland (%)
Place of birth for the foreign-born population - Denmark (%)
Place of birth for the foreign-born population - Norway (%)
Place of birth for the foreign-born population - Sweden (%)
Place of birth for the foreign-born population - United Kingdom (%)
Place of birth for the foreign-born population - England (%)
Place of birth for the foreign-born population - Scotland (%)
Place of birth for the foreign-born population - Other Northern Europe (%)
Place of birth for the foreign-born population - Austria (%)
Place of birth for the foreign-born population - Belgium (%)
Place of birth for the foreign-born population - France (%)
Place of birth for the foreign-born population - Germany (%)
Place of birth for the foreign-born population - Netherlands (%)
Place of birth for the foreign-born population - Switzerland (%)
Place of birth for the foreign-born population - Other Western Europe (%)
Place of birth for the foreign-born population - Greece (%)
Place of birth for the foreign-born population - Italy (%)
Place of birth for the foreign-born population - Portugal (%)
Place of birth for the foreign-born population - Spain (%)
Place of birth for the foreign-born population - Other Southern Europe (%)
Place of birth for the foreign-born population - Albania (%)
Place of birth for the foreign-born population - Belarus (%)
Place of birth for the foreign-born population - Bosnia and Herzegovina (%)
Place of birth for the foreign-born population - Bulgaria (%)
Place of birth for the foreign-born population - Croatia (%)
Place of birth for the foreign-born population - Czechoslovakia (%)
Place of birth for the foreign-born population - Hungary (%)
Place of birth for the foreign-born population - Latvia (%)
Place of birth for the foreign-born population - Lithuania (%)
Place of birth for the foreign-born population - North Macedonia (Macedonia) (%)
Place of birth for the foreign-born population - Moldova (%)
Place of birth for the foreign-born population - Poland (%)
Place of birth for the foreign-born population - Romania (%)
Place of birth for the foreign-born population - Russia (%)
Place of birth for the foreign-born population - Serbia (%)
Place of birth for the foreign-born population - Ukraine (%)
Place of birth for the foreign-born population - Other Eastern Europe (%)
Place of birth for the foreign-born population - China (%)
Place of birth for the foreign-born population - Hong Kong (%)
Place of birth for the foreign-born population - Taiwan (%)
Place of birth for the foreign-born population - Japan (%)
Place of birth for the foreign-born population - Korea (%)
Place of birth for the foreign-born population - Other Eastern Asia (%)
Place of birth for the foreign-born population - Afghanistan (%)
Place of birth for the foreign-born population - Bangladesh (%)
Place of birth for the foreign-born population - India (%)
Place of birth for the foreign-born population - Iran (%)
Place of birth for the foreign-born population - Kazakhstan (%)
Place of birth for the foreign-born population - Nepal (%)
Place of birth for the foreign-born population - Pakistan (%)
Place of birth for the foreign-born population - Sri Lanka (%)
Place of birth for the foreign-born population - Uzbekistan (%)
Place of birth for the foreign-born population - Other South Central Asia (%)
Place of birth for the foreign-born population - Burma (%)
Place of birth for the foreign-born population - Cambodia (%)
Place of birth for the foreign-born population - Indonesia (%)
Place of birth for the foreign-born population - Laos (%)
Place of birth for the foreign-born population - Malaysia (%)
Place of birth for the foreign-born population - Philippines (%)
Place of birth for the foreign-born population - Singapore (%)
Place of birth for the foreign-born population - Thailand (%)
Place of birth for the foreign-born population - Vietnam (%)
Place of birth for the foreign-born population - Other South Eastern Asia (%)
Place of birth for the foreign-born population - Armenia (%)
Place of birth for the foreign-born population - Iraq (%)
Place of birth for the foreign-born population - Israel (%)
Place of birth for the foreign-born population - Jordan (%)
Place of birth for the foreign-born population - Kuwait (%)
Place of birth for the foreign-born population - Lebanon (%)
Place of birth for the foreign-born population - Saudi Arabia (%)
Place of birth for the foreign-born population - Syria (%)
Place of birth for the foreign-born population - Turkey (%)
Place of birth for the foreign-born population - Yemen (%)
Place of birth for the foreign-born population - Other Western Asia (%)
Place of birth for the foreign-born population - Eritrea (%)
Place of birth for the foreign-born population - Ethiopia (%)
Place of birth for the foreign-born population - Kenya (%)
Place of birth for the foreign-born population - Somalia (%)
Place of birth for the foreign-born population - Uganda (%)
Place of birth for the foreign-born population - Zimbabwe (%)
Place of birth for the foreign-born population - Other Eastern Africa (%)
Place of birth for the foreign-born population - Cameroon (%)
Place of birth for the foreign-born population - Congo (%)
Place of birth for the foreign-born population - Democratic Republic of Congo (Zaire) (%)
Place of birth for the foreign-born population - Other Middle Africa (%)
Place of birth for the foreign-born population - Egypt (%)
Place of birth for the foreign-born population - Morocco (%)
Place of birth for the foreign-born population - Sudan (%)
Place of birth for the foreign-born population - Other Northern Africa (%)
Place of birth for the foreign-born population - South Africa (%)
Place of birth for the foreign-born population - Other Southern Africa (%)
Place of birth for the foreign-born population - Cabo Verde (%)
Place of birth for the foreign-born population - Ghana (%)
Place of birth for the foreign-born population - Liberia (%)
Place of birth for the foreign-born population - Nigeria (%)
Place of birth for the foreign-born population - Senegal (%)
Place of birth for the foreign-born population - Sierra Leone (%)
Place of birth for the foreign-born population - Other Western Africa (%)
Place of birth for the foreign-born population - Australia (%)
Place of birth for the foreign-born population - New Zealand (%)
Place of birth for the foreign-born population - Fiji (%)
Place of birth for the foreign-born population - Micronesia (%)
Place of birth for the foreign-born population - Bahamas (%)
Place of birth for the foreign-born population - Barbados (%)
Place of birth for the foreign-born population - Cuba (%)
Place of birth for the foreign-born population - Dominica (%)
Place of birth for the foreign-born population - Dominican Republic (%)
Place of birth for the foreign-born population - Grenada (%)
Place of birth for the foreign-born population - Haiti (%)
Place of birth for the foreign-born population - Jamaica (%)
Place of birth for the foreign-born population - St. Vincent and the Grenadines (%)
Place of birth for the foreign-born population - Trinidad and Tobago (%)
Place of birth for the foreign-born population - West Indies (%)
Place of birth for the foreign-born population - Other Caribbean (%)
Place of birth for the foreign-born population - Belize (%)
Place of birth for the foreign-born population - Costa Rica (%)
Place of birth for the foreign-born population - El Salvador (%)
Place of birth for the foreign-born population - Guatemala (%)
Place of birth for the foreign-born population - Honduras (%)
Place of birth for the foreign-born population - Mexico (%)
Place of birth for the foreign-born population - Nicaragua (%)
Place of birth for the foreign-born population - Panama (%)
Place of birth for the foreign-born population - Other Central America (%)
Place of birth for the foreign-born population - Argentina (%)
Place of birth for the foreign-born population - Bolivia (%)
Place of birth for the foreign-born population - Brazil (%)
Place of birth for the foreign-born population - Chile (%)
Place of birth for the foreign-born population - Colombia (%)
Place of birth for the foreign-born population - Ecuador (%)
Place of birth for the foreign-born population - Guyana (%)
Place of birth for the foreign-born population - Peru (%)
Place of birth for the foreign-born population - Uruguay (%)
Place of birth for the foreign-born population - Venezuela (%)
Place of birth for the foreign-born population - Other South America (%)
Place of birth for the foreign-born population - Canada (%)
Place of birth for the foreign-born population - Other Northern America (%)
Place of birth for the foreign-born population - Other (%)
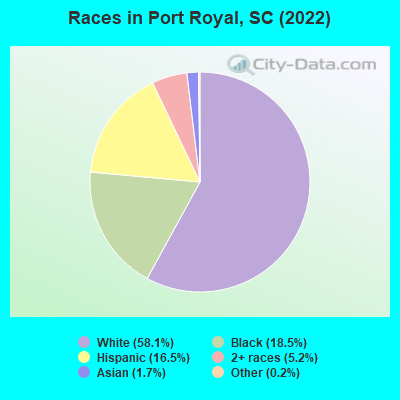
According to 2022 data, the most numerous races in Port Royal, SC are White alone (8,788 residents), Black alone (2,807 residents), and Hispanic (2,503 residents). 88.9% of Port Royal residents speak English at home. 4.1% of Port Royal, SC residents are foreign-born (3.1% born in Latin America, 0.5% born in Asia), which is 23.1% less than the foreign-born rate of 5.0% across the entire state of South Carolina.
Race distribution in Port Royal
2000 2022
2,652,291 66.1% White alone 1,178,486 29.4% Black alone 95,076 2.4% Hispanic 35,568 0.9% Asian alone 33,290 0.8% Two or more races 12,765 0.3% American Indian alone 3,266 0.08% Other race alone 1,270 0.03% Native Hawaiian and Other
3,301,739 62.5% White alone 1,313,290 24.9% Black alone 343,783 6.5% Hispanic 190,508 3.6% Two or more races 89,888 1.7% Asian alone 29,390 0.6% Other race alone 12,112 0.2% American Indian alone 1,924 0.04% Native Hawaiian and Other
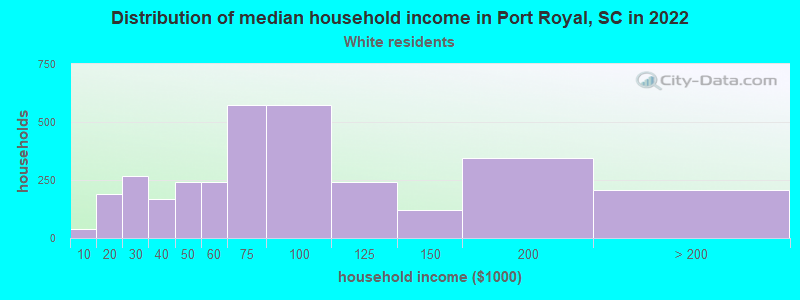
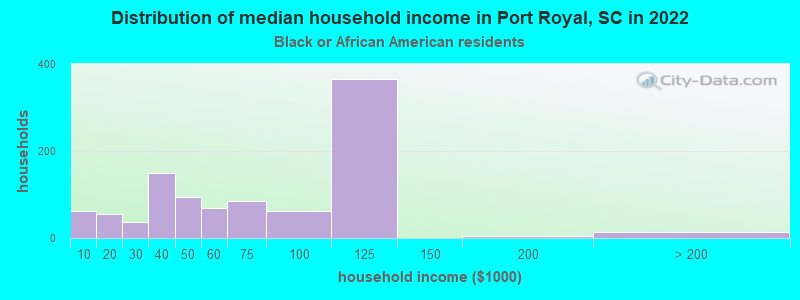
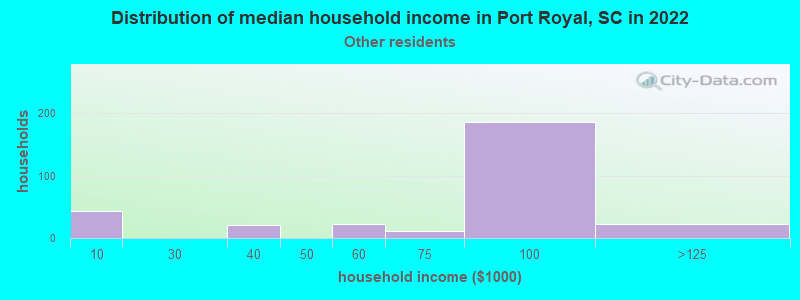
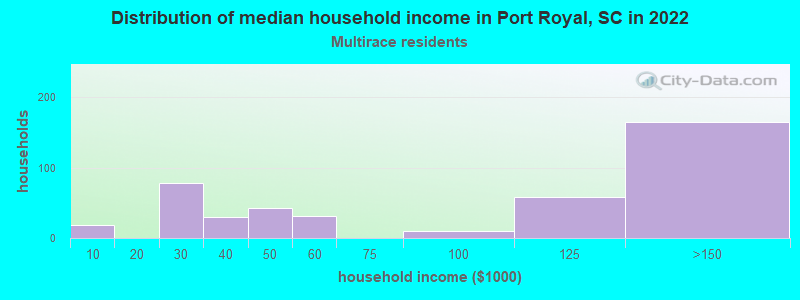
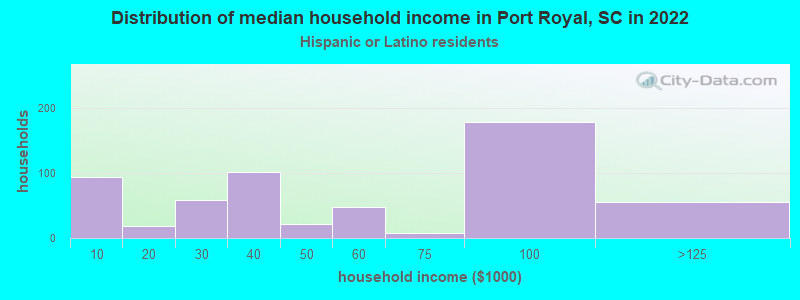
Income and house value in Port Royal Median household income in 2022 $72,906 White non-Hispanic householders$51,489 Black householders$119,080 Some other race householders$60,064 Hispanic or Latino race householdersMedian 2022 house value $401,561 White Non-Hispanic householders$342,321 Black or African American householders $687,604 Asian householders$300,007 Some other race householders$317,356 Two or more races householders$300,007 Hispanic or Latino householders
Median age by race in Port Royal
28.6 Median age for White residents24.4 33.5 30.1 Median age for Black or African American residents38.9 26.0 -345,679,012.0 Median age for American Indian / Alaska Native residents-464,419,475.2 -659,400,544.3 32.6 Median age for Asian residents30.5 31.8 -698,412,697.7 Median age for Native Hawaiian / Pacific Islander residents-551,574,375.1 -666,666,666.0 22.5 Median age for Other race residents18.2 28.9 24.4 Median age for Two or more races residents22.2 32.6 31.0 Median age for White alone residents25.7 41.5 20.4 Median age for Hispanic or Latino residents19.7 21.2
Owner/renter occupied households by race in Port Royal
House owners and renters - White residents 1,275 38.8% Owner occupied2,009 61.2% Renter occupiedHouse owners and renters - Black or African American residents 350 30.1% Owner occupied813 69.9% Renter occupiedHouse owners and renters - Other race residents 20 7.3% Owner occupied259 92.7% Renter occupiedHouse owners and renters - Two or more races residents 219 57.2% Owner occupied164 42.8% Renter occupiedHouse owners and renters - White alone residents 1,270 39.7% Owner occupied1,929 60.3% Renter occupiedHouse owners and renters - Hispanic or Latino residents 78 14.4% Owner occupied462 85.6% Renter occupied
Language usage in Port Royal
English speakers - Total 88.9% of residents of Port Royal speak English at home.
10.1% of residents speak Spanish at home 1,203 83.5% Speak English very well238 16.5% Speak English less than very well1.9% of residents speak other language at home 237 88.4% Speak English very well31 11.6% Speak English less than very well
English speakers - Born in the United States 91.6% of residents of Port Royal speak English at home.
9.9% of residents speak Spanish at home 1,007 95.5% Speak English very well47 4.5% Speak English less than very well0.5% of residents speak other language at home 55 100.0% Speak English very well
English speakers - Native, born elsewhere 48.6% of residents of Port Royal speak English at home.
21.2% of residents speak Spanish at home 41 78.8% Speak English very well11 21.2% Speak English less than very well64.5% of residents speak other language at home 158 100.0% Speak English very well
English speakers - Foreign-born 10.6% of residents of Port Royal speak English at home.
77.6% of residents speak Spanish at home 310 66.4% Speak English very well157 33.6% Speak English less than very well17.9% of residents speak other language at home 77 71.3% Speak English very well31 28.7% Speak English less than very well
White (Caucasian) - Speak only English Native:
97.4% (8,806)Foreign-born:
58.3% (55)
White (Caucasian) - Speak another language Native:
2.6% (237)Foreign-born:
41.8% (39)
Black or African American - Speak another language Native:
3.3% (86)Foreign-born:
100.0% (54)
Asian - Speak only English Native:
86.4% (159)Foreign-born:
9.2% (7)
Asian - Speak another language Native:
9.7% (18)Foreign-born:
91.8% (65)
Other race - Speak only English Native:
9.6% (41)Foreign-born:
0.6% (2)
Other race - Speak another language Native:
95.3% (413)Foreign-born:
100.0% (330)
Two or more races - Speak another language Native:
17.2% (280)Foreign-born:
91.8% (62)
White alone - Speak only English Native:
98.7% (8,315)Foreign-born:
100.0% (57)
Hispanic or Latino - Speak only English Native:
62.5% (1,124)Foreign-born:
0.8% (3)
Hispanic or Latino - Speak another language Native:
41.3% (742)Foreign-born:
100.0% (395)
Foreign-born residents in Port Royal 615 residents are foreign born (3.1% Latin America , 0.5% Asia ).
This city:
4.1%South Carolina:
5.3%
Marital status for residents in Port Royal Marital status - White (Caucasian) population 15 years and over
Males 53.4% Never married40.4% Now married0.6% Separated1.0% Widowed4.7% DivorcedFemales 19.1% Never married64.1% Now married1.1% Separated7.1% Widowed8.5% DivorcedWomen who gave birth in the past 12 months Now married:
74.2% (70)Unmarried:
25.8% (24)
Women who did not give birth in the past 12 months Now married:
65.6% (1,221)Unmarried:
34.4% (640)
Marital status - Black or African American population 15 years and over
Males 47.8% Never married24.0% Now married1.4% Separated0.0% Widowed26.9% DivorcedFemales 63.2% Never married15.5% Now married0.0% Separated8.8% Widowed12.6% DivorcedWomen who gave birth in the past 12 months Now married:
77.6% (54)Unmarried:
22.4% (16)
Women who did not give birth in the past 12 months Now married:
11.6% (78)Unmarried:
88.4% (596)
Marital status - Asian population 15 years and over
Males 51.8% Never married0.0% Now married0.0% Separated0.0% Widowed48.2% DivorcedFemales 5.4% Never married94.6% Now married0.0% Separated0.0% Widowed0.0% DivorcedWomen who did not give birth in the past 12 months Now married:
94.6% (156)Unmarried:
5.4% (9)
Marital status - Other race population 15 years and over
Males 70.3% Never married27.8% Now married2.0% Separated0.0% Widowed0.0% DivorcedFemales 33.3% Never married66.7% Now married0.0% Separated0.0% Widowed0.0% DivorcedWomen who gave birth in the past 12 months Now married:
100.0% (19)Unmarried:
0.0% (0)
Women who did not give birth in the past 12 months Now married:
64.8% (225)Unmarried:
35.2% (122)
Marital status - Two or more races population 15 years and over
Males 80.3% Never married16.4% Now married0.0% Separated0.0% Widowed3.3% DivorcedFemales 28.3% Never married50.2% Now married0.0% Separated1.9% Widowed19.6% DivorcedWomen who did not give birth in the past 12 months Now married:
52.9% (220)Unmarried:
47.1% (196)
Marital status - White alone, not Hispanic / Latino population 15 years and over
Males 51.4% Never married41.8% Now married0.7% Separated1.1% Widowed5.1% DivorcedFemales 17.1% Never married65.4% Now married1.2% Separated7.2% Widowed9.1% DivorcedWomen who gave birth in the past 12 months Now married:
83.7% (71)Unmarried:
16.3% (14)
Women who did not give birth in the past 12 months Now married:
67.1% (1,151)Unmarried:
32.9% (563)
Marital status - Hispanic or Latino population 15 years and over
Males 70.9% Never married26.7% Now married0.8% Separated0.0% Widowed1.6% DivorcedFemales 40.8% Never married48.5% Now married0.0% Separated3.2% Widowed7.5% DivorcedWomen who gave birth in the past 12 months Now married:
56.0% (16)Unmarried:
44.0% (12)
Women who did not give birth in the past 12 months Now married:
52.5% (329)Unmarried:
47.5% (297)
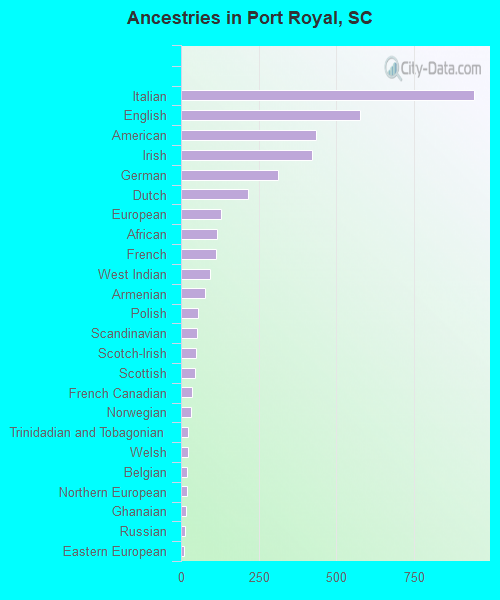
Ancestries in Port Royal
944 13.5% Italian575 8.2% English433 6.2% American422 6.0% Irish312 4.5% German217 3.1% Dutch129 1.8% European115 1.6% African113 1.6% French92 1.3% West Indian78 1.1% Armenian55 0.8% Polish53 0.8% Scandinavian47 0.7% Scotch-Irish44 0.6% Scottish37 0.5% French Canadian32 0.5% Norwegian23 0.3% Trinidadian and Tobagonian21 0.3% Welsh20 0.3% Belgian20 0.3% Northern European16 0.2% Ghanaian14 0.2% Russian11 0.2% Eastern European8 0.1% Jamaican
Geographical mobility in Port Royal Same house 1 year ago 7,027 73.8% White (Caucasian)2,356 83.1% Black or African American45 18.3% Asian577 59.1% Other race1,215 69.5% Two or more races6,713 76.6% White alone, not Hispanic / Latino1,319 54.4% Hispanic or LatinoMoved within same county 330 3.5% White / Caucasian108 3.8% Black or African American26 2.7% Other race31 1.8% Two or more races300 3.4% White alone, not Hispanic / Latino81 3.4% Hispanic or LatinoMoved within same state 890 9.3% White / Caucasian144 5.1% Black or African American58 23.4% Asian890 10.2% White alone, not Hispanic / LatinoMoved from different state 1,596 16.8% White / Caucasian264 9.3% Black or African American122 49.2% Asian516 52.8% Other race732 41.9% Two or more races1,207 13.8% White alone, not Hispanic / Latino1,796 74.1% Hispanic or LatinoMoved from abroad 170 1.8% White11 0.4% Black or African American74 0.8% White alone, not Hispanic / Latino59 2.5% Hispanic or Latino
Children Nativity (place of birth) in Port Royal
Children under 6 years - Living with two parents Both parents native 810 100.0% NativeBoth parents foreign-born 76 100.0% NativeOne native, one foreign-born parent 11 100.0% NativeChildren under 6 years - Living with one parent Native parent 202 100.0% Native
Children 6 to 17 years - Living with two parents Both parents native 598 100.0% NativeBoth parents foreign-born 28 100.0% NativeOne native, one foreign-born parent 103 100.0% NativeChildren 6 to 17 years - Living with one parent Native parent 484 100.0% Native
Grandparents responsible for own grandchildren in Port Royal
Grandparents (30 to 59 years) Black or African American 41 100.0% Not responsible for grandchildren
Grandparents (60 years and over) Black or African American 33 100.0% Not responsible for grandchildren