Races in Port Jervis, New York (NY) Detailed Stats
Data:
Races - White alone (%)
Races - White alone (% change since 2000)
Races - Black alone (%)
Races - Black alone (% change since 2000)
Races - American Indian alone (%)
Races - American Indian alone (% change since 2000)
Races - Asian alone (%)
Races - Asian alone (% change since 2000)
Races - Hispanic (%)
Races - Hispanic (% change since 2000)
Races - Native Hawaiian and Other Pacific Islander alone (%)
Races - Native Hawaiian and Other Pacific Islander alone (% change since 2000)
Races - Two or more races(%)
Races - Two or more races(% change since 2000)
Races - Other race alone (%)
Races - Other race alone (% change since 2000)
Racial diversity
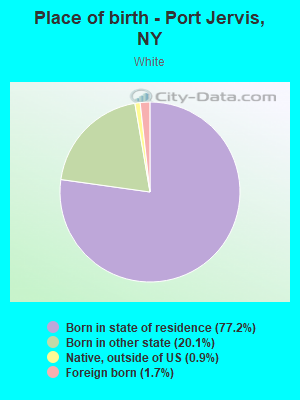
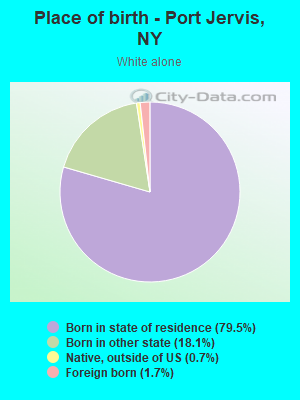
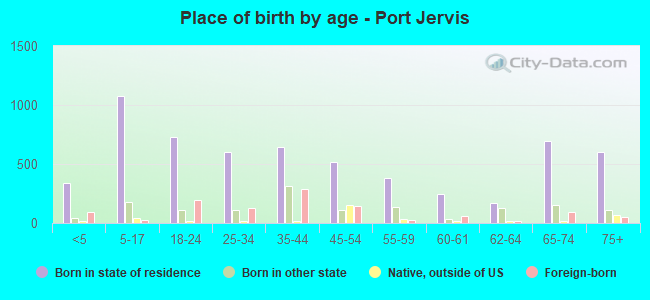
Place of birth - Born in state of residence (%)
Place of birth - Born in state of residence (%) - White
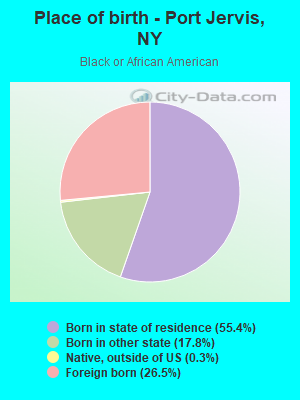
Place of birth - Born in state of residence (%) - Black or African American
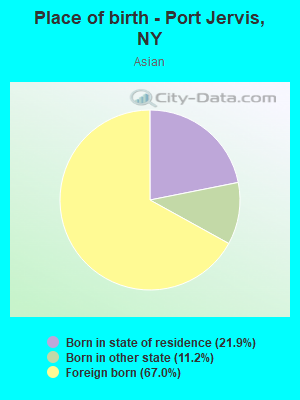
Place of birth - Born in state of residence (%) - Asian
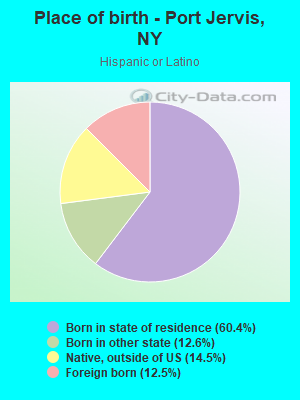
Place of birth - Born in state of residence (%) - Hispanic or Latino
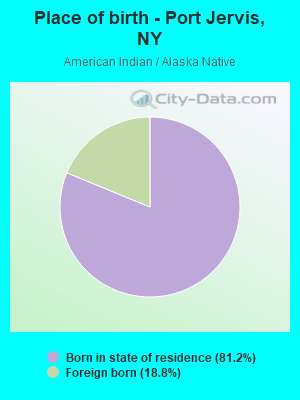
Place of birth - Born in state of residence (%) - American Indian and Alaska Native
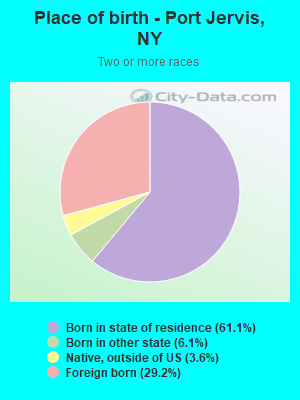
Place of birth - Born in state of residence (%) - Multirace
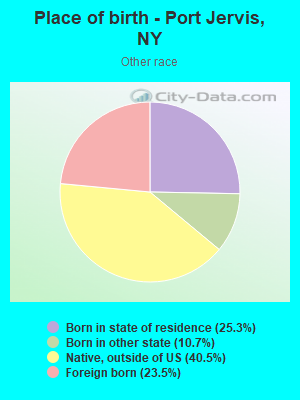
Place of birth - Born in state of residence (%) - Other Race
Place of birth - Born in other state (%)
Place of birth - Born in other state (%) - White
Place of birth - Born in other state (%) - Black or African American
Place of birth - Born in other state (%) - Asian
Place of birth - Born in other state (%) - Hispanic or Latino
Place of birth - Born in other state (%) - American Indian and Alaska Native
Place of birth - Born in other state (%) - Multirace
Place of birth - Born in other state (%) - Other Race
Place of birth - Native, outside of US (%)
Place of birth - Native, outside of US (%) - White
Place of birth - Native, outside of US (%) - Black or African American
Place of birth - Native, outside of US (%) - Asian
Place of birth - Native, outside of US (%) - Hispanic or Latino
Place of birth - Native, outside of US (%) - American Indian and Alaska Native
Place of birth - Native, outside of US (%) - Multirace
Place of birth - Native, outside of US (%) - Other Race
Place of birth - Foreign born (%)
Place of birth - Foreign born (%) - White
Place of birth - Foreign born (%) - Black or African American
Place of birth - Foreign born (%) - Asian
Place of birth - Foreign born (%) - Hispanic or Latino
Place of birth - Foreign born (%) - American Indian and Alaska Native
Place of birth - Foreign born (%) - Multirace
Place of birth - Foreign born (%) - Other Race
Residents speaking English at home (%)
Residents speaking English at home - Born in the United States (%)
Residents speaking English at home - Native, born elsewhere (%)
Residents speaking English at home - Foreign born (%)
Residents speaking Spanish at home (%)
Residents speaking Spanish at home - Born in the United States (%)
Residents speaking Spanish at home - Native, born elsewhere (%)
Residents speaking Spanish at home - Foreign born (%)
Residents speaking other language at home (%)
Residents speaking other language at home - Born in the United States (%)
Residents speaking other language at home - Native, born elsewhere (%)
Residents speaking other language at home - Foreign born (%)
Marital status - Never married (%)
Marital status - Now married (%)
Marital status - Separated (%)
Marital status - Widowed (%)
Marital status - Divorced (%)
Ancestries Reported - Arab (%)
Ancestries Reported - Czech (%)
Ancestries Reported - Danish (%)
Ancestries Reported - Dutch (%)
Ancestries Reported - English (%)
Ancestries Reported - French (%)
Ancestries Reported - French Canadian (%)
Ancestries Reported - German (%)
Ancestries Reported - Greek (%)
Ancestries Reported - Hungarian (%)
Ancestries Reported - Irish (%)
Ancestries Reported - Italian (%)
Ancestries Reported - Lithuanian (%)
Ancestries Reported - Norwegian (%)
Ancestries Reported - Polish (%)
Ancestries Reported - Portuguese (%)
Ancestries Reported - Russian (%)
Ancestries Reported - Scotch-Irish (%)
Ancestries Reported - Scottish (%)
Ancestries Reported - Slovak (%)
Ancestries Reported - Subsaharan African (%)
Ancestries Reported - Swedish (%)
Ancestries Reported - Swiss (%)
Ancestries Reported - Ukrainian (%)
Ancestries Reported - United States (%)
Ancestries Reported - Welsh (%)
Ancestries Reported - West Indian (%)
Ancestries Reported - Other (%)
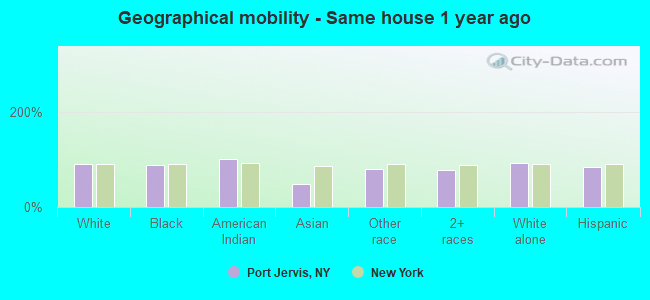
Geographical mobility - Same house 1 year ago (%)
Geographical mobility - Same house 1 year ago (%) - White
Geographical mobility - Same house 1 year ago (%) - Black or African American
Geographical mobility - Same house 1 year ago (%) - Asian
Geographical mobility - Same house 1 year ago (%) - Hispanic or Latino
Geographical mobility - Same house 1 year ago (%) - American Indian and Alaska Native
Geographical mobility - Same house 1 year ago (%) - Multirace
Geographical mobility - Same house 1 year ago (%) - Other Race
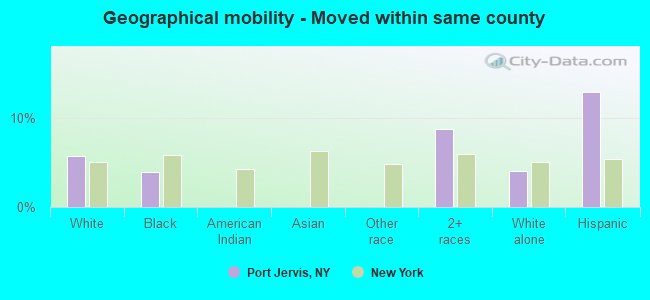
Geographical mobility - Moved within same county (%)
Geographical mobility - Moved within same county (%) - White
Geographical mobility - Moved within same county (%) - Black or African American
Geographical mobility - Moved within same county (%) - Asian
Geographical mobility - Moved within same county (%) - Hispanic or Latino
Geographical mobility - Moved within same county (%) - American Indian and Alaska Native
Geographical mobility - Moved within same county (%) - Multirace
Geographical mobility - Moved within same county (%) - Other Race
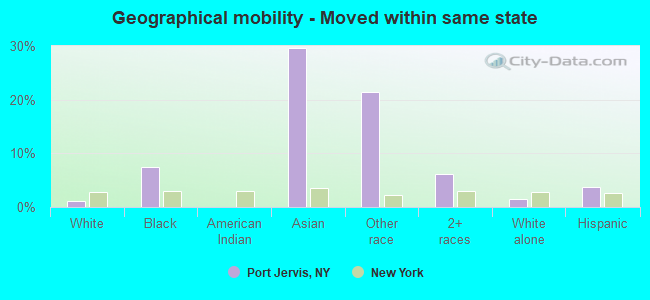
Geographical mobility - Moved from different county within same state (%)
Geographical mobility - Moved from different county within same state (%) - White
Geographical mobility - Moved from different county within same state (%) - Black or African American
Geographical mobility - Moved from different county within same state (%) - Asian
Geographical mobility - Moved from different county within same state (%) - Hispanic or Latino
Geographical mobility - Moved from different county within same state (%) - American Indian and Alaska Native
Geographical mobility - Moved from different county within same state (%) - Multirace
Geographical mobility - Moved from different county within same state (%) - Other Race
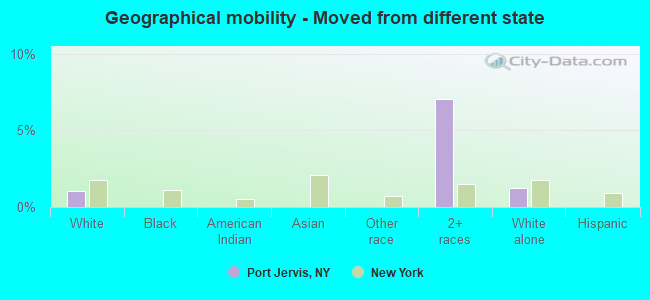
Geographical mobility - Moved from different state (%)
Geographical mobility - Moved from different state (%) - White
Geographical mobility - Moved from different state (%) - Black or African American
Geographical mobility - Moved from different state (%) - Asian
Geographical mobility - Moved from different state (%) - Hispanic or Latino
Geographical mobility - Moved from different state (%) - American Indian and Alaska Native
Geographical mobility - Moved from different state (%) - Multirace
Geographical mobility - Moved from different state (%) - Other Race
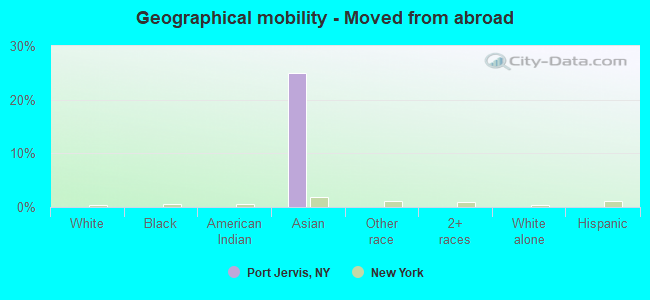
Geographical mobility - Moved from abroad (%)
Geographical mobility - Moved from abroad (%) - White
Geographical mobility - Moved from abroad (%) - Black or African American
Geographical mobility - Moved from abroad (%) - Asian
Geographical mobility - Moved from abroad (%) - Hispanic or Latino
Geographical mobility - Moved from abroad (%) - American Indian and Alaska Native
Geographical mobility - Moved from abroad (%) - Multirace
Geographical mobility - Moved from abroad (%) - Other Race
Place of birth for the foreign-born population - Ireland (%)
Place of birth for the foreign-born population - Denmark (%)
Place of birth for the foreign-born population - Norway (%)
Place of birth for the foreign-born population - Sweden (%)
Place of birth for the foreign-born population - United Kingdom (%)
Place of birth for the foreign-born population - England (%)
Place of birth for the foreign-born population - Scotland (%)
Place of birth for the foreign-born population - Other Northern Europe (%)
Place of birth for the foreign-born population - Austria (%)
Place of birth for the foreign-born population - Belgium (%)
Place of birth for the foreign-born population - France (%)
Place of birth for the foreign-born population - Germany (%)
Place of birth for the foreign-born population - Netherlands (%)
Place of birth for the foreign-born population - Switzerland (%)
Place of birth for the foreign-born population - Other Western Europe (%)
Place of birth for the foreign-born population - Greece (%)
Place of birth for the foreign-born population - Italy (%)
Place of birth for the foreign-born population - Portugal (%)
Place of birth for the foreign-born population - Spain (%)
Place of birth for the foreign-born population - Other Southern Europe (%)
Place of birth for the foreign-born population - Albania (%)
Place of birth for the foreign-born population - Belarus (%)
Place of birth for the foreign-born population - Bosnia and Herzegovina (%)
Place of birth for the foreign-born population - Bulgaria (%)
Place of birth for the foreign-born population - Croatia (%)
Place of birth for the foreign-born population - Czechoslovakia (%)
Place of birth for the foreign-born population - Hungary (%)
Place of birth for the foreign-born population - Latvia (%)
Place of birth for the foreign-born population - Lithuania (%)
Place of birth for the foreign-born population - North Macedonia (Macedonia) (%)
Place of birth for the foreign-born population - Moldova (%)
Place of birth for the foreign-born population - Poland (%)
Place of birth for the foreign-born population - Romania (%)
Place of birth for the foreign-born population - Russia (%)
Place of birth for the foreign-born population - Serbia (%)
Place of birth for the foreign-born population - Ukraine (%)
Place of birth for the foreign-born population - Other Eastern Europe (%)
Place of birth for the foreign-born population - China (%)
Place of birth for the foreign-born population - Hong Kong (%)
Place of birth for the foreign-born population - Taiwan (%)
Place of birth for the foreign-born population - Japan (%)
Place of birth for the foreign-born population - Korea (%)
Place of birth for the foreign-born population - Other Eastern Asia (%)
Place of birth for the foreign-born population - Afghanistan (%)
Place of birth for the foreign-born population - Bangladesh (%)
Place of birth for the foreign-born population - India (%)
Place of birth for the foreign-born population - Iran (%)
Place of birth for the foreign-born population - Kazakhstan (%)
Place of birth for the foreign-born population - Nepal (%)
Place of birth for the foreign-born population - Pakistan (%)
Place of birth for the foreign-born population - Sri Lanka (%)
Place of birth for the foreign-born population - Uzbekistan (%)
Place of birth for the foreign-born population - Other South Central Asia (%)
Place of birth for the foreign-born population - Burma (%)
Place of birth for the foreign-born population - Cambodia (%)
Place of birth for the foreign-born population - Indonesia (%)
Place of birth for the foreign-born population - Laos (%)
Place of birth for the foreign-born population - Malaysia (%)
Place of birth for the foreign-born population - Philippines (%)
Place of birth for the foreign-born population - Singapore (%)
Place of birth for the foreign-born population - Thailand (%)
Place of birth for the foreign-born population - Vietnam (%)
Place of birth for the foreign-born population - Other South Eastern Asia (%)
Place of birth for the foreign-born population - Armenia (%)
Place of birth for the foreign-born population - Iraq (%)
Place of birth for the foreign-born population - Israel (%)
Place of birth for the foreign-born population - Jordan (%)
Place of birth for the foreign-born population - Kuwait (%)
Place of birth for the foreign-born population - Lebanon (%)
Place of birth for the foreign-born population - Saudi Arabia (%)
Place of birth for the foreign-born population - Syria (%)
Place of birth for the foreign-born population - Turkey (%)
Place of birth for the foreign-born population - Yemen (%)
Place of birth for the foreign-born population - Other Western Asia (%)
Place of birth for the foreign-born population - Eritrea (%)
Place of birth for the foreign-born population - Ethiopia (%)
Place of birth for the foreign-born population - Kenya (%)
Place of birth for the foreign-born population - Somalia (%)
Place of birth for the foreign-born population - Uganda (%)
Place of birth for the foreign-born population - Zimbabwe (%)
Place of birth for the foreign-born population - Other Eastern Africa (%)
Place of birth for the foreign-born population - Cameroon (%)
Place of birth for the foreign-born population - Congo (%)
Place of birth for the foreign-born population - Democratic Republic of Congo (Zaire) (%)
Place of birth for the foreign-born population - Other Middle Africa (%)
Place of birth for the foreign-born population - Egypt (%)
Place of birth for the foreign-born population - Morocco (%)
Place of birth for the foreign-born population - Sudan (%)
Place of birth for the foreign-born population - Other Northern Africa (%)
Place of birth for the foreign-born population - South Africa (%)
Place of birth for the foreign-born population - Other Southern Africa (%)
Place of birth for the foreign-born population - Cabo Verde (%)
Place of birth for the foreign-born population - Ghana (%)
Place of birth for the foreign-born population - Liberia (%)
Place of birth for the foreign-born population - Nigeria (%)
Place of birth for the foreign-born population - Senegal (%)
Place of birth for the foreign-born population - Sierra Leone (%)
Place of birth for the foreign-born population - Other Western Africa (%)
Place of birth for the foreign-born population - Australia (%)
Place of birth for the foreign-born population - New Zealand (%)
Place of birth for the foreign-born population - Fiji (%)
Place of birth for the foreign-born population - Micronesia (%)
Place of birth for the foreign-born population - Bahamas (%)
Place of birth for the foreign-born population - Barbados (%)
Place of birth for the foreign-born population - Cuba (%)
Place of birth for the foreign-born population - Dominica (%)
Place of birth for the foreign-born population - Dominican Republic (%)
Place of birth for the foreign-born population - Grenada (%)
Place of birth for the foreign-born population - Haiti (%)
Place of birth for the foreign-born population - Jamaica (%)
Place of birth for the foreign-born population - St. Vincent and the Grenadines (%)
Place of birth for the foreign-born population - Trinidad and Tobago (%)
Place of birth for the foreign-born population - West Indies (%)
Place of birth for the foreign-born population - Other Caribbean (%)
Place of birth for the foreign-born population - Belize (%)
Place of birth for the foreign-born population - Costa Rica (%)
Place of birth for the foreign-born population - El Salvador (%)
Place of birth for the foreign-born population - Guatemala (%)
Place of birth for the foreign-born population - Honduras (%)
Place of birth for the foreign-born population - Mexico (%)
Place of birth for the foreign-born population - Nicaragua (%)
Place of birth for the foreign-born population - Panama (%)
Place of birth for the foreign-born population - Other Central America (%)
Place of birth for the foreign-born population - Argentina (%)
Place of birth for the foreign-born population - Bolivia (%)
Place of birth for the foreign-born population - Brazil (%)
Place of birth for the foreign-born population - Chile (%)
Place of birth for the foreign-born population - Colombia (%)
Place of birth for the foreign-born population - Ecuador (%)
Place of birth for the foreign-born population - Guyana (%)
Place of birth for the foreign-born population - Peru (%)
Place of birth for the foreign-born population - Uruguay (%)
Place of birth for the foreign-born population - Venezuela (%)
Place of birth for the foreign-born population - Other South America (%)
Place of birth for the foreign-born population - Canada (%)
Place of birth for the foreign-born population - Other Northern America (%)
Place of birth for the foreign-born population - Other (%)
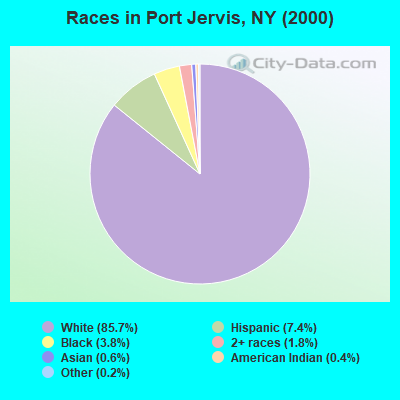
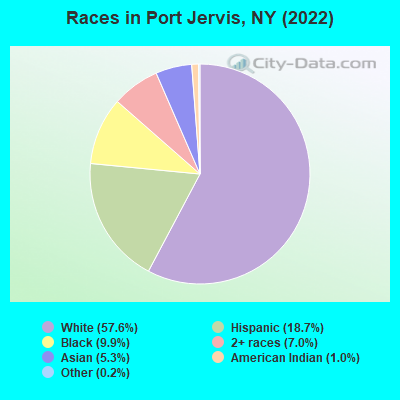
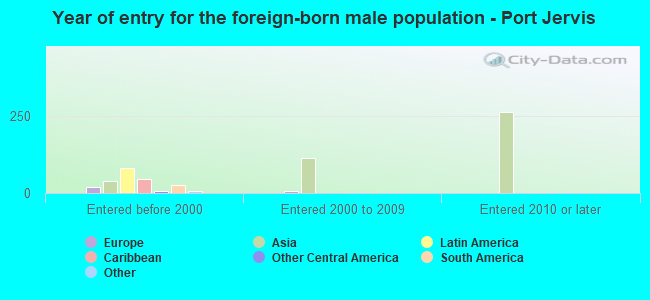
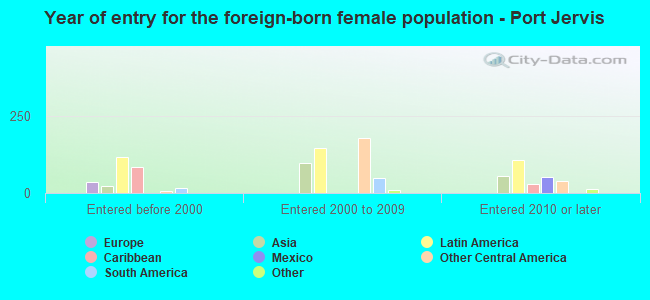
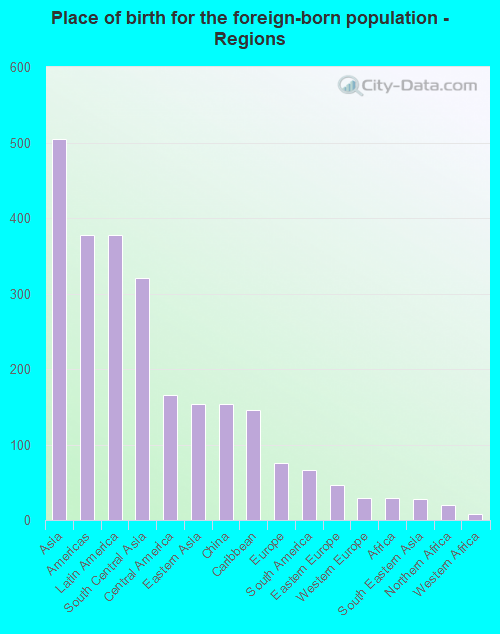
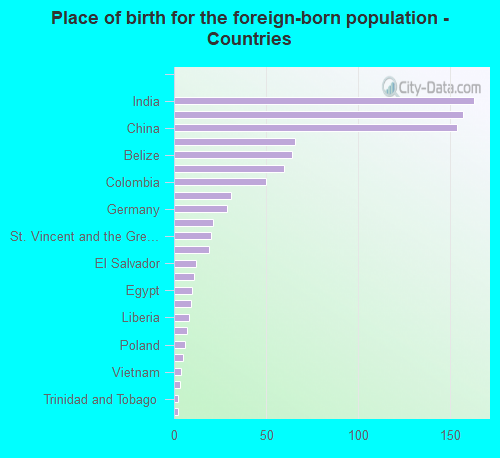
According to 2022 data, the most numerous races in Port Jervis, NY are White alone (5,083 residents), Hispanic (1,649 residents), and Black alone (870 residents). 77.5% of Port Jervis residents speak English at home. 11.2% of Port Jervis, NY residents are foreign-born (5.8% born in Asia, 4.4% born in Latin America), which is 96.6% less than the foreign-born rate of 22.0% across the entire state of New York.
Race distribution in Port Jervis
2000 2022
11,760,981 62.0% White alone 2,867,583 15.1% Hispanic 2,812,623 14.8% Black alone 1,035,926 5.5% Asian alone 366,116 1.9% Two or more races 75,499 0.4% Other race alone 52,499 0.3% American Indian alone 5,230 0.03% Native Hawaiian and Other
10,408,933 52.9% White alone 3,867,299 19.7% Hispanic 2,633,840 13.4% Black alone 1,776,286 9.0% Asian alone 732,670 3.7% Two or more races 216,110 1.1% Other race alone 35,082 0.2% American Indian alone 6,931 0.04% Native Hawaiian and Other
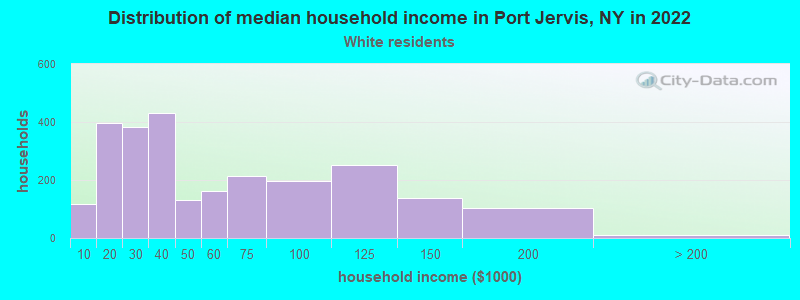
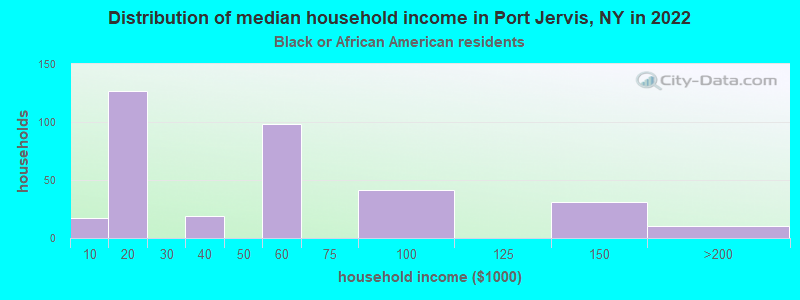
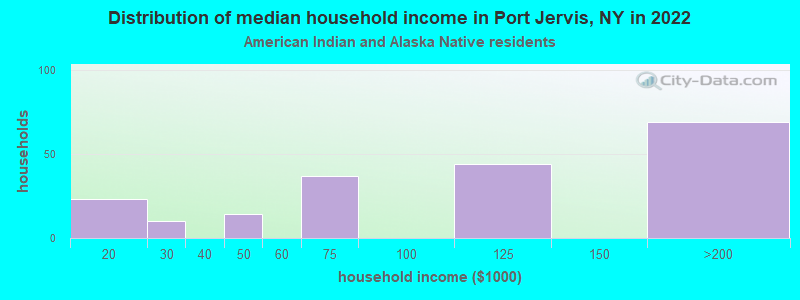
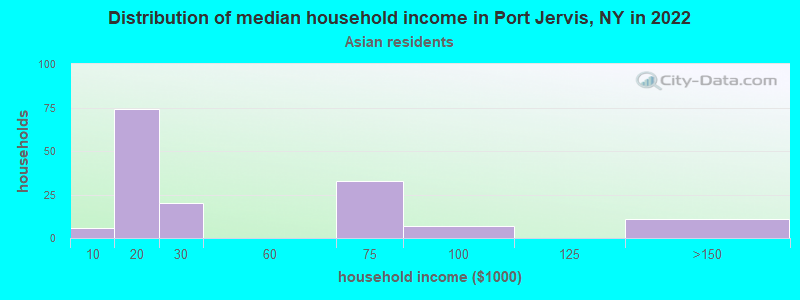
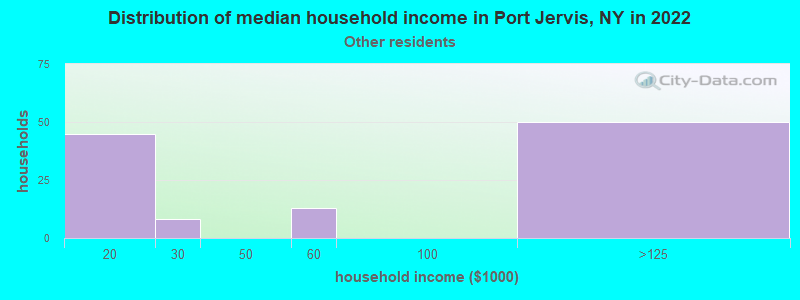
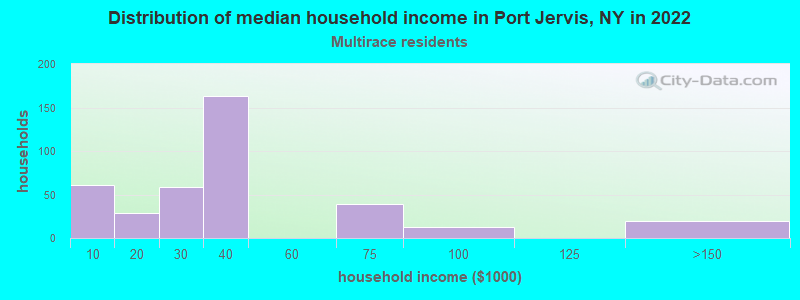
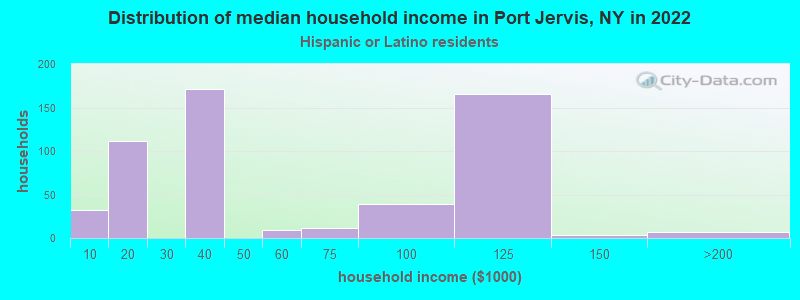
Income and house value in Port Jervis Median household income in 2022 $36,727 White non-Hispanic householders$25,595 Asian householders$33,202 Two or more races householdersMedian 2022 house value $206,833 White Non-Hispanic householders$272,149 Black or African American householders $453,582 Asian householders$157,241 Two or more races householders$272,149 Hispanic or Latino householders
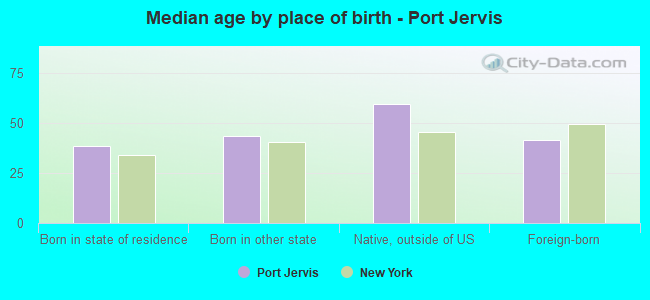
Median age by race in Port Jervis
44.1 Median age for White residents40.0 49.9 37.7 Median age for Black or African American residents54.6 21.4 41.1 Median age for American Indian / Alaska Native residents43.8 33.9 25.6 Median age for Asian residents34.0 24.1 -487,992,314.6 Median age for Native Hawaiian / Pacific Islander residents-477,502,295.2 -497,387,669.3 30.2 Median age for Other race residents44.2 21.1 35.9 Median age for Two or more races residents34.4 61.3 47.8 Median age for White alone residents41.2 53.6 29.7 Median age for Hispanic or Latino residents20.3 29.6
Owner/renter occupied households by race in Port Jervis
House owners and renters - White residents 1,340 53.6% Owner occupied1,161 46.4% Renter occupiedHouse owners and renters - Black or African American residents 86 27.8% Owner occupied224 72.2% Renter occupiedHouse owners and renters - American Indian / Alaska Native residents 93 49.0% Owner occupied97 51.0% Renter occupiedHouse owners and renters - Asian residents 96 63.5% Owner occupied55 36.5% Renter occupiedHouse owners and renters - Other race residents 54 34.5% Owner occupied102 65.5% Renter occupiedHouse owners and renters - Two or more races residents 106 30.3% Owner occupied244 69.7% Renter occupiedHouse owners and renters - White alone residents 1,348 54.3% Owner occupied1,136 45.7% Renter occupiedHouse owners and renters - Hispanic or Latino residents 141 30.5% Owner occupied322 69.5% Renter occupied
Language usage in Port Jervis
English speakers - Total 77.5% of residents of Port Jervis speak English at home.
9.9% of residents speak Spanish at home 469 56.6% Speak English very well360 43.4% Speak English less than very well11.1% of residents speak other language at home 311 33.6% Speak English very well614 66.4% Speak English less than very well
English speakers - Born in the United States 87.4% of residents of Port Jervis speak English at home.
8.3% of residents speak Spanish at home 56 48.7% Speak English very well59 51.3% Speak English less than very well6.7% of residents speak other language at home 59 63.4% Speak English very well34 36.6% Speak English less than very well
English speakers - Native, born elsewhere 11.0% of residents of Port Jervis speak English at home.
87.2% of residents speak Spanish at home 203 85.3% Speak English very well35 14.7% Speak English less than very well
English speakers - Foreign-born 18.8% of residents of Port Jervis speak English at home.
23.2% of residents speak Spanish at home 30 12.9% Speak English very well203 87.1% Speak English less than very well56.8% of residents speak other language at home 154 27.0% Speak English very well416 73.0% Speak English less than very well
White (Caucasian) - Speak only English Native:
92.4% (4,675)Foreign-born:
11.0% (10)
White (Caucasian) - Speak another language Native:
4.6% (232)Foreign-born:
77.8% (73)
Black or African American - Speak only English Native:
94.5% (680)Foreign-born:
62.0% (143)
Black or African American - Speak another language Native:
3.4% (24)Foreign-born:
19.0% (44)
Asian - Speak only English Native:
18.0% (25)Foreign-born:
0.4% (1)
Asian - Speak another language Native:
53.5% (74)Foreign-born:
98.9% (262)
Other race - Speak only English Native:
23.2% (90)Foreign-born:
18.2% (22)
Other race - Speak another language Native:
72.0% (281)Foreign-born:
85.2% (104)
Two or more races - Speak another language Native:
43.9% (315)Foreign-born:
100.0% (347)
White alone - Speak only English Native:
92.5% (4,445)Foreign-born:
8.0% (7)
White alone - Speak another language Native:
2.5% (120)Foreign-born:
85.0% (75)
Hispanic or Latino - Speak only English Native:
57.4% (754)Foreign-born:
1.6% (3)
Hispanic or Latino - Speak another language Native:
42.4% (557)Foreign-born:
99.3% (188)
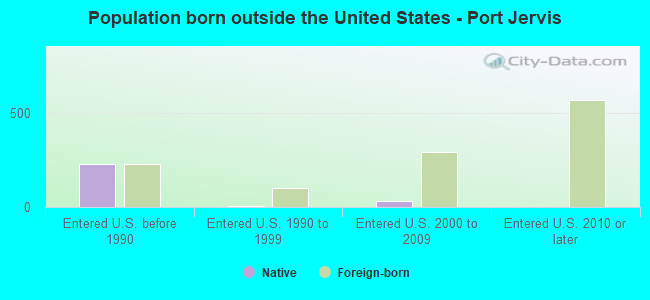
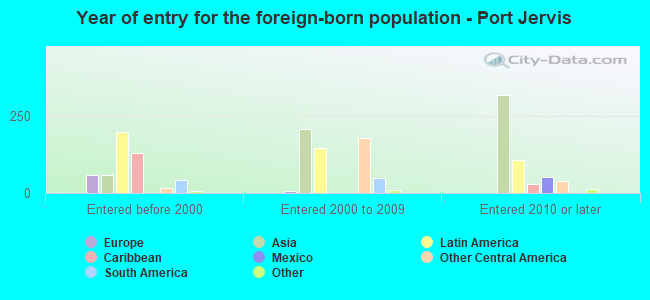
Foreign-born residents in Port Jervis 988 residents are foreign born (5.8% Asia , 4.4% Latin America ).
This city:
11.2%New York:
22.6%
Marital status for residents in Port Jervis Marital status - White (Caucasian) population 15 years and over
Males 44.5% Never married39.0% Now married0.0% Separated2.6% Widowed13.9% DivorcedFemales 33.1% Never married36.8% Now married1.6% Separated18.6% Widowed9.9% DivorcedWomen who gave birth in the past 12 months Now married:
37.3% (27)Unmarried:
62.7% (46)
Women who did not give birth in the past 12 months Now married:
36.0% (389)Unmarried:
64.0% (691)
Marital status - Black or African American population 15 years and over
Males 41.4% Never married24.5% Now married15.8% Separated0.0% Widowed18.2% DivorcedFemales 72.6% Never married9.1% Now married0.0% Separated3.5% Widowed14.9% DivorcedWomen who did not give birth in the past 12 months Now married:
6.1% (25)Unmarried:
93.9% (388)
Marital status - American Indian / Alaska Native population 15 years and over
Males 40.6% Never married51.3% Now married0.0% Separated0.0% Widowed8.0% DivorcedFemales 22.6% Never married45.2% Now married0.0% Separated0.0% Widowed32.3% DivorcedWomen who did not give birth in the past 12 months Now married:
100.0% (20)Unmarried:
0.0% (0)
Marital status - Asian population 15 years and over
Males 28.3% Never married69.6% Now married0.0% Separated0.0% Widowed2.2% DivorcedFemales 29.3% Never married57.1% Now married0.0% Separated13.6% Widowed0.0% DivorcedWomen who gave birth in the past 12 months Now married:
100.0% (31)Unmarried:
0.0% (0)
Women who did not give birth in the past 12 months Now married:
54.3% (57)Unmarried:
45.7% (48)
Marital status - Other race population 15 years and over
Males 28.6% Never married71.4% Now married0.0% Separated0.0% Widowed0.0% DivorcedFemales 26.1% Never married48.4% Now married0.0% Separated2.6% Widowed22.9% DivorcedWomen who did not give birth in the past 12 months Now married:
63.0% (91)Unmarried:
37.0% (53)
Marital status - Two or more races population 15 years and over
Males 45.0% Never married42.8% Now married1.7% Separated4.2% Widowed6.4% DivorcedFemales 21.0% Never married15.5% Now married10.0% Separated13.7% Widowed39.7% DivorcedWomen who gave birth in the past 12 months Now married:
0.0% (0)Unmarried:
100.0% (26)
Women who did not give birth in the past 12 months Now married:
48.1% (35)Unmarried:
51.9% (37)
Marital status - White alone, not Hispanic / Latino population 15 years and over
Males 46.1% Never married36.8% Now married0.0% Separated2.8% Widowed14.3% DivorcedFemales 31.2% Never married36.8% Now married1.7% Separated19.7% Widowed10.6% DivorcedWomen who gave birth in the past 12 months Now married:
37.3% (29)Unmarried:
62.7% (49)
Women who did not give birth in the past 12 months Now married:
36.8% (369)Unmarried:
63.2% (634)
Marital status - Hispanic or Latino population 15 years and over
Males 36.6% Never married49.0% Now married0.0% Separated3.2% Widowed11.1% DivorcedFemales 34.5% Never married37.6% Now married0.0% Separated7.5% Widowed20.4% DivorcedWomen who did not give birth in the past 12 months Now married:
47.4% (163)Unmarried:
52.6% (181)
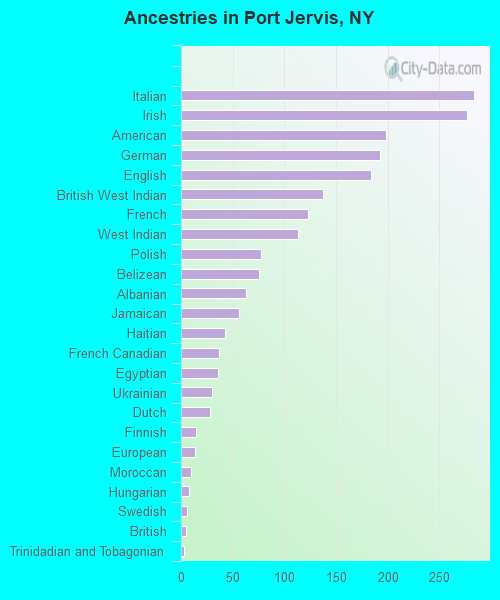
Ancestries in Port Jervis
284 7.9% Italian277 7.7% Irish198 5.5% American193 5.3% German184 5.1% English137 3.8% British West Indian123 3.4% French113 3.1% West Indian77 2.1% Polish76 2.1% Belizean63 1.7% Albanian56 1.6% Jamaican43 1.2% Haitian37 1.0% French Canadian36 1.0% Egyptian30 0.8% Ukrainian28 0.8% Dutch15 0.4% Finnish14 0.4% European10 0.3% Moroccan8 0.2% Hungarian6 0.2% Swedish5 0.1% British3 0.08% Trinidadian and Tobagonian
Children Nativity (place of birth) in Port Jervis
Children under 6 years - Living with two parents Both parents native 296 100.0% NativeBoth parents foreign-born 13 19.9% Native53 80.1% Foreign-bornChildren under 6 years - Living with one parent Native parent 208 100.0% NativeChildren 6 to 17 years - Living with two parents Both parents native 500 100.0% NativeBoth parents foreign-born 45 59.1% Native31 40.9% Foreign-bornOne native, one foreign-born parent 71 100.0% NativeChildren 6 to 17 years - Living with one parent Native parent 457 100.0% NativeForeign-born parent 222 51.7% Native207 48.3% Foreign-born
Grandparents responsible for own grandchildren in Port Jervis
Grandparents (30 to 59 years) White / Caucasian 26 46.8% Responsible for grandchildren30 53.2% Not responsible for grandchildrenTwo or more races 20 100.0% Not responsible for grandchildrenWhite alone, not Hispanic / Latino 26 41.4% Responsible for grandchildren37 58.6% Not responsible for grandchildrenGrandparents (60 years and over) White / Caucasian 5 5.9% Responsible for grandchildren86 94.1% Not responsible for grandchildrenWhite alone, not Hispanic / Latino 6 6.9% Responsible for grandchildren77 93.1% Not responsible for grandchildren